View Job Status of Scripts
After a script is executed, you can view the details and their current statuses in the Jobs tab.
When a script is executed, the job name displayed is same as the script name. When a script is tested, the job name is displayed as Test-<ScriptName-TimestampEpoch> (milliseconds not included).
To view the job status of scripts and schedules:
In the Jobs tab, search for script jobs by using the following QQL tokens in the search box:
script.category:script.name:script.type:scriptId:
Search for scheduled jobs by using the following QQL tokens in the search box:
job.scheduler.id:job.scheduler.name:
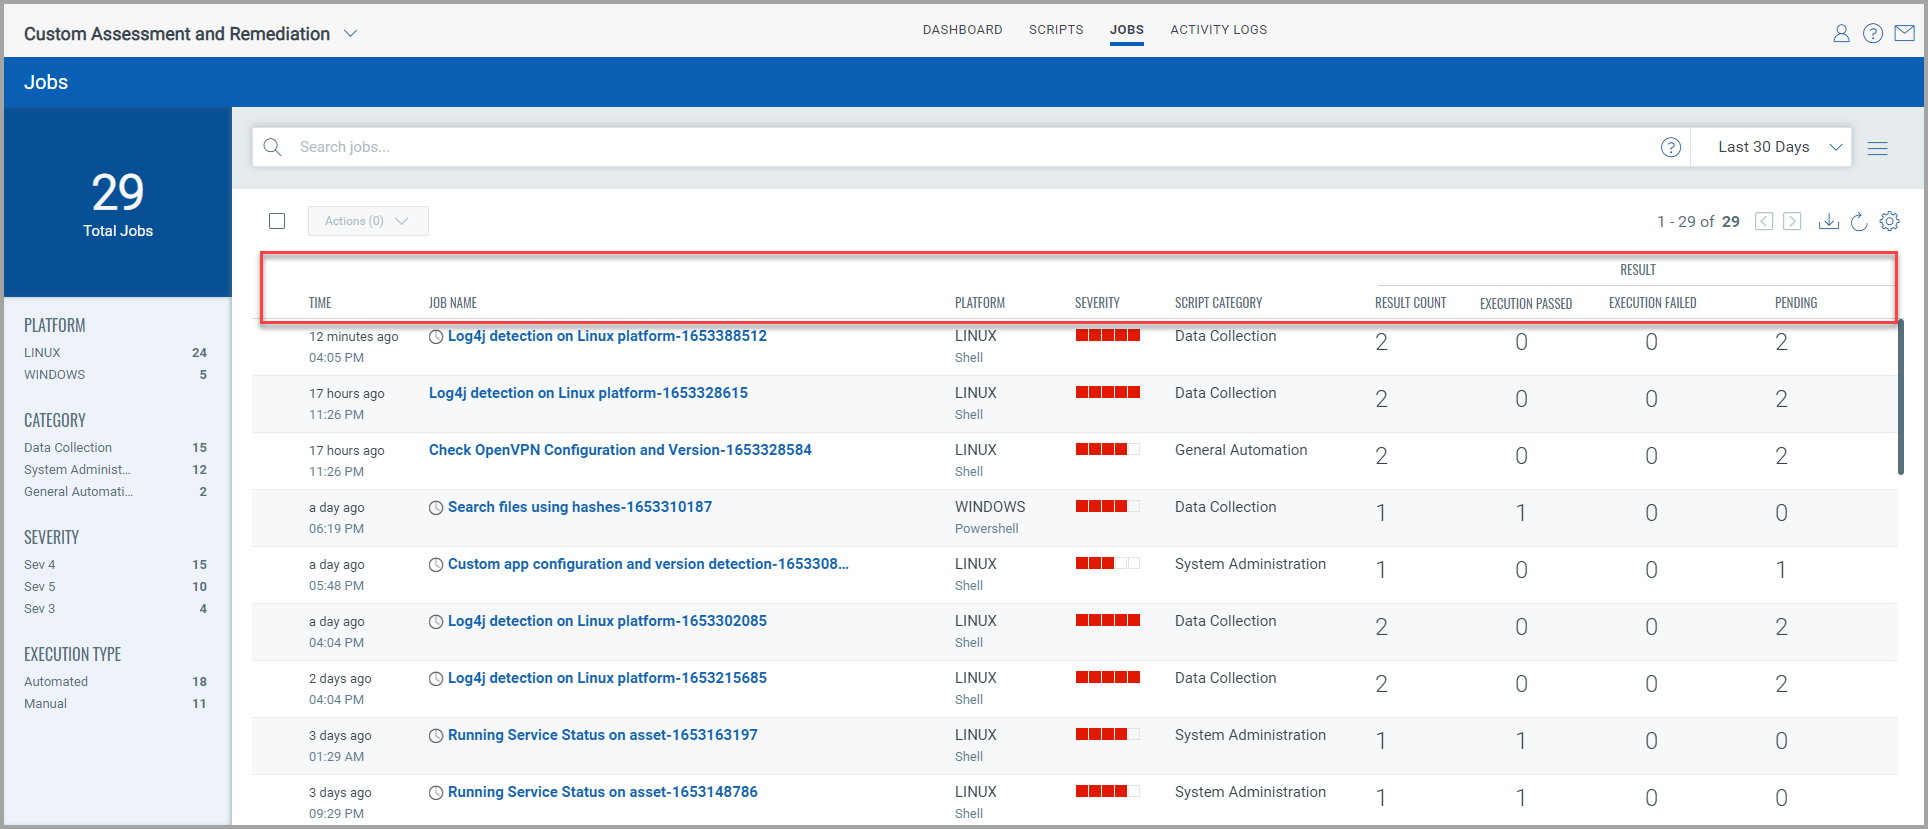
The following details for each script are included in the Jobs tab:
- Time: Date and timestamp of the job performed.
- Job Name: Name of the script executed/tested.
- Platform: Name of the platform on which the script is executed/tested whether Windows or Linux.
- Severity: Severity of the script on the scale of 1 to 5.
- Script Category: Category selected while creating the script.
- Result Count: Total count of assets on which the script is executed or tested.
- Execution Passed: Lists the count of the assets on which the script was successfully executed or tested.
- Execution Failed: Lists the count of the assets on which the script execution or test failed.
- Pending: Lists the count of the assets that are pending for the script execution or testing.
According to the CAR Data Retention policy, the jobs and asset jobs are automatically deleted after 90 days as part of a scheduled job.
You can use the Quick Actions menu to perform the following actions on a selected script job:
- View Details: View various details about the script job that you have selected, such as the time when the job was completed, the assets included in the script, current status of the job, return code and so on.
- View Schedule Details: This is applicable only for scheduled script jobs. You can view the schedule parameters that were specified when the job was created.
- Re-run on All Assets: Execute the job again on all assets that are included in the script.
- Re-run on Failed Assets: Execute the job again on the assets on which the script job failed.
- View Script Details: You can view details such as platform, script type, scripting language, description, category, and so on.
View Details of a Job
You can select the desired job from the list to view specific details. The View Details page provides information about the asset on which the script is executed. Additionally, you can use the Quick Action menu to perform the following tasks:
- View Details: Access detailed information about the script execution, including execution status, timestamps, and output logs.
- Re-run Asset Job: Re-execute the job on the selected asset if necessary, ensuring that all configurations are updated appropriately.
The following job details are displayed on the View Details page:
- Job Finished: Displays the completion date and time of the job.
- Asset Title: Lists the name of the asset on which the job was executed. An alert icon next to the title indicates an issue or warning related to the asset.
- Last Checked In: Displays the last date and time when the asset status is updated.
- Technology: Identifies the platform or scripting language used for the job.
- Status: Describes the current status of the job, such as "MANIFEST_ASSIGN".
- Start Time: Indicates the exact date and time when the job execution started.
- End Time: Displays the exact date and time when the job execution is completed. This field may be empty if the job is incomplete or an issue is encountered.
- Duration (Seconds): Displays the total time taken to execute the job, measured in seconds.
- Return Code: Displays the exit code provided when creating a custom QID script.
Return Code Description
When working with a custom QID script, you can search for job details using the return code description you provided when creating it.
For example, let us consider a custom QID script with the following return codes and their descriptions:
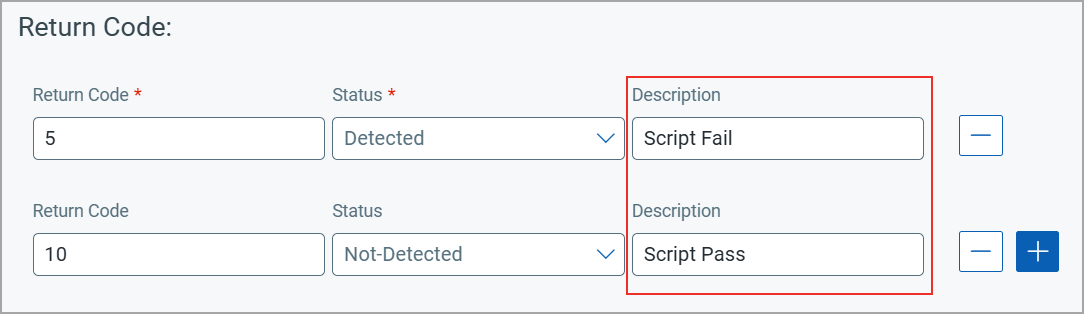
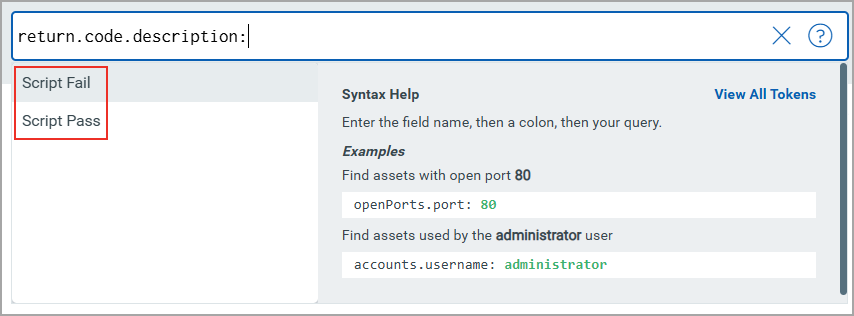
Navigate to the View Details page and enter the token return.code.description in the search bar. As you begin typing, return.code.Description:, the autocomplete suggestions that include a range of relevant return code descriptions are displayed. This helps streamline your search, making it easier to find the specific job details you need.
Type return.code.Description: Script Fail and press Enter to view all the assets on which the script exited with return code 5.
Suggestions are job-specific, ensuring that only applicable descriptions are displayed for each query.