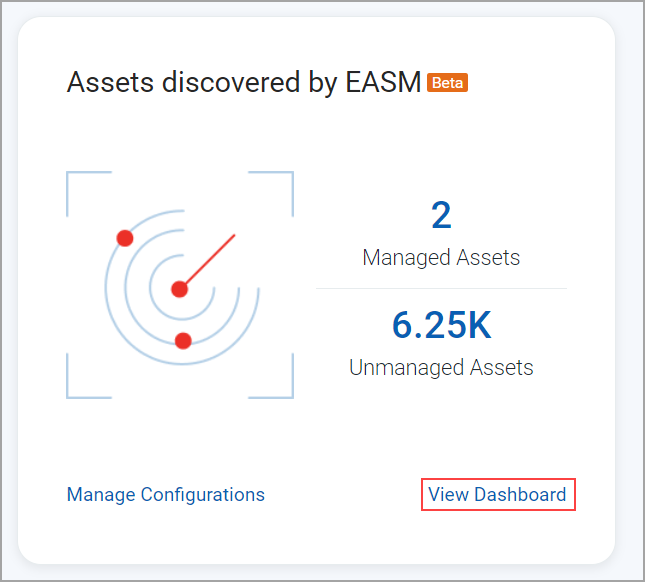
From the Home page, navigate to Discover and Inventory > Expand your Inventory > Integrate with External Sources. Click View Dashboard from the Assets discovered by EASM tile.

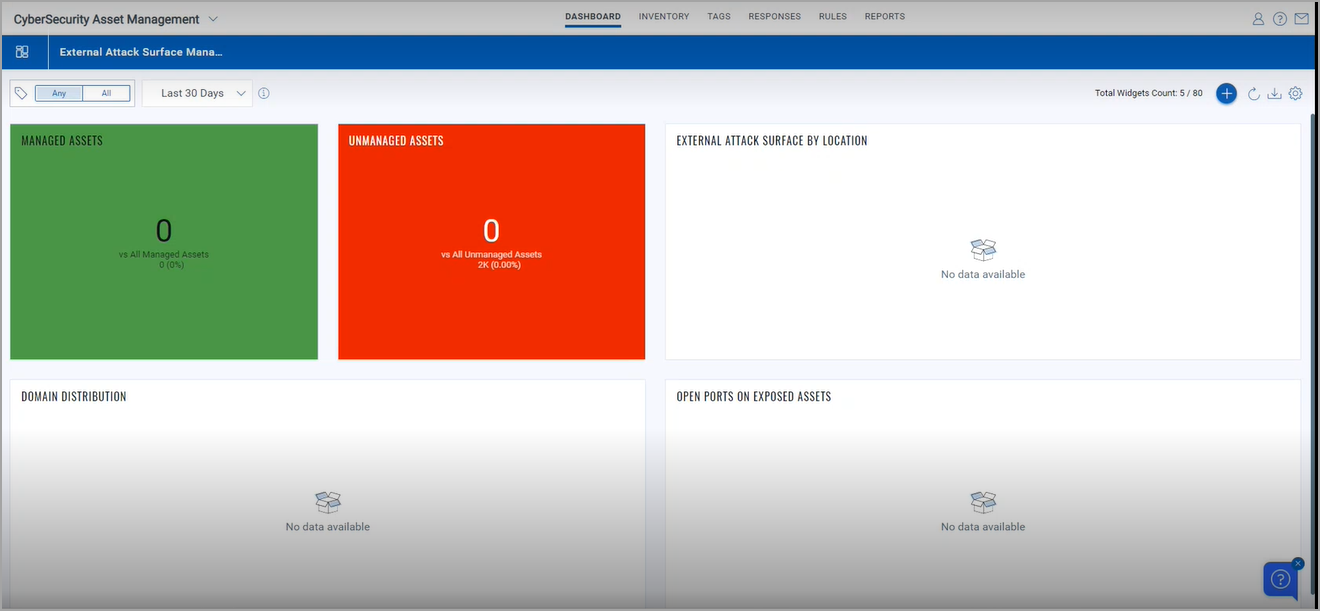
The EASM dashboard is shown. The dashboard provides details, such as the MANAGED ASSETS and UNMANAGED ASSETS that are discovered, DOMAIN DISTRIBUTION, and OPEN PORTS ON EXPOSED ASSETS. You can modify the filters and module widgets.
1) Go to Dashboard, click on the Settings icon and then click Create New Dashboard.

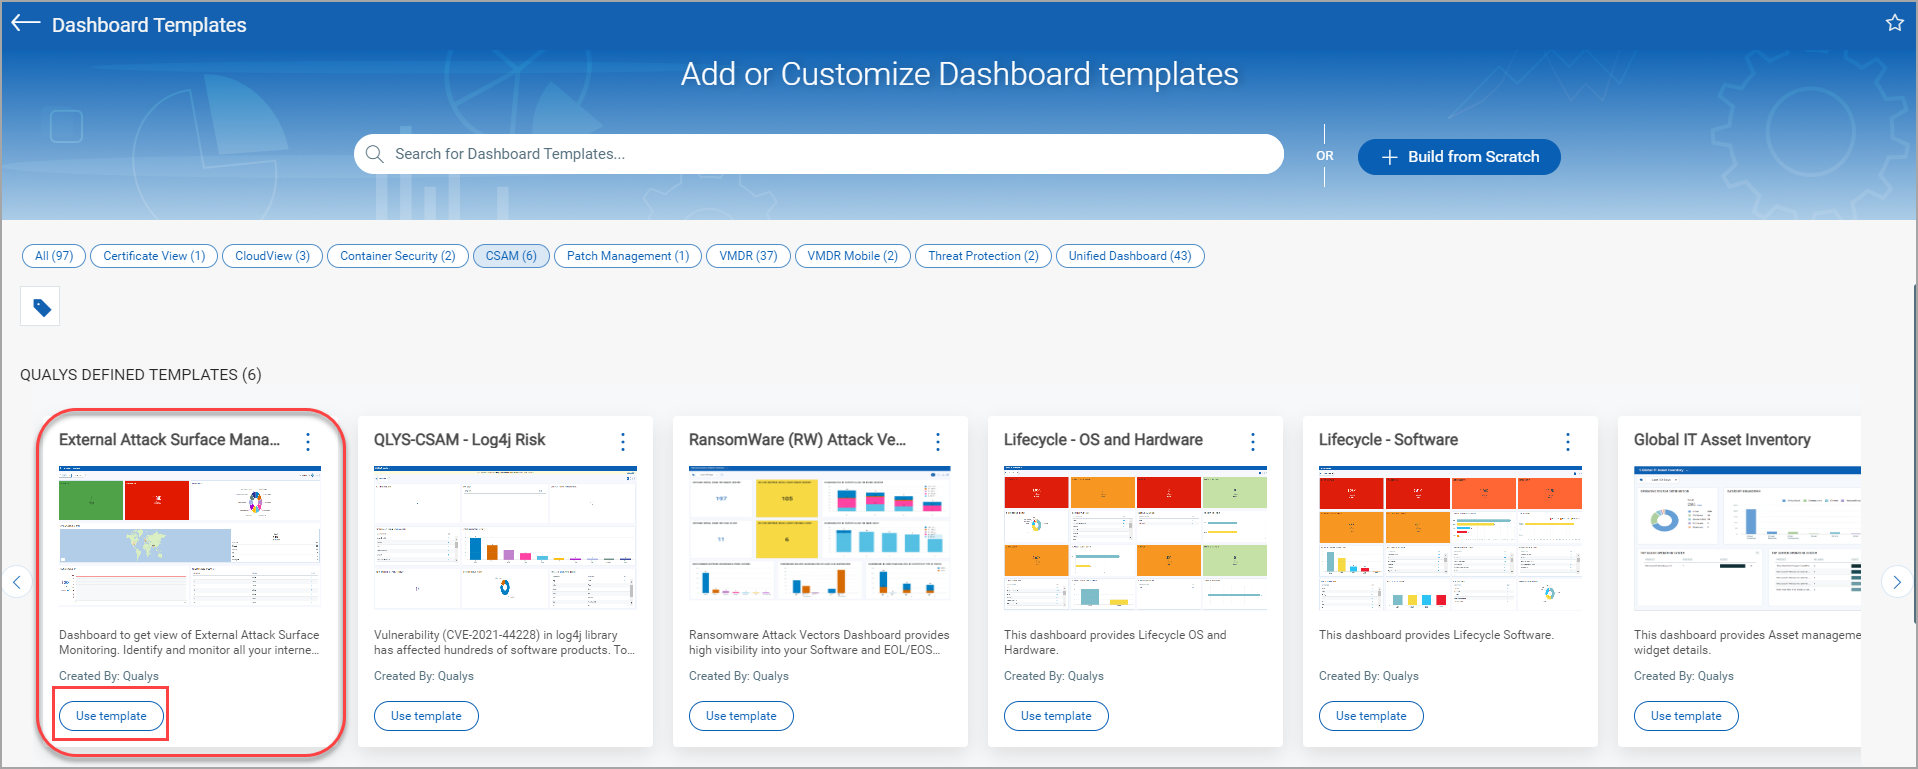
2) Choose CSAM as the dashboard template, and click Use template from the highlighted template.

You can now view the EASM dashboard, where you can see the Managed and Unmanaged EASM discovered assets details.
