View Assets in CSAM
The Inventory > Assets tab gives you asset information, such as identity, running services, installed software, open ports, users, and more. CyberSecurity Asset Management gives you deep visibility into your assets granting you a detailed, multidimensional view of each one that encompasses both its IT and security data. You can flag issues such as configuration problems, security risks, IT policy violations and regulatory non-compliance with an asset profile that includes a wealth of data.
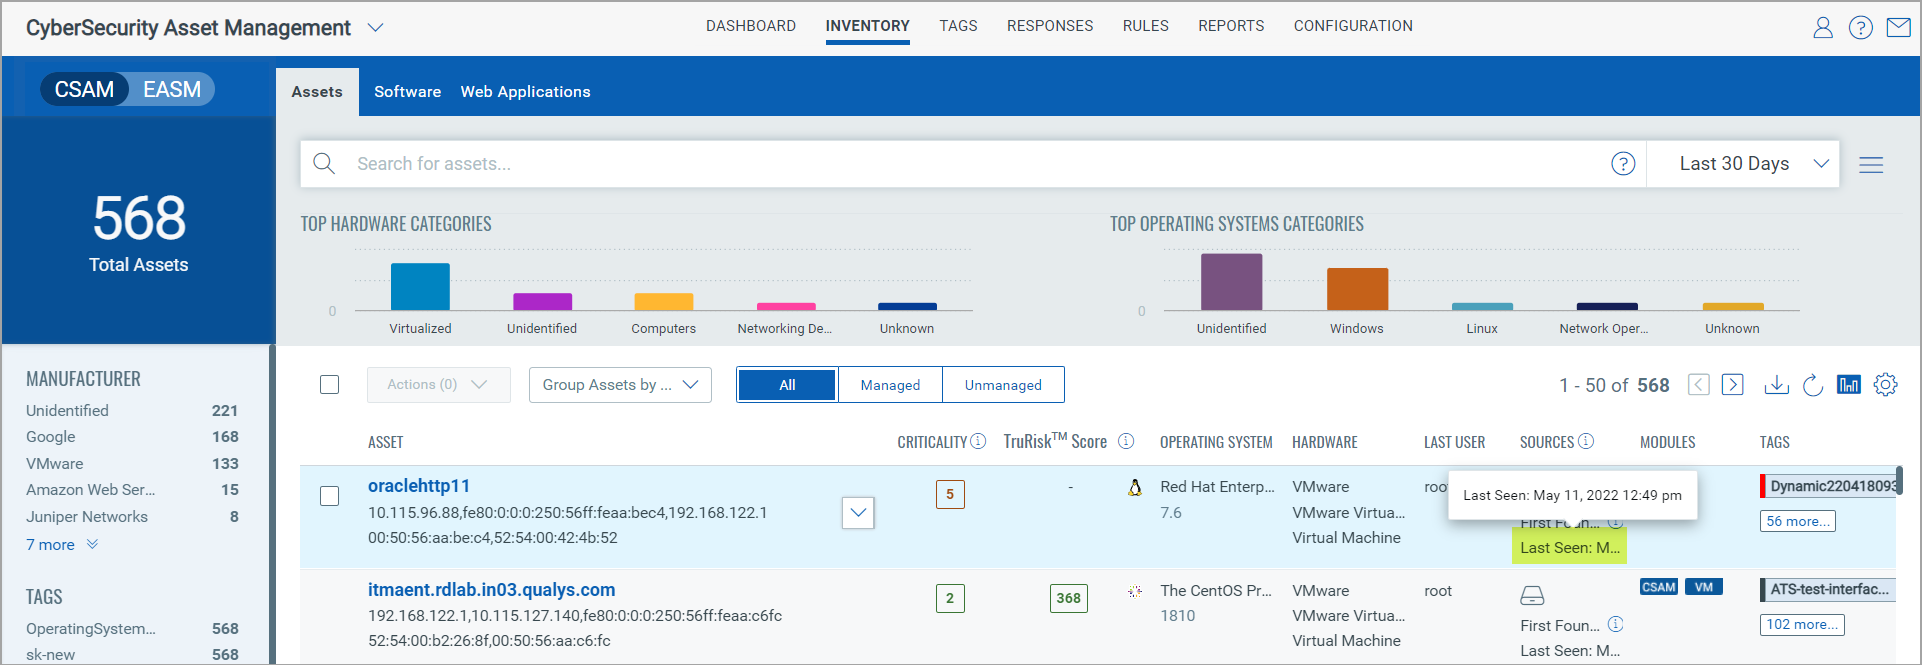
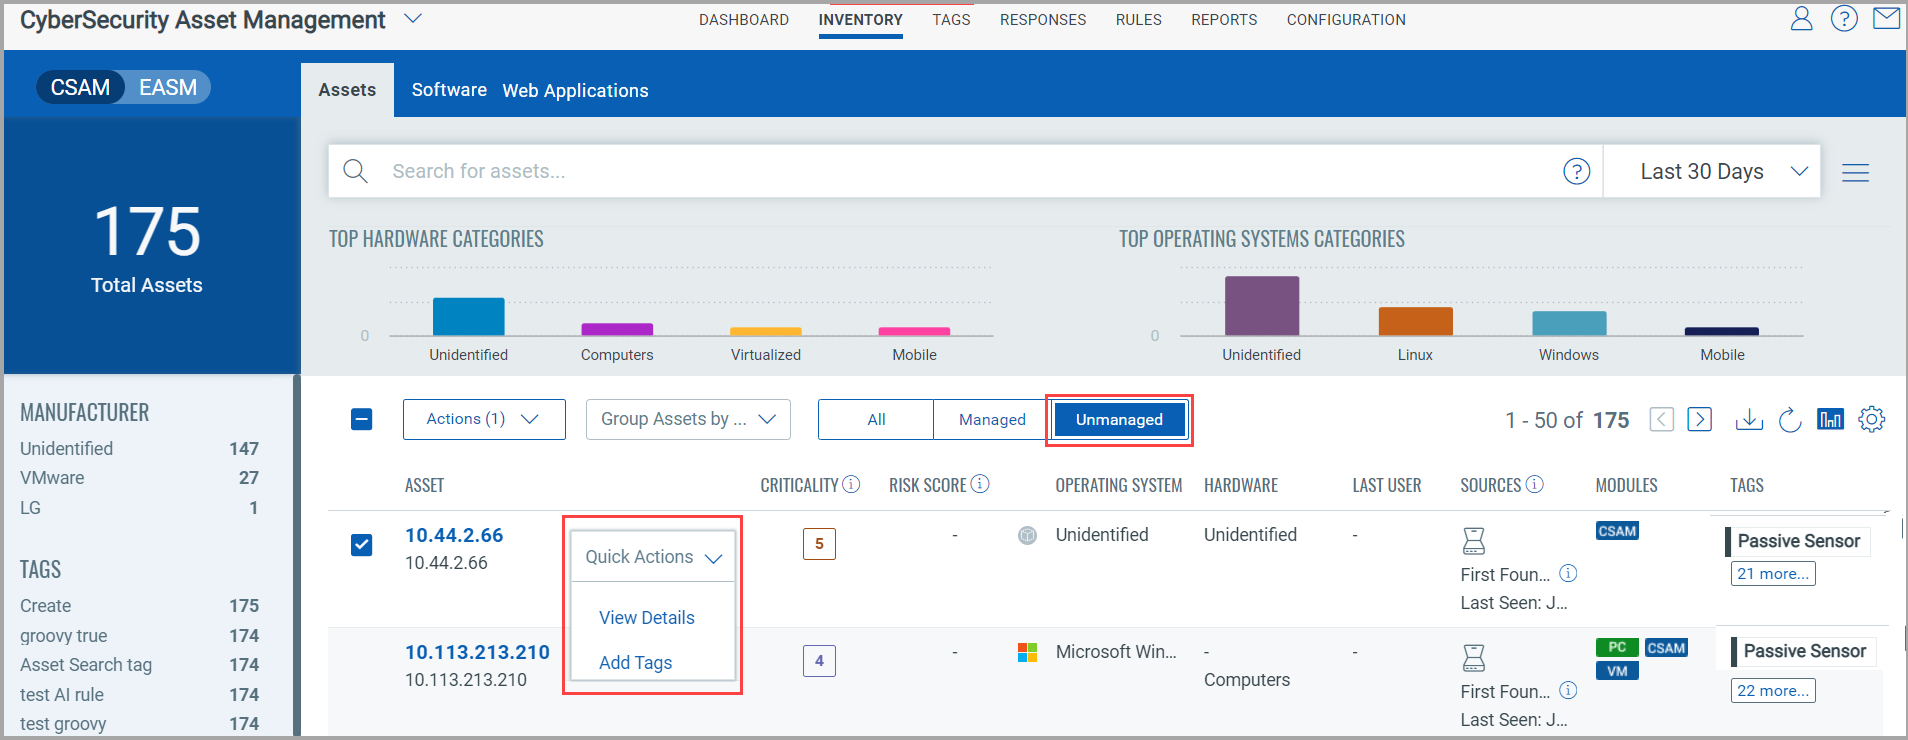
Assets tab gives you an overview of assets in your organization.

(1) Search for assets using a Qualys Query Language (QQL) query for a specific timeframe. For more information, see Qualys Query Language.
Note: For all the date-related tokens, the date search is evaluated only for UTC format. The actual search results might show you the date as per your time zone.
(2) View bar charts for the top hardware and operating system categories. Click a specific bar from the chart to view the list of assets. For more information on the categories, see the Usage Guides - Hardware and Operating System in the Appendix.
(3) View the total assets matching your search criteria and the asset manufacturer and asset tags with their count of assets from the left pane. Click count of assets to view the list of assets.
(4) View assets details, add static tag, and purge asset for the asset from the Quick Actions menu. In a single operation, you can add tags to a maximum of 100 assets. If you select more than 100 assets, 'Add Tags' action will be disabled. You can not purge GCP assets using the on-demand method (from Inventory > Assets) tab.
(5) View asset criticality score for the assets. For more information, see Asset Criticality Score.
(6) TruRisk Score of the asset. For more information, see TruRisk Score.
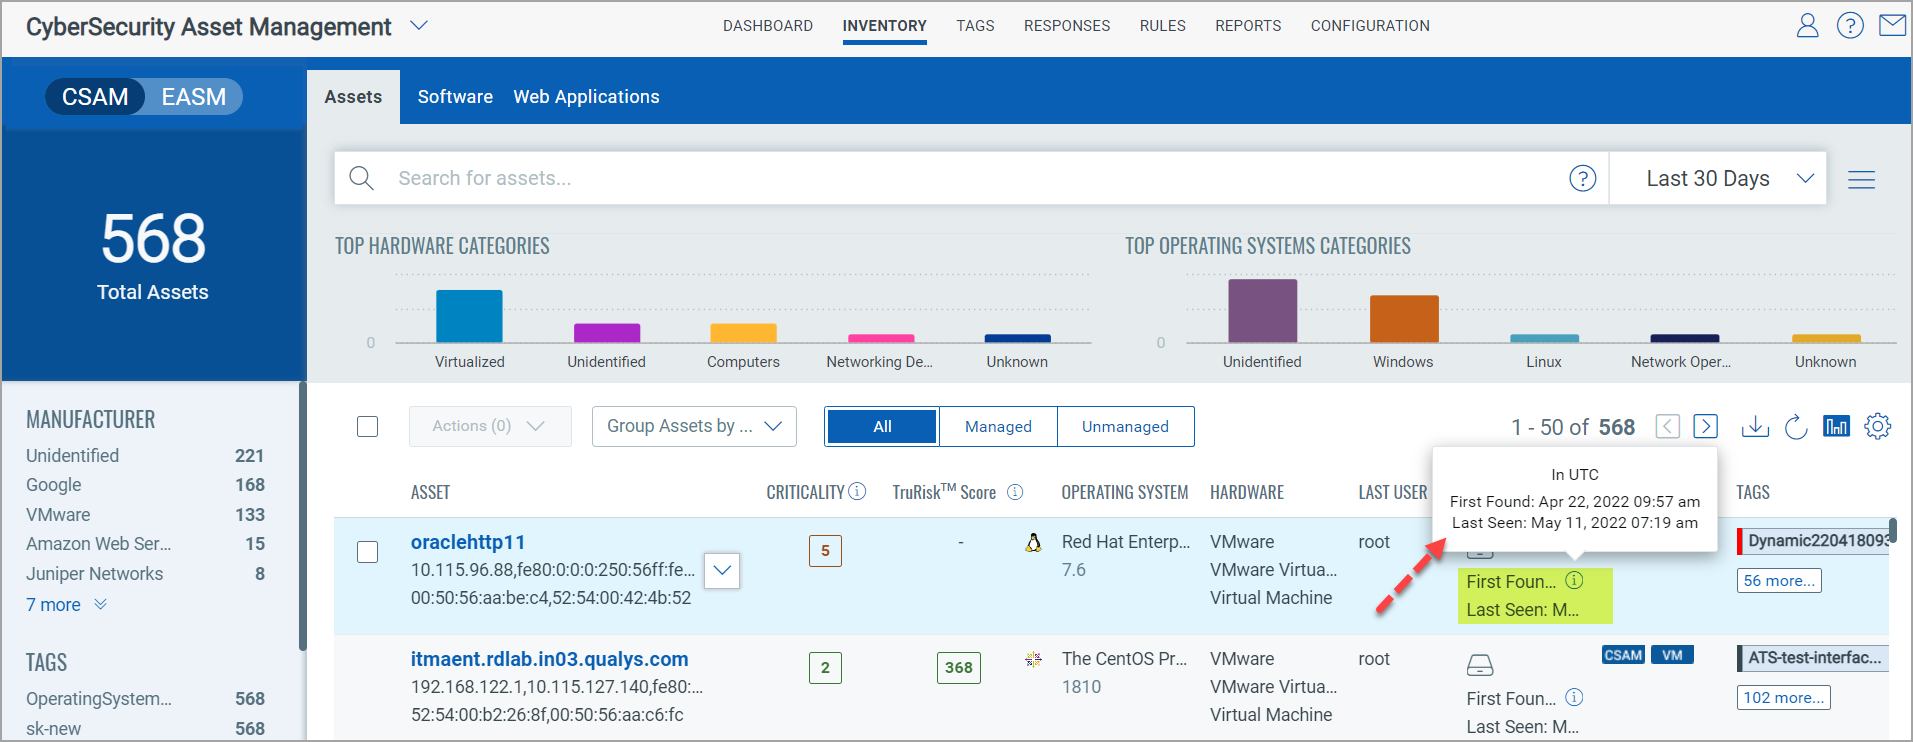
(7) Shows different sources from where the asset was collected. For a particular source, you can hover on the icon to see the first found and last seen date. Aggregate first found and last seen dates for all sources are displayed under the list of icons in the local timezone. We also display the aggregate UTC time of first found and last seen dates for all assets on hovering over the (i) icon. Refer the screenshots below.

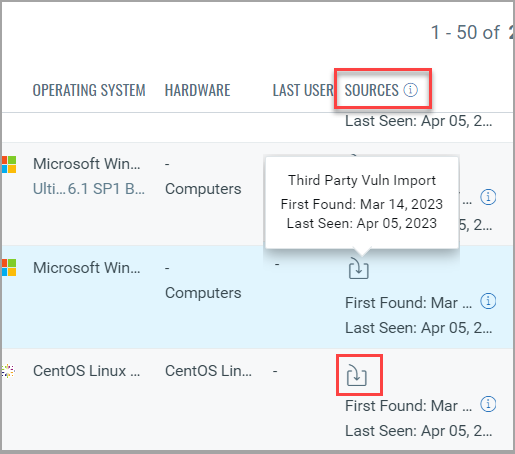
Note: As shown in the following screen capture, you can see a specific icon, Third Party Vuln Import, for the third-party vuln imported asset in the Sources column. When you hover over that icon, you can see the first found and last seen details of that asset in the tooltip.
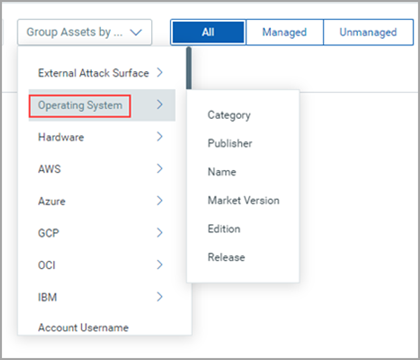
(8) Group assets based on criteria or categories, such as External Attack Surface, Operating System, Hardware, AWS, and so on. As shown in the following example, for some of the categories, further subcategories are also available.
(9) You can activate passive sensor unmanaged assets by clicking the "Activate" option under the Quick Actions menu. You can add IPs of passive sensor unmanaged assets to be scanned by Policy Compliance (PC) or Vulnerability Management (VM) module, or both, by clicking the "Activate" option under the Quick Actions menu.

Note:
- Assets that are tagged with ICS_OCA tag are sensitive in nature, for example, OT assets such as PLCs. Actively scanning such sensitive assets might potentially bring them down. So, the "Activate" option is not visible for all such assets.
- Assets that are sensitive in nature can also be reported by passive sensors deployed in OT networks. The "Activate" option is not visible for such assets as well.
For assets to download the Assets list where a particular asset is installed. Click the Download Icon on the asset details page as highlighted in the screenshot below.
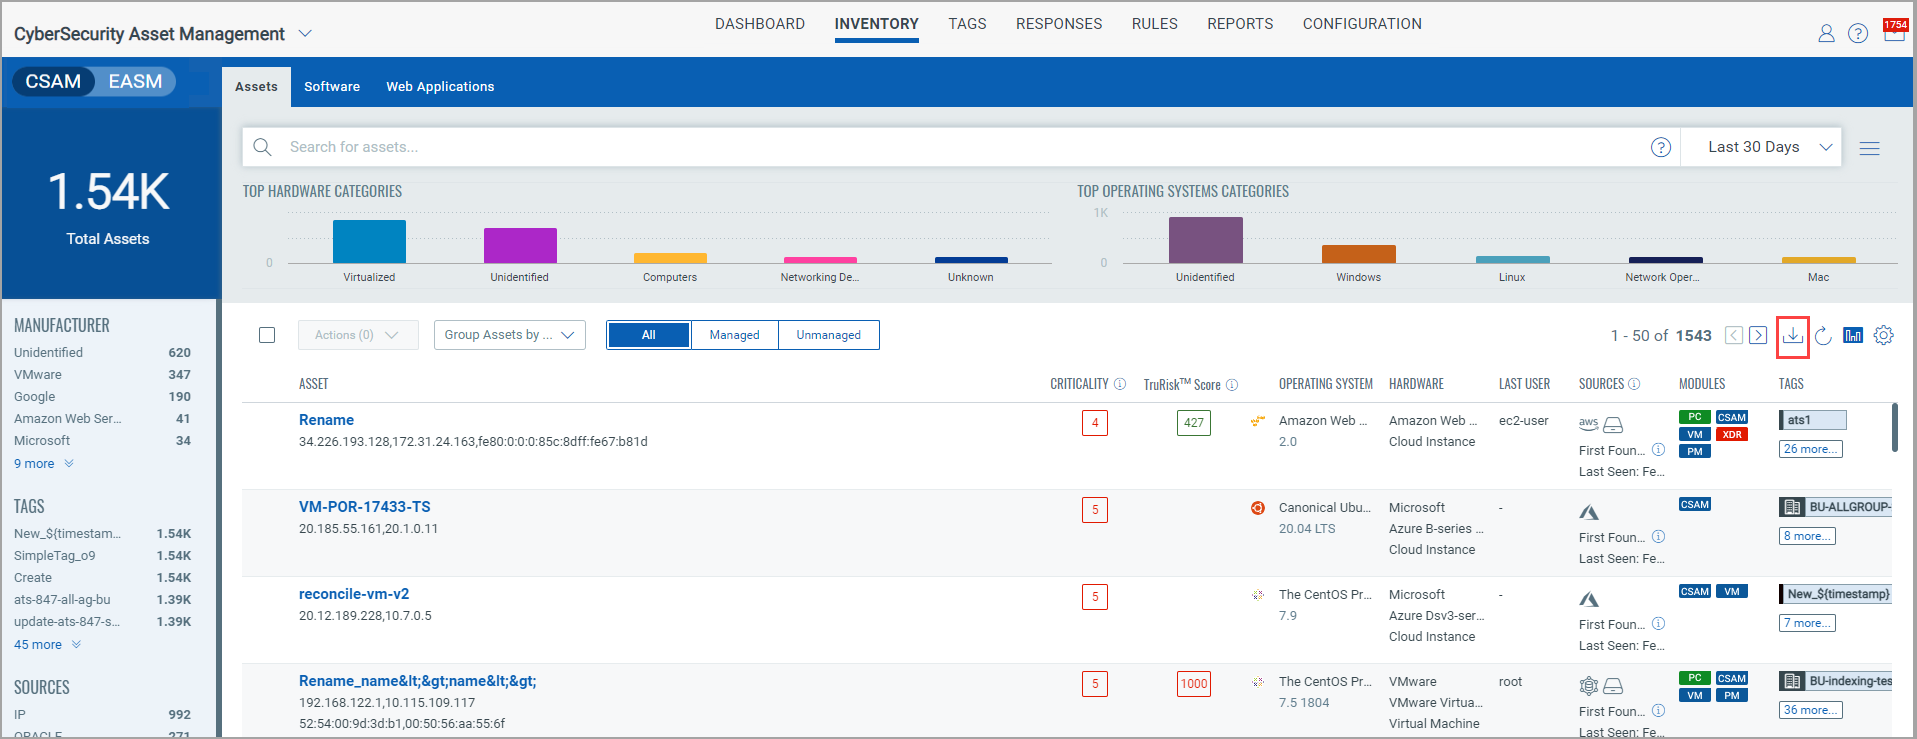
Select the timezone from the drop-down list to use it in the report for the dates. Choose available download formats (CSV, HTML, XML), and click Download.

Asset Details
This section gives you a detailed and consolidated view of an asset with information on asset inventory, security posture, compliance posture, and sensor information to all interfaces for the assets. This detailed information includes IT and security data. This helps the user to understand the security risks, policy and compliance violations, IT data such as licenses, end-of-life dates, and network connections. Users can flag issues or any such problems.
To view asset details, navigate to Inventory > Assets and then click View Details under the Quick Actions menu for an asset. You are navigated to the Asset Summary tab of that asset.
Expand the following sections to view more information:
Asset Inventory gives you deep visibility into the assets, granting you a detailed, multidimensional view of each one that encompasses its IT data such as:
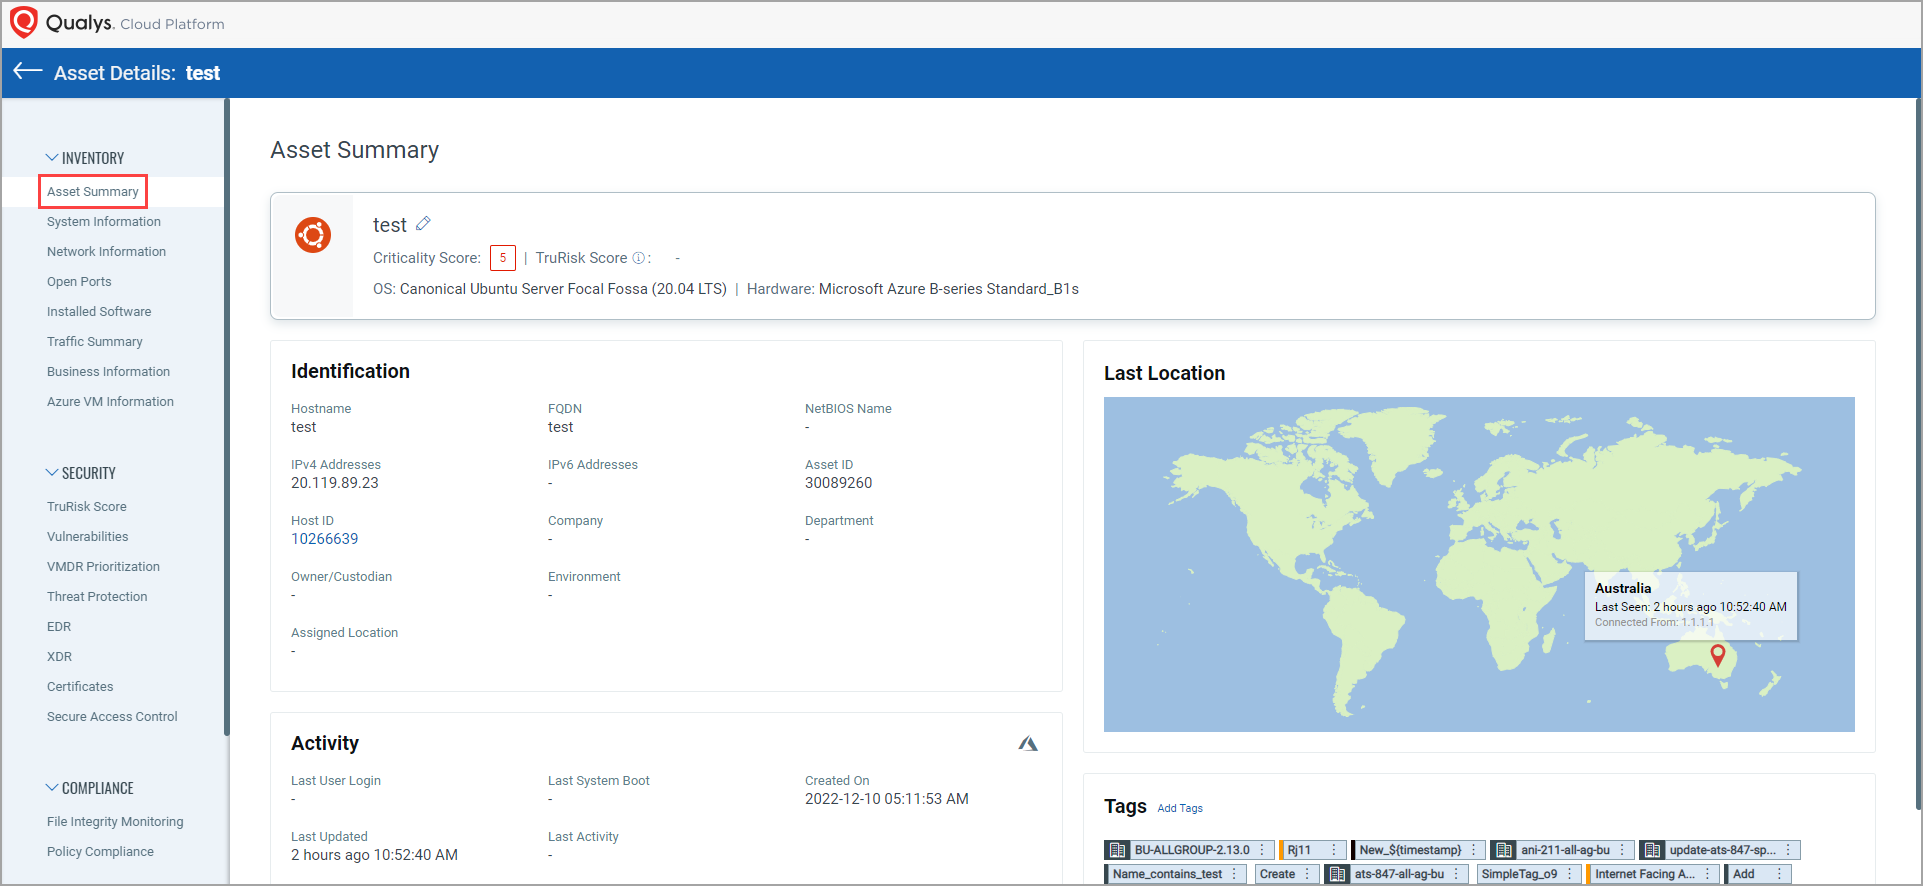
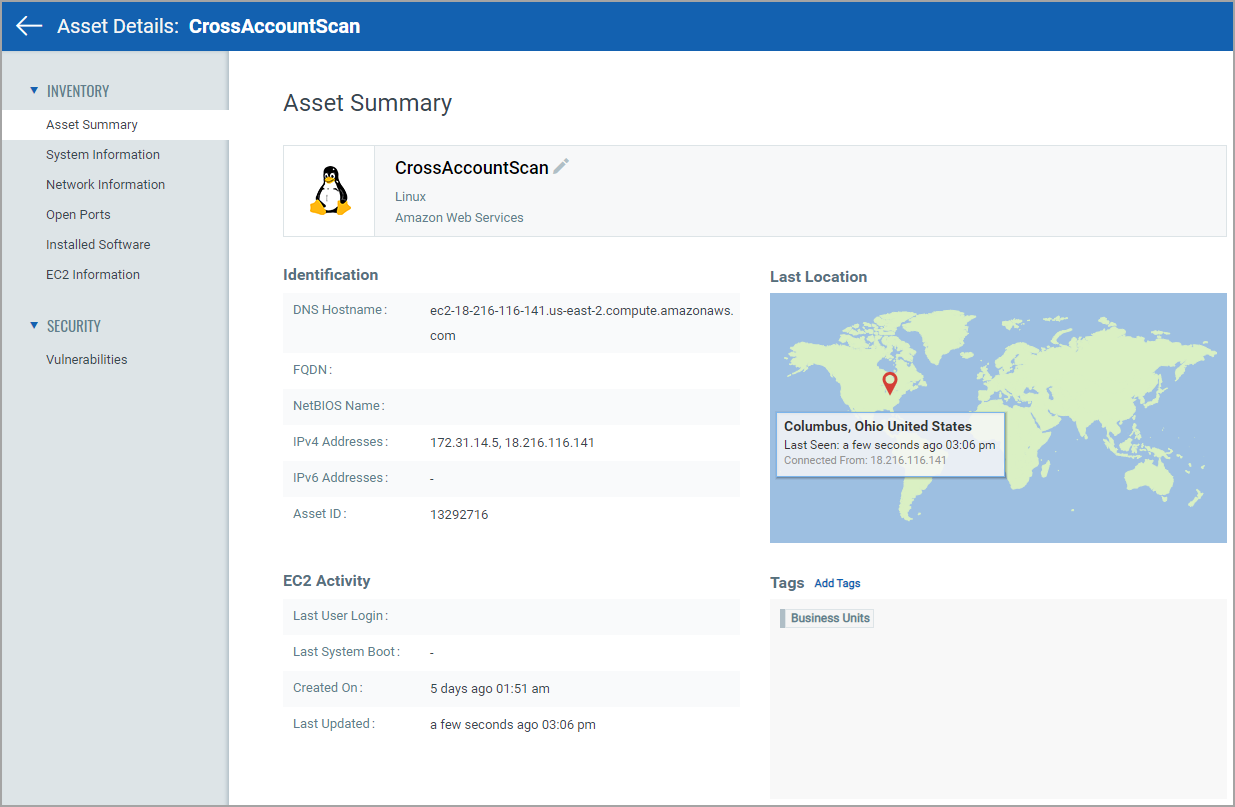
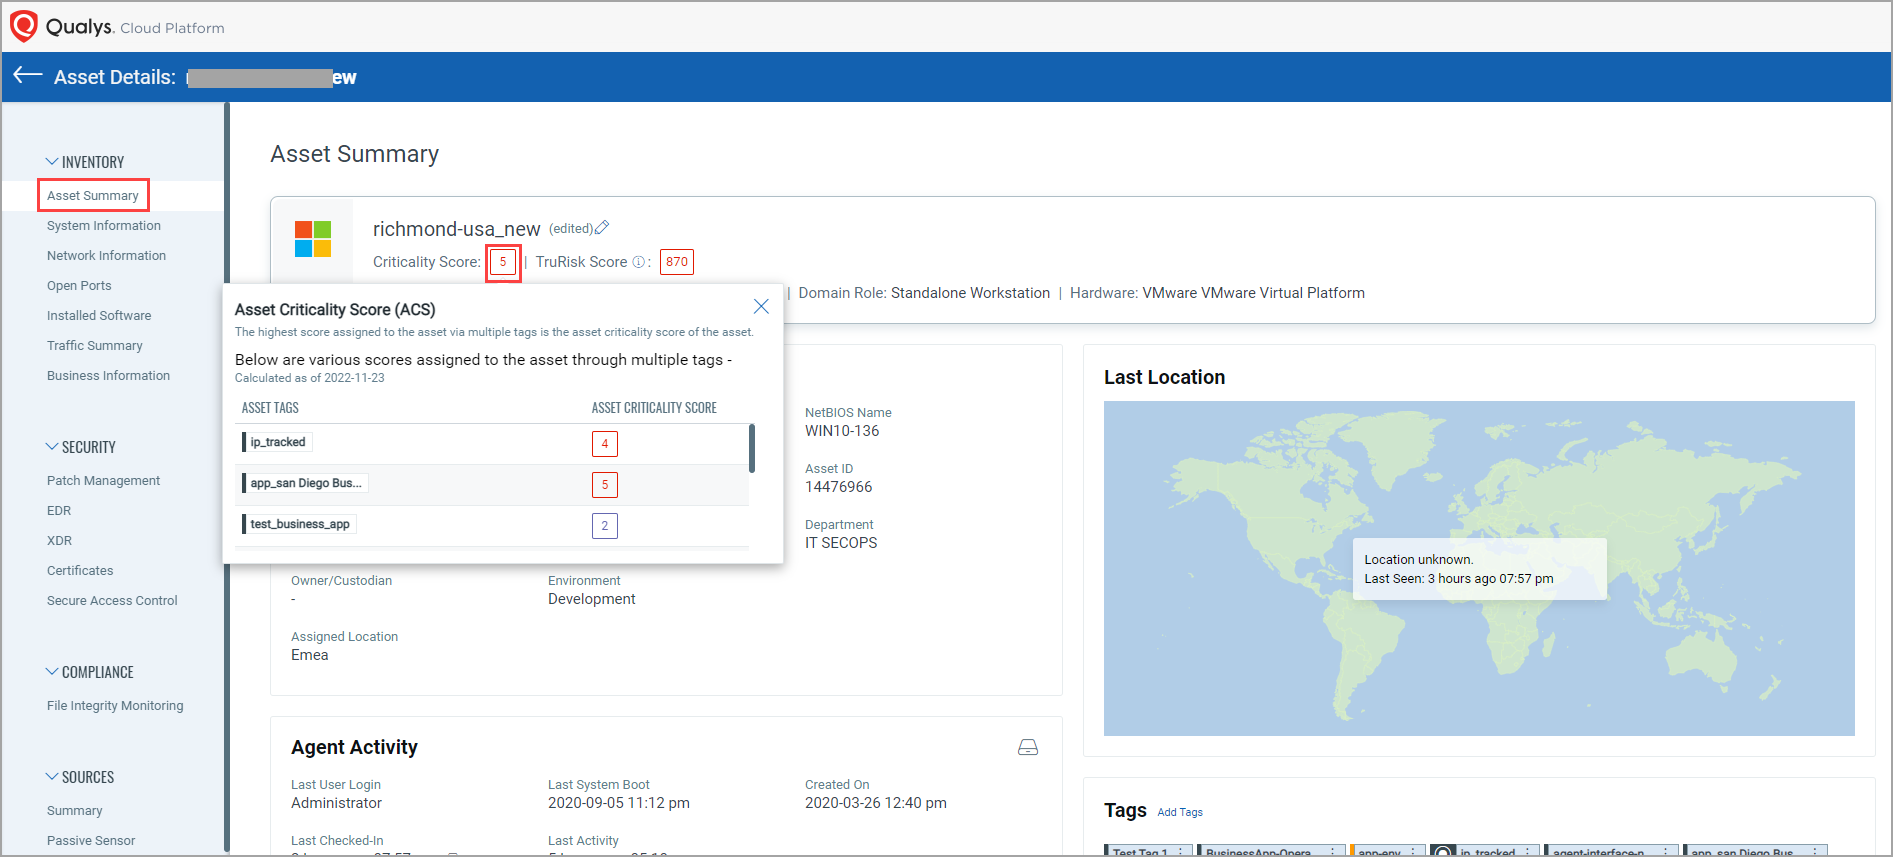
- Asset Summary: Gives you detailed information to identify the asset, activity on that asset, the last location from where the asset was accessed, and different tags assigned to the asset. You can also add a tag to the asset from this page.
You can see details, such as Criticality Score, TruRisk Score, EC2 Activity, Identification information, tags assigned to that asset, and so on.
Note:
- From the tags section, by clicking Add Tags, you can add static and dynamic tags to that asset. Also, by clicking Remove Tag, you can remove the static tag that is assigned to that asset. Note that you cannot remove dynamic and system-defined tags assigned to that asset. The Remove Tag option is shown only for static tags.
- You can also edit and view static and dynamic tags from the Tags section.

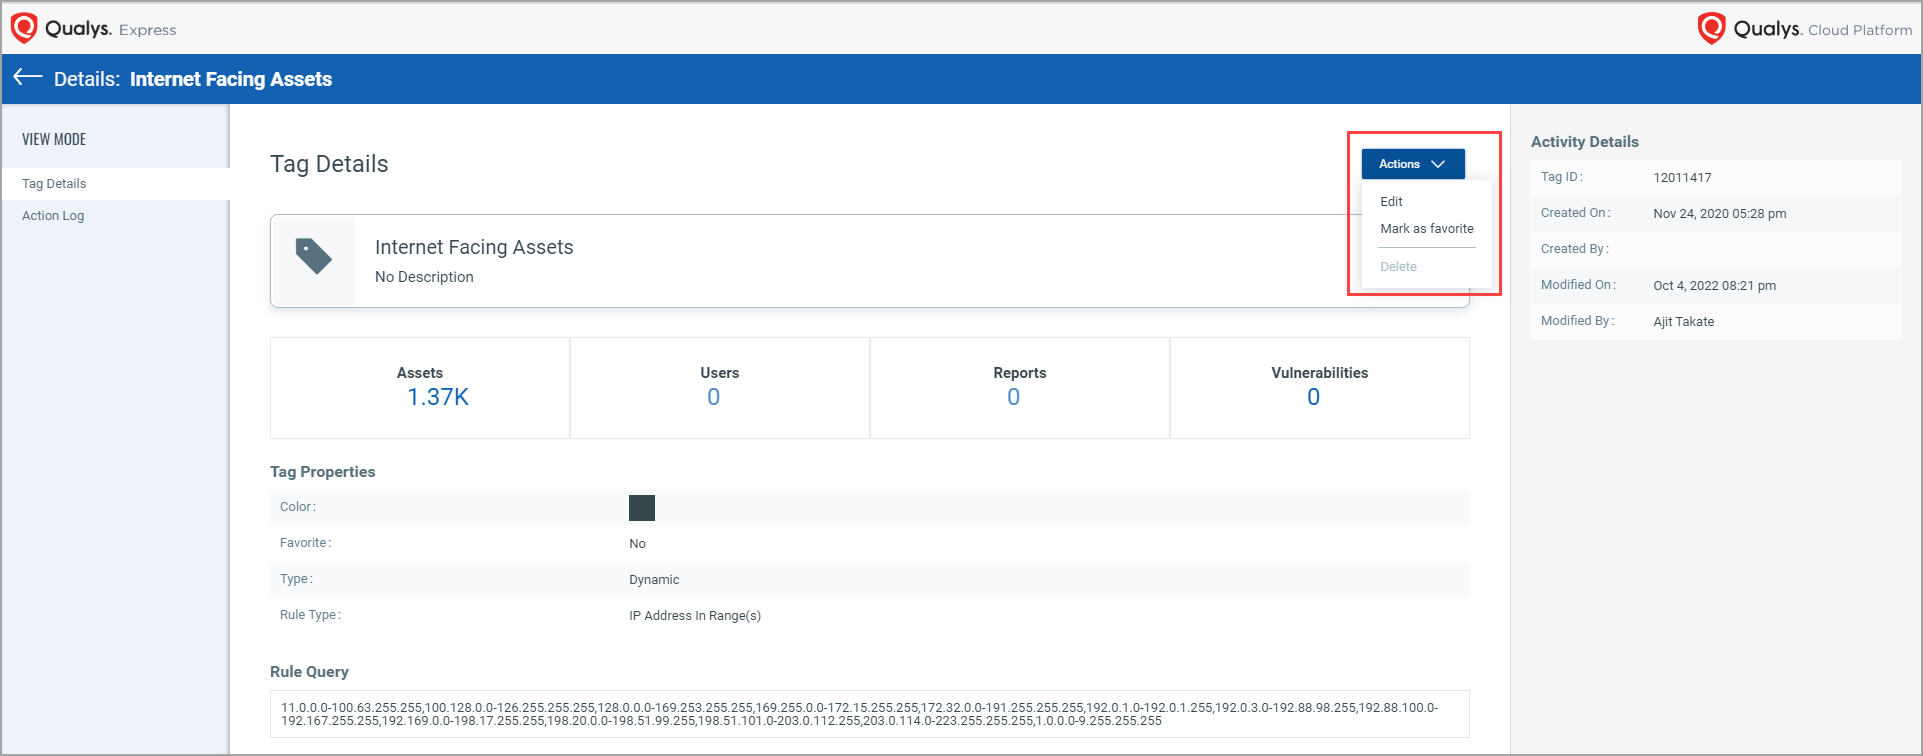
When you click View to see the tag details, a new "Tag Details" page opens, wherein you can see the tag details.
Note: When you click ctrl +View, the “Tag Details” page opens in the next tab.
You can also edit or mark the tag as a favorite by clicking Actions from the Details page.
For Alibaba cloud instances, you can see Cloud Agent and ALIBABA icons in the Agent Activity section from the Asset Summary tab.
![]()
- System Information: Gives you system information such as hardware specifications (detailed information for operating system, hardware, volumes, processors, etc.), services, and users. For all assets, except the ICS_OCA tagged assets, you can submit your feedback by clicking ‘Give Feedback’. For more information about ICS_OCA tag, see Manage Asset Tags.
There is confidence associated with Hardware and OS reported for unmanaged assets sensed by PS as the PS fingerprints the asset based on the metadata it sees from the traffic copy fed to the NPS appliance and does not actively query the asset. The operating system confidence and hardware confidence details are shown on the “System Information” page of the asset details in the "Operating System" and "Hardware" tiles.

Users with a Trial or a Paid subscription can now add “Custom Attributes” for an asset. The custom attributes you add for assets enable you to filter your assets.
Note: As this feature is available only for users with a Trial or Paid subscription, the following message is shown for users with a free account.

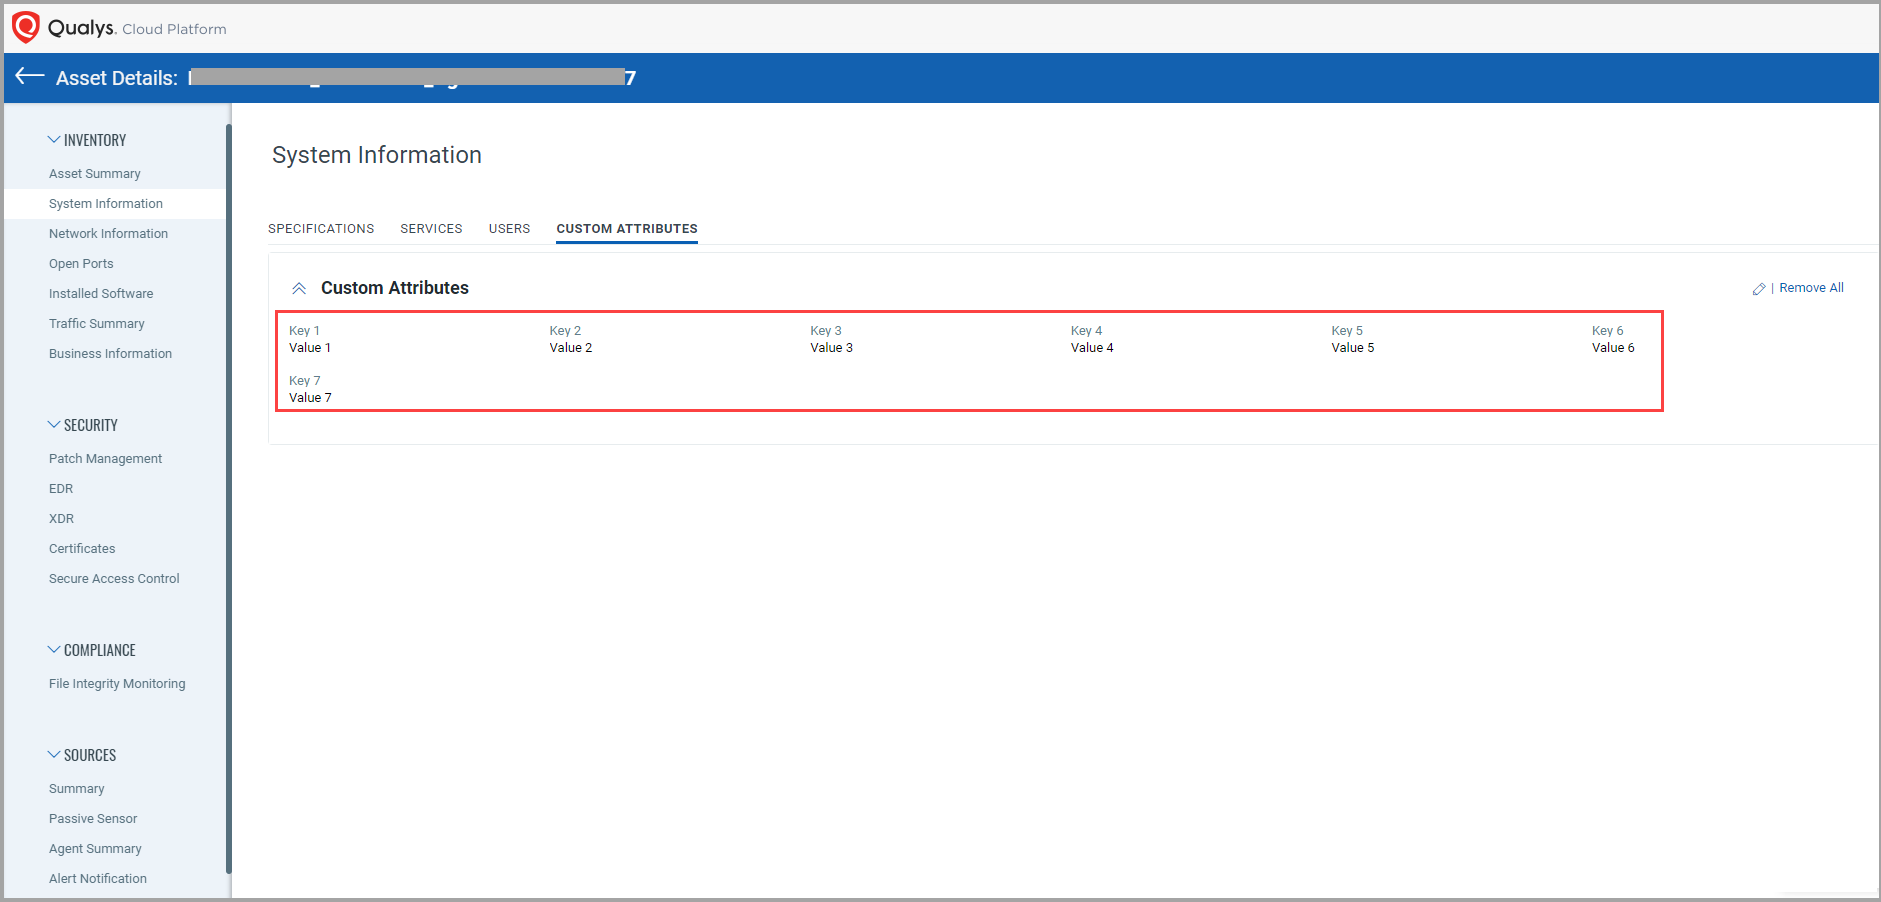
When you click the System Information tab from the Inventory section from the left pane of the Asset Details page, you can see the new CUSTOM ATTRIBUTES tab.
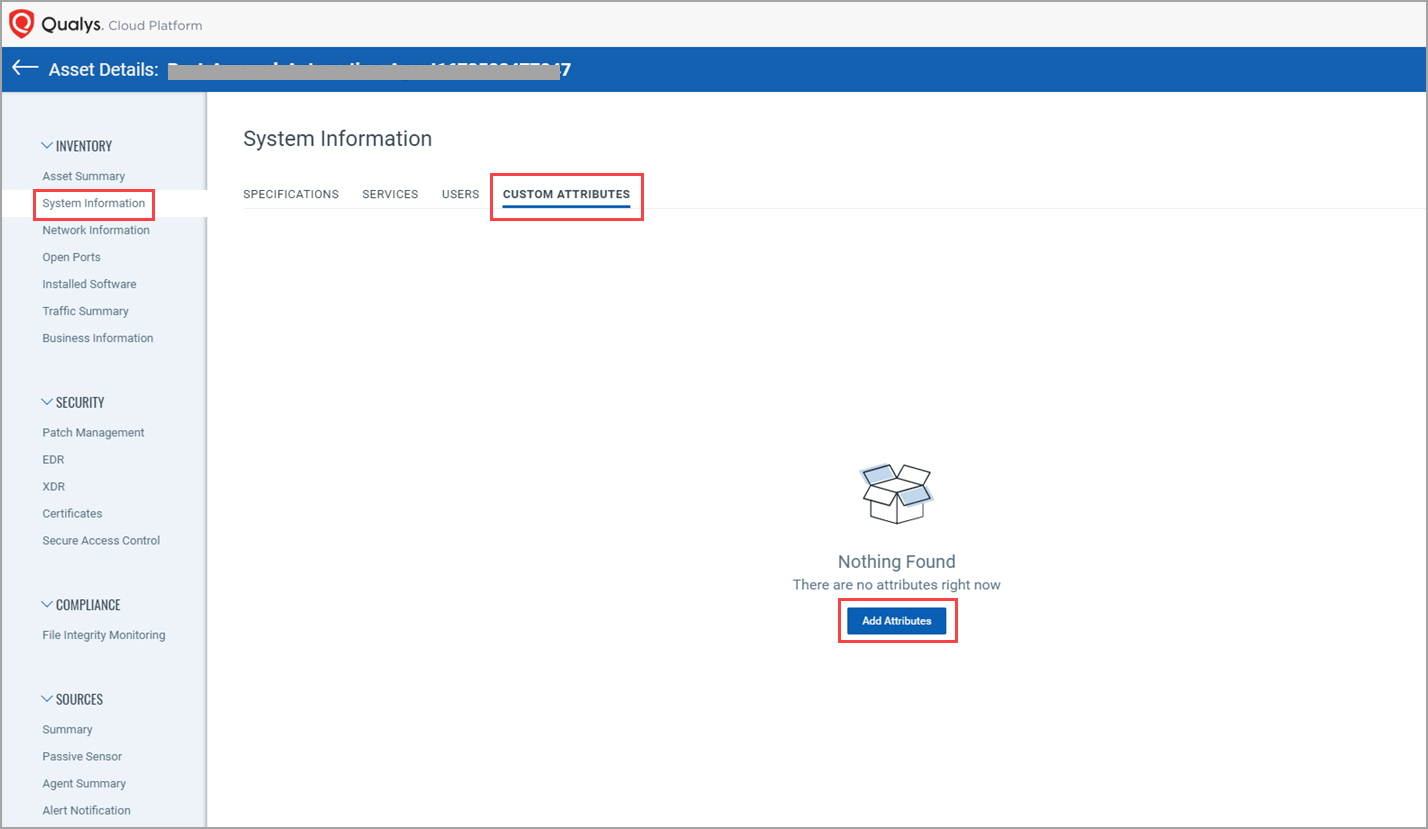
By Clicking Add Attributes, you can add custom attributes for that asset. The maximum number of custom attributes you can define for an asset is 20.
You need to specify a Key and a Value for a custom attribute.
- Network Information: Gives you information for the network connection to the asset.
- Open Ports: Gives you a list of open ports and services running on those ports.
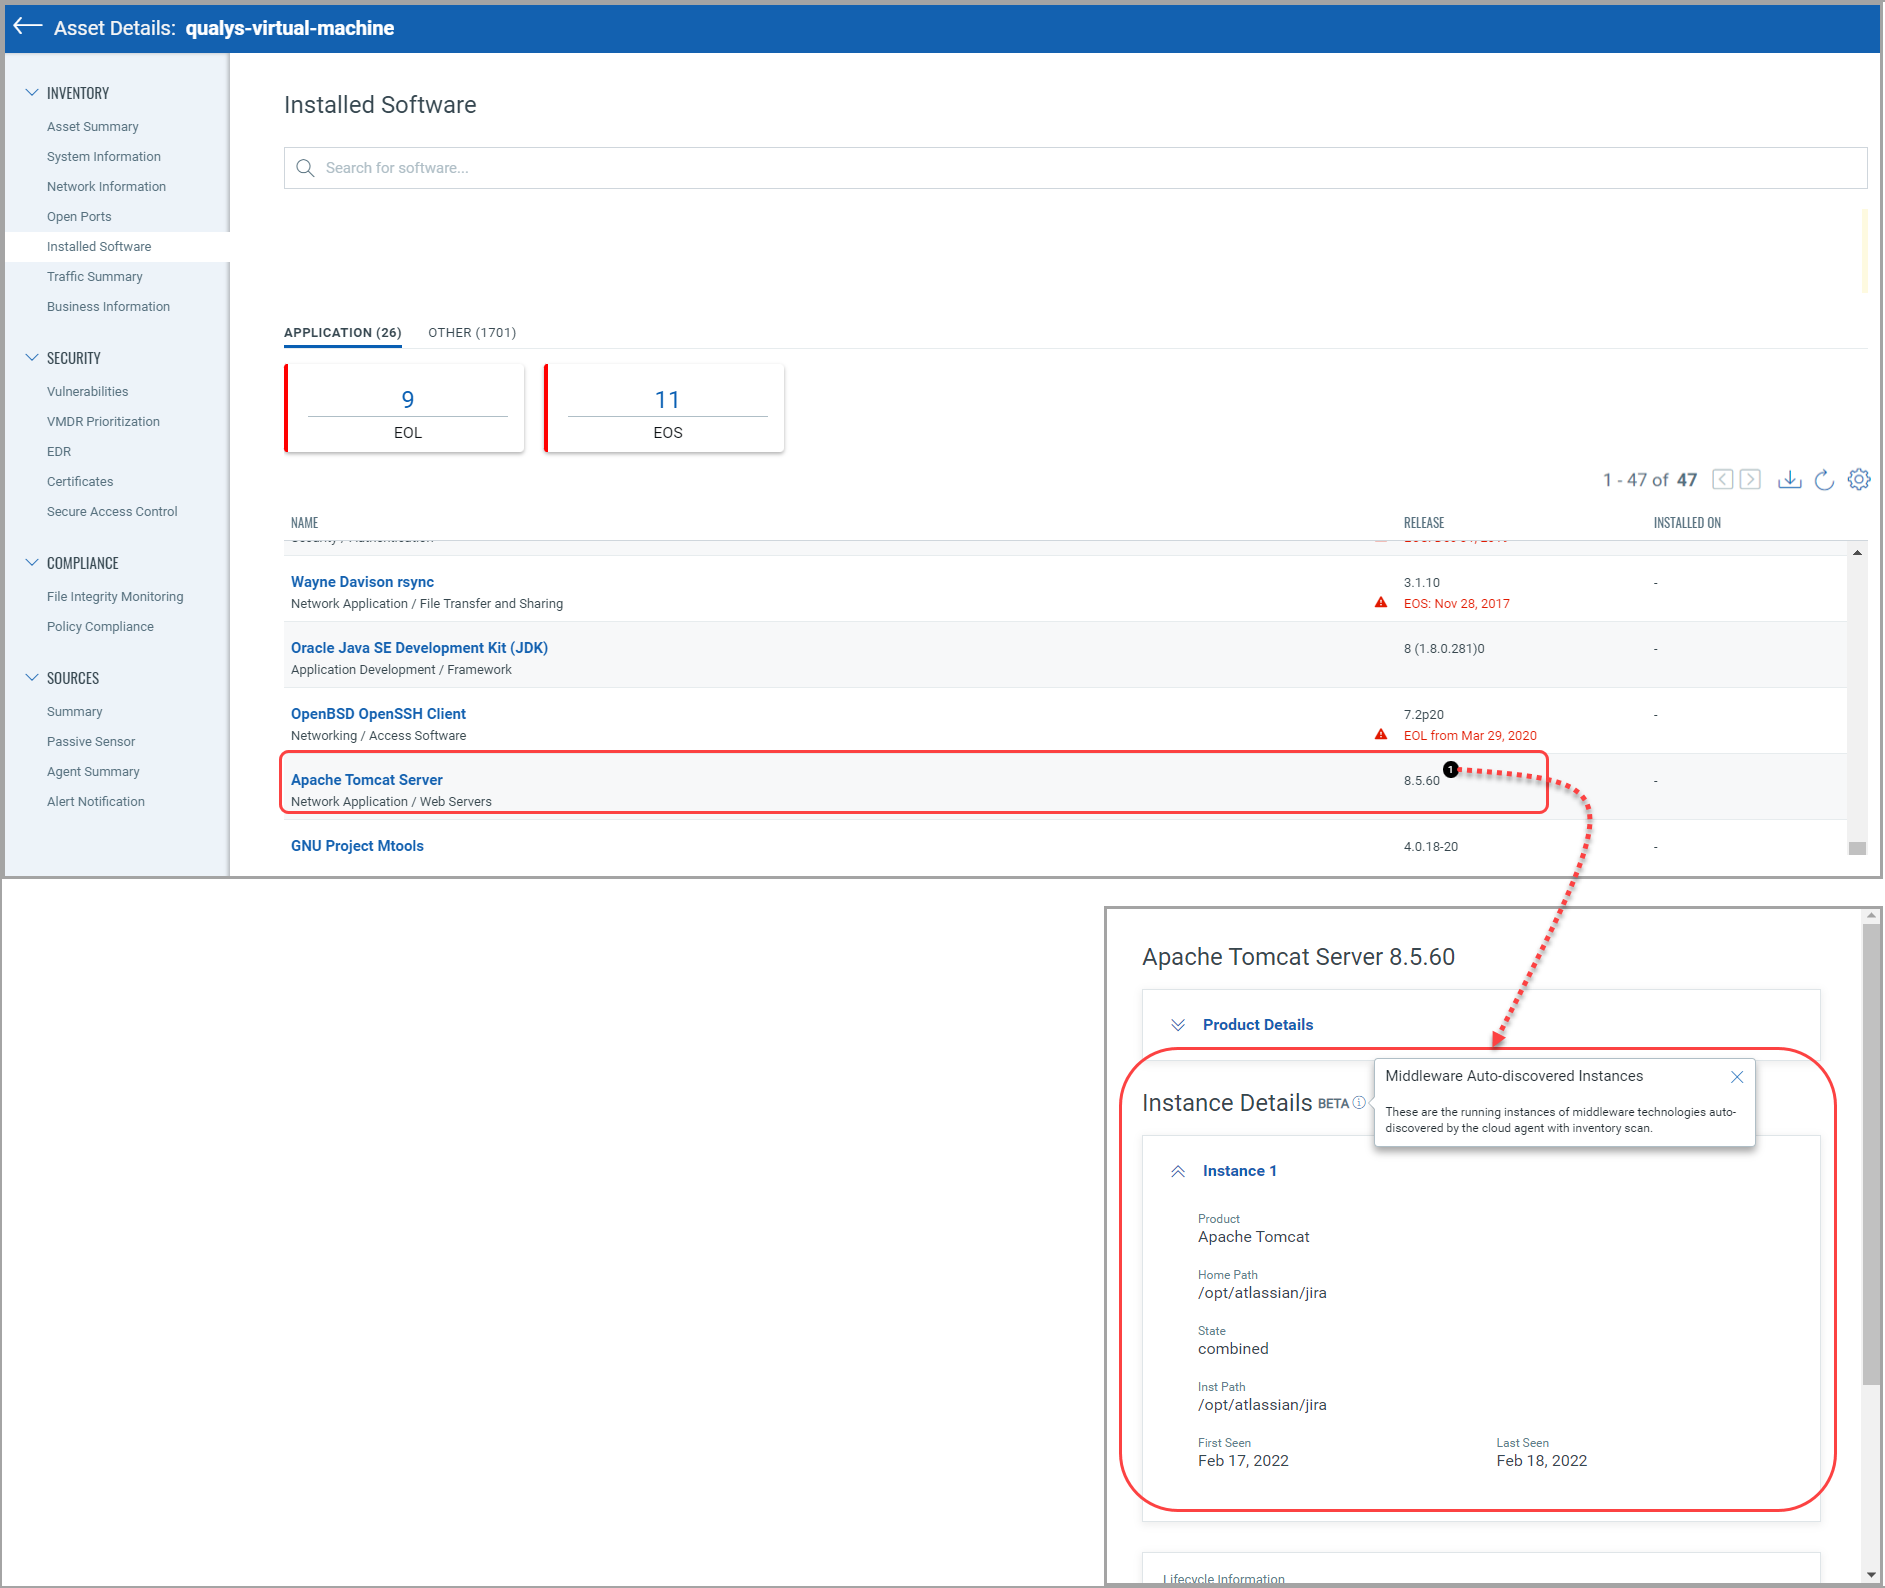
- Installed Software: Gives you a list of software installed on the asset. This helps you identify the software version, end of license date, etc. You can see the running instances of middleware technologies auto-discovered by the cloud agent (only Windows and Linux platforms) with an inventory scan. Refer to the article, which lists the middleware technologies that are auto-discovered by Cloud Agents.
You can also download a list of software in the Application/Others category installed on the asset by clicking the download icon, as shown in the following screenshot.
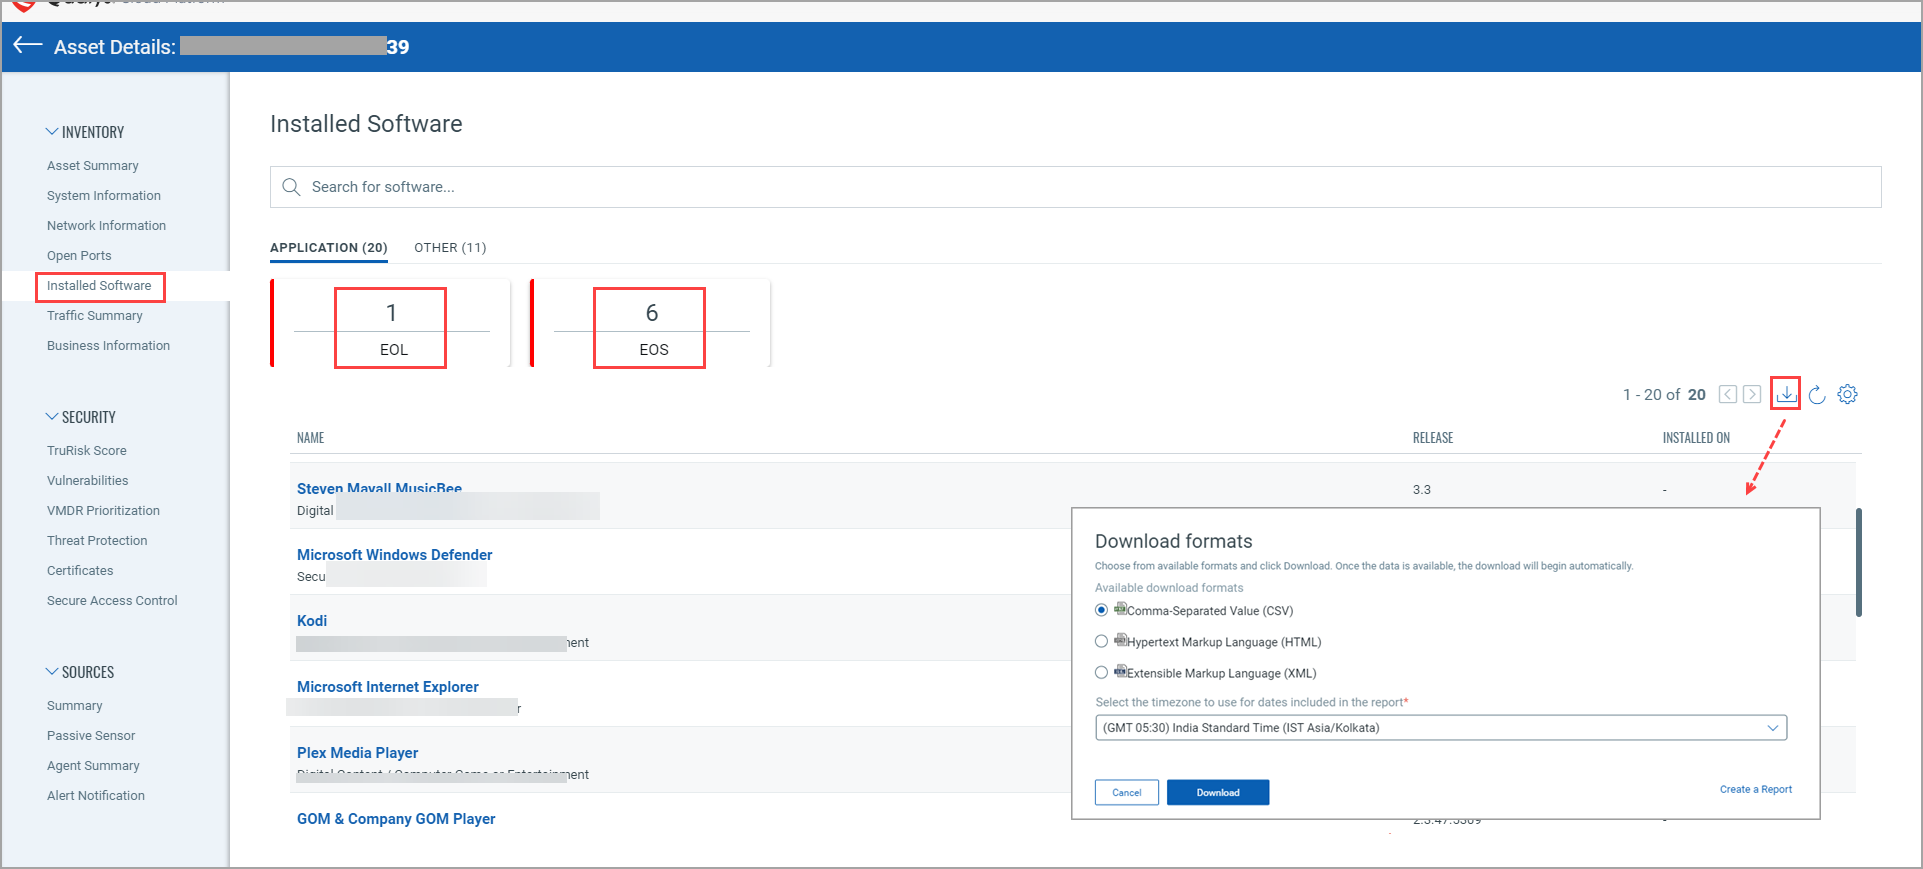
Select the timezone from the drop-down list to use it in the report for the dates and choose available download formats (CSV, HTML, XML) and click Download.
In the following example shown, for the “qualys-virtual-machine” asset, you can see “Apache Tomcat Server” middleware technology has 1 running instance.
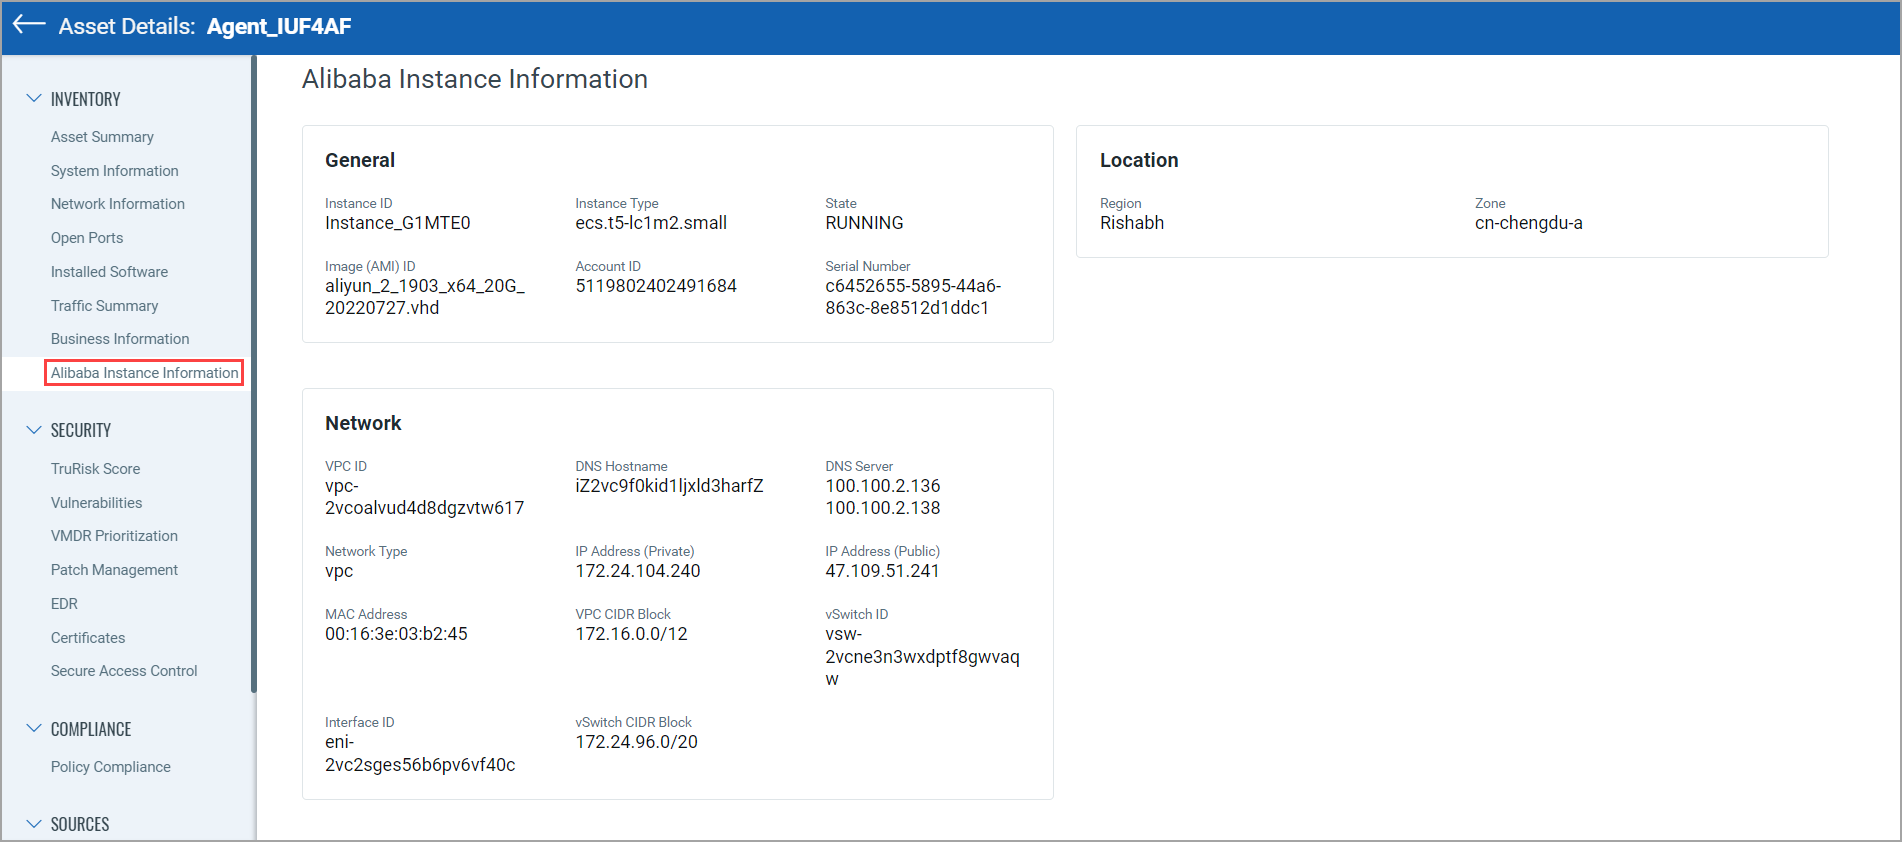
- Alibaba Instance Information: You can see Alibaba Instance Information tab in the Inventory section for Alibaba instances. You can find the details about the Alibaba instance, such as Hostname, FQDN, Host ID, and so on.
Find where your assets are located!
We’re now tracking geolocation of your assets using public IPs. Asset Geolocation is enabled by default for US based customers. For an asset that has an associated public IP, you’ll see its last location on a world map in Asset Details > Asset Summary.
How it works
- We’ll check the asset’s network interfaces for a public IP
- Asset that has an agent installed - we’ll check the IP reported by the agent
- AWS/EC2 asset - we’ll use the EC2 instance public IP
- Asset associated with a network - we will look for a public IP associated with the scanner used
If no public IP is found, we’ll show the location as unknown.
Want to enable (or disable) Asset Geolocation? Sure no problem. Just contact Qualys Support or your Qualys Account Manager and we’ll help you out.
This asset was last seen in Columbus, Ohio at 3:06 pm.
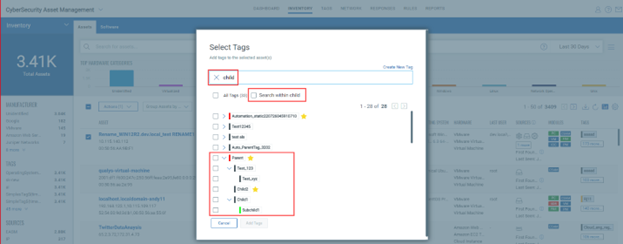
While adding tags to the selected assets from the Inventory, you can use the 'Search within child' checkbox to choose either to show the entire hierarchy of the parent and child tags or to show the parent and child tags that contain the keyword or the substring of the keyword you used to search the tags.
When you select the Search within child checkbox and search for tags by using a specific keyword, the search results display only the parent and child tags that contain that keyword or the substring of that keyword. The Search within child checkbox is selected, and “child” is the keyword that is used to search for the tags. In the following example, the Search within child checkbox is selected, and “child” is the keyword that is used to search for the tags.

When you clear the Search within child checkbox and search for tags by using a specific keyword, the search result displays all the parent and the entire hierarchy of child tags, irrespective of whether the child tags contain the keyword or the substring of the keyword that you specified.
In the following example, wherein the “child” is the keyword that is used to search for the tags.
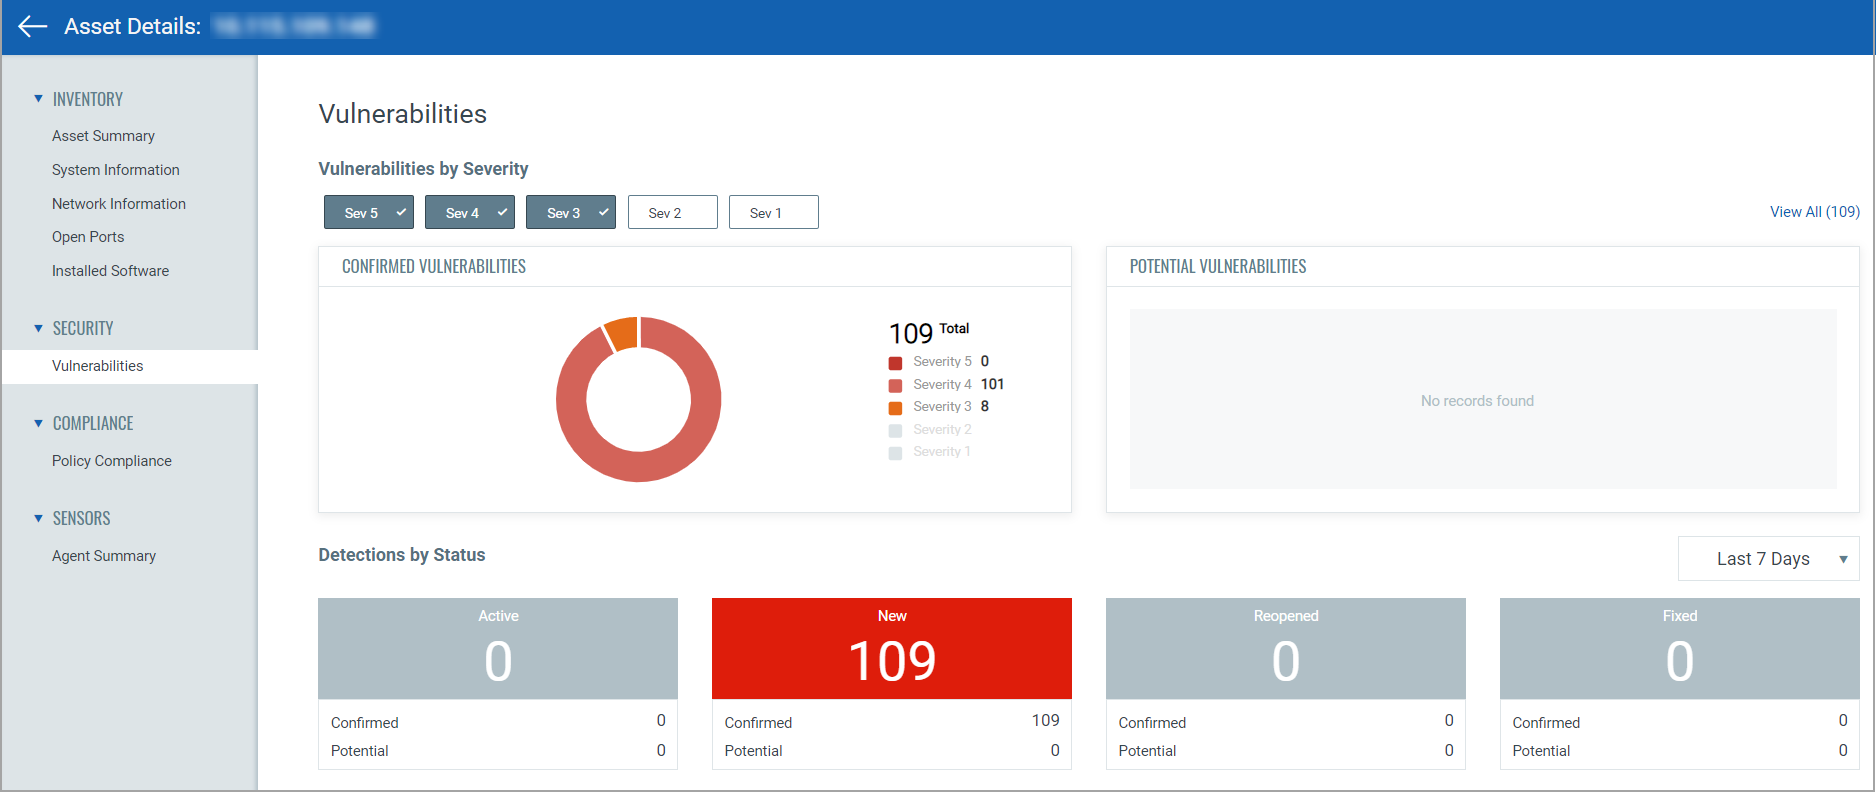
This section lists security posture for the asset. It gives summarized view for potential and confirmed vulnerabilities on the asset. You can view vulnerability details, apply patches and monitor possible malware.
This section shows compliance posture by a policy or all policies in your subscription.

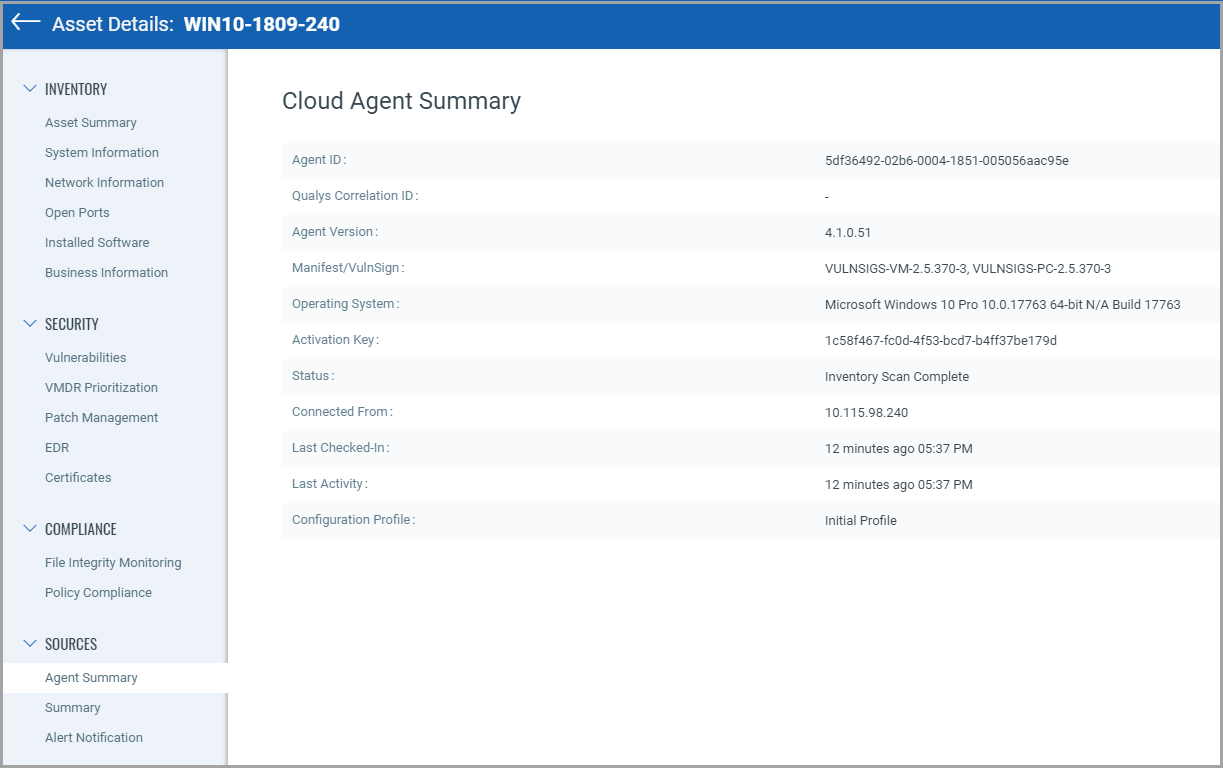
Agent Summary gives information of the agent from where the asset is collected.
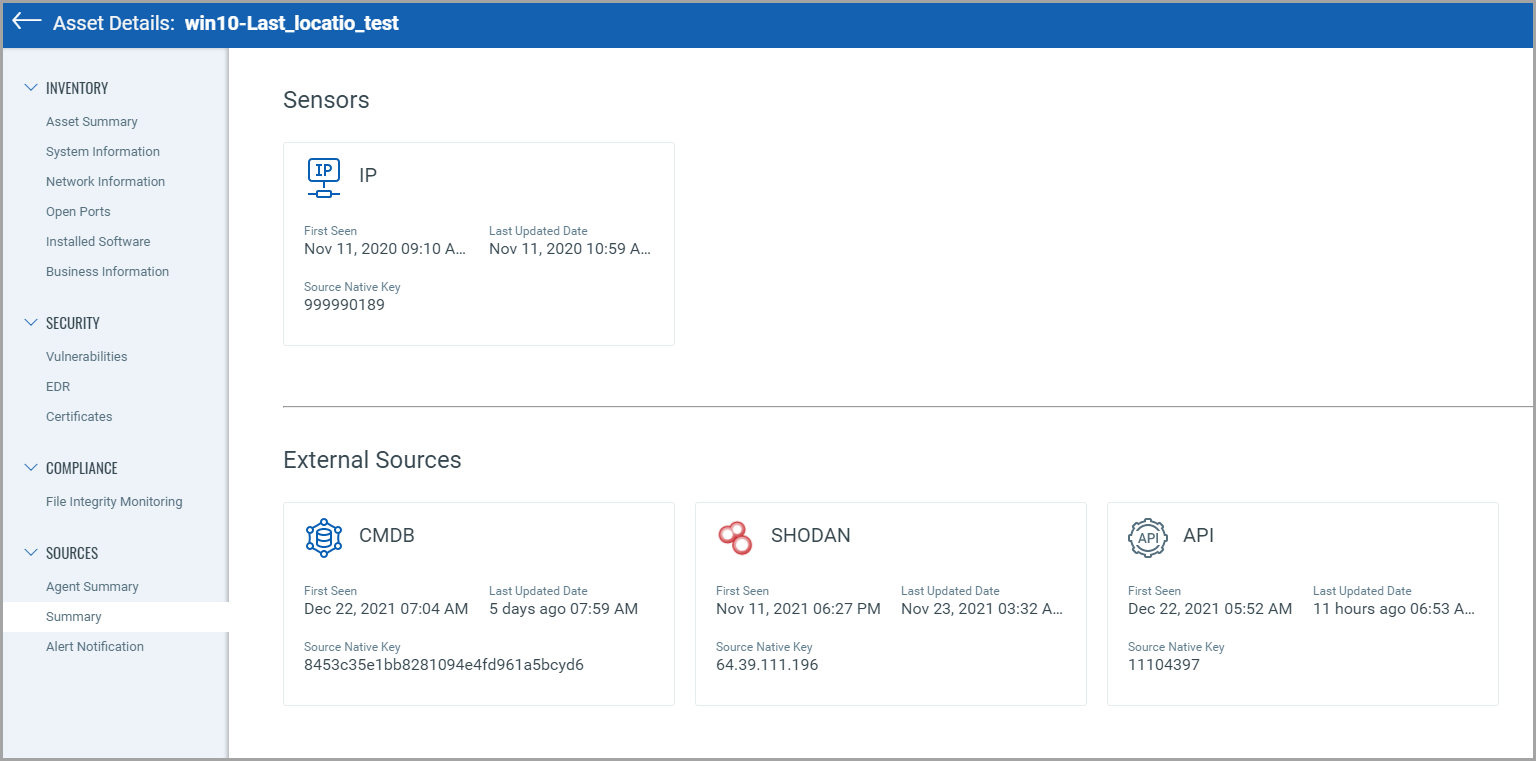
Summary gives information of different sensors and external sources.
The "Passive Sensor" page provides the details of the sensor that reported the asset. However, ICS_OCA tagged assets are created from the project file that is uploaded by the user in the "ICS module". Hence, the passive sensor information is not applicable for such assets and therefore not shown on the 'Passive Sensor' page.

Note: From the Summary tab, you can also see the details of third-party vuln imported assets.

Asset Criticality Score
With CSAM, you can apply tags manually or configure rules for automatic classification of your assets in logical, hierarchical, business-contextual groups. Assign Business Criticality through tags to establish priorities, and automatically calculate the asset criticality score of an asset based on highest aggregated criticality.
Once you've created tags with asset criticality score and added tags to the asset, the asset criticality score of the asset will be calculated. For more information related to defining asset criticality score for the tag, refer to the Configure Tags section. Also, check out this tutorial!
In the following example, asset has three tags with asset criticality score - 5, 4, and 3. So the criticality score of the asset is 5 (the maximum asset criticality score among the three tags).
If the tags associated with your assets do not have criticality score set, by default the asset criticality score '2' will be applied to that asset.
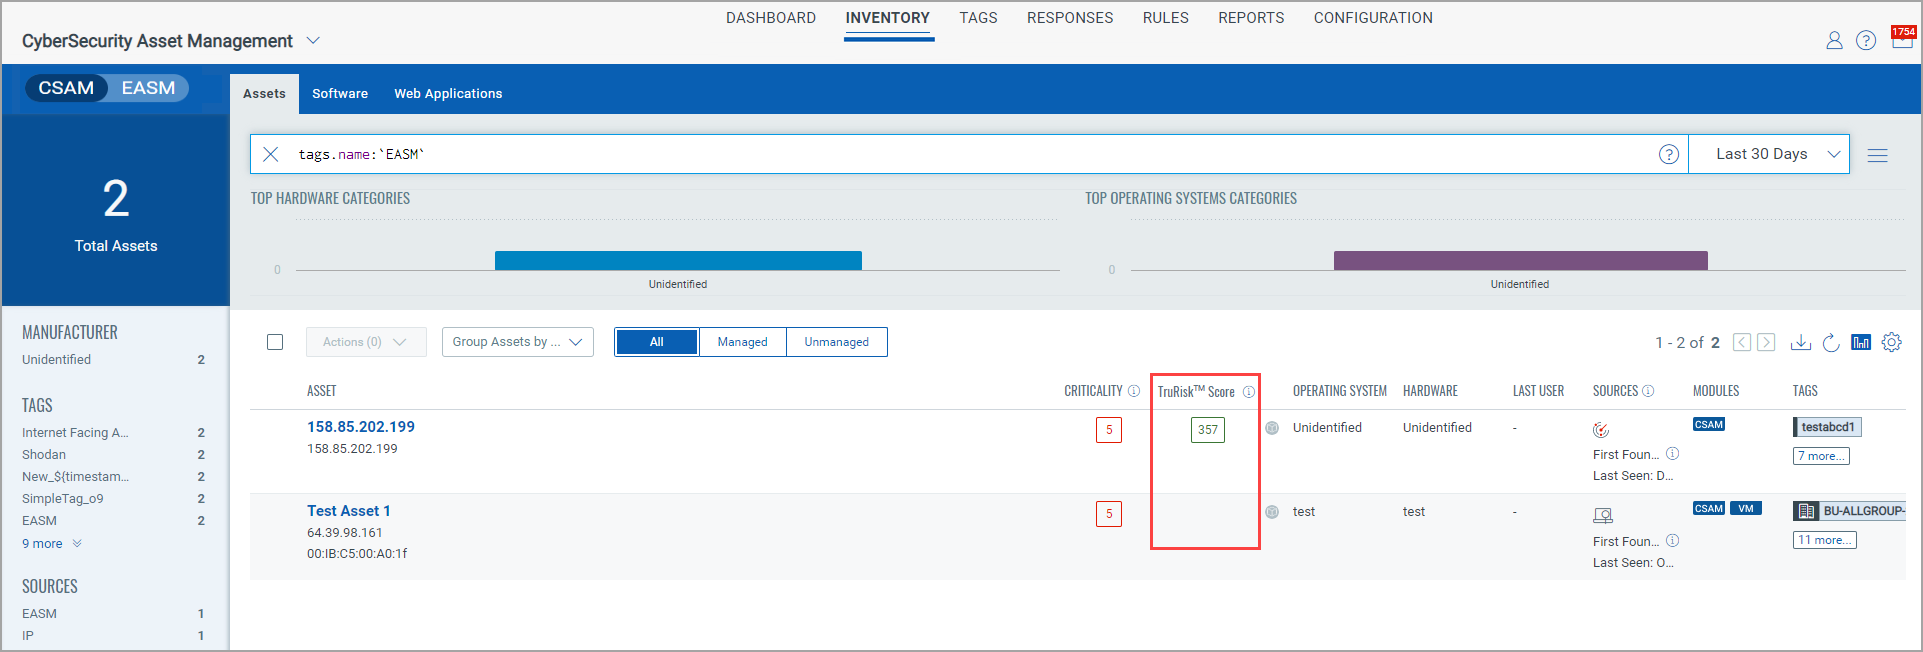
TruRisk Score
TruRisk Score is categorized as Low, Medium, High, and Severe based on the calculated score between 0 to 1000.
The Inventory > Assets tab gives you asset information with the TruRisk Score assigned to the asset.
To know more about the TruRisk Score calculation and how to view TruRisk Score for Managed and externally exposed unmanaged assets, refer to the following topics:
- Viewing Inventory of External Attack Surface Discovered Assets
- Viewing EASM Inventory from EASM Toggle
Activate Passive Sensor Asset
This feature is available with Passive Sensor (PS) version 1.5.0.0 or later.
To activate passive sensor unmanaged assets, click the Activate option from the Quick Actions menu of the asset from the inventory list. You can add IPs of passive sensor unmanaged assets to be scanned by Policy Compliance (PC) or Vulnerability Management (VM) module, or both, by clicking the "Activate" option under the Quick Actions menu.
Note:
- Assets that are tagged with ICS_OCA tag are sensitive in nature, for example, OT assets such as PLCs. Actively scanning such sensitive assets might potentially bring them down. So, the "Activate" option is not visible for all such assets.
- Assets that are sensitive in nature can also be reported by passive sensors deployed in OT networks. The "Activate" option is not visible for such assets as well.
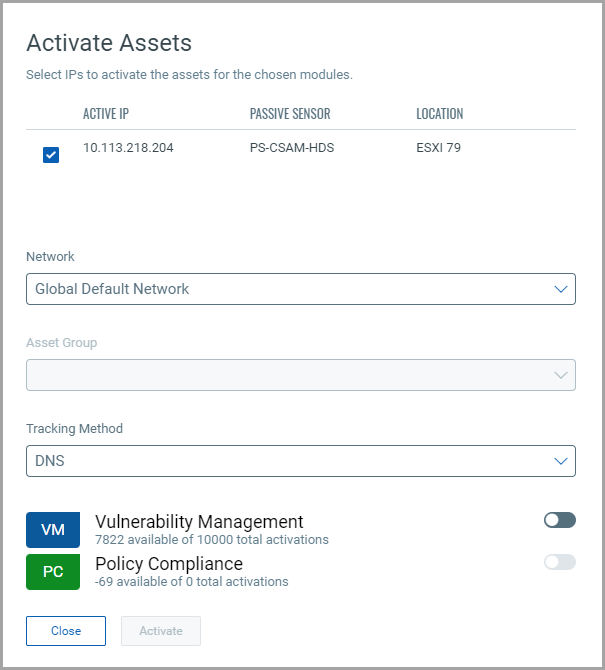
You can select modules for which you want the asset to be activated. Once you activate the asset for the module, the IP of that asset is added for the Policy Compliance (PC) or Vulnerability Management (VM) scan.
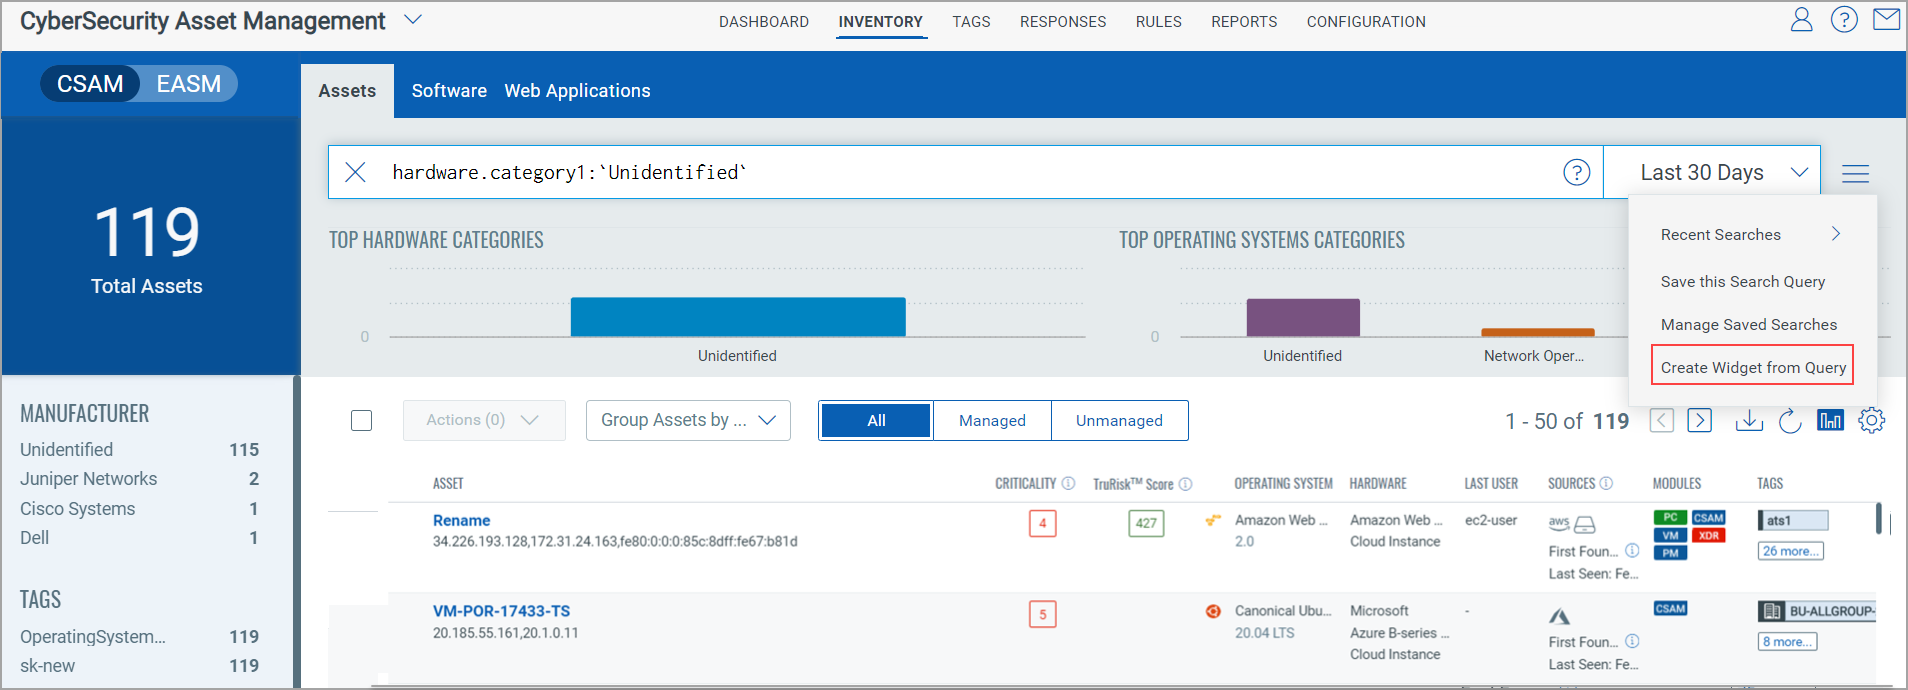
Search Actions
The Inventory > Asset and Software tab gives you the flexibility to create the widget from query. Click Create Widget from Query to quickly build a widget from the search query you have built.
Alternatively, you can build your widget from the Dashboard tab. Go to the Dashboard tab and click the Add Widget icon. From the "Add or Customize Dashboard Widget Templates" page, click Build your widget.
Note: You can create the widget from the query using the Assets as well as Software.
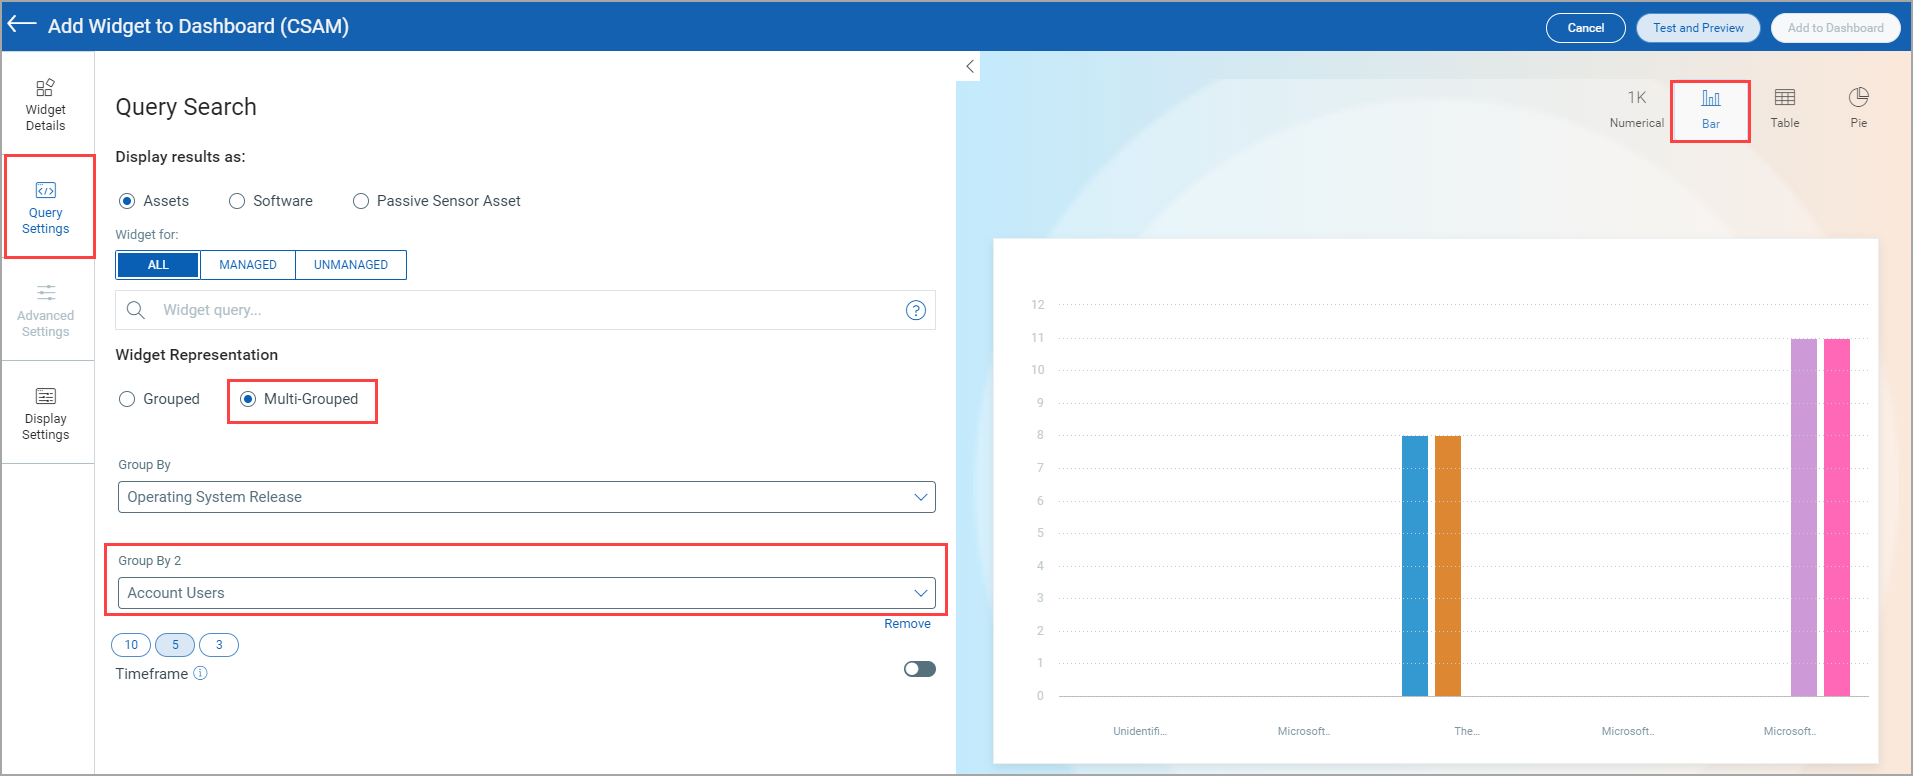
The widget builder is displayed with pre-populated search query. You can give a name and description to the widget. If you want to show description on widget and widget representation, enable the checkbox Show description on widget and select the Widget Representation as Regular or Summary.
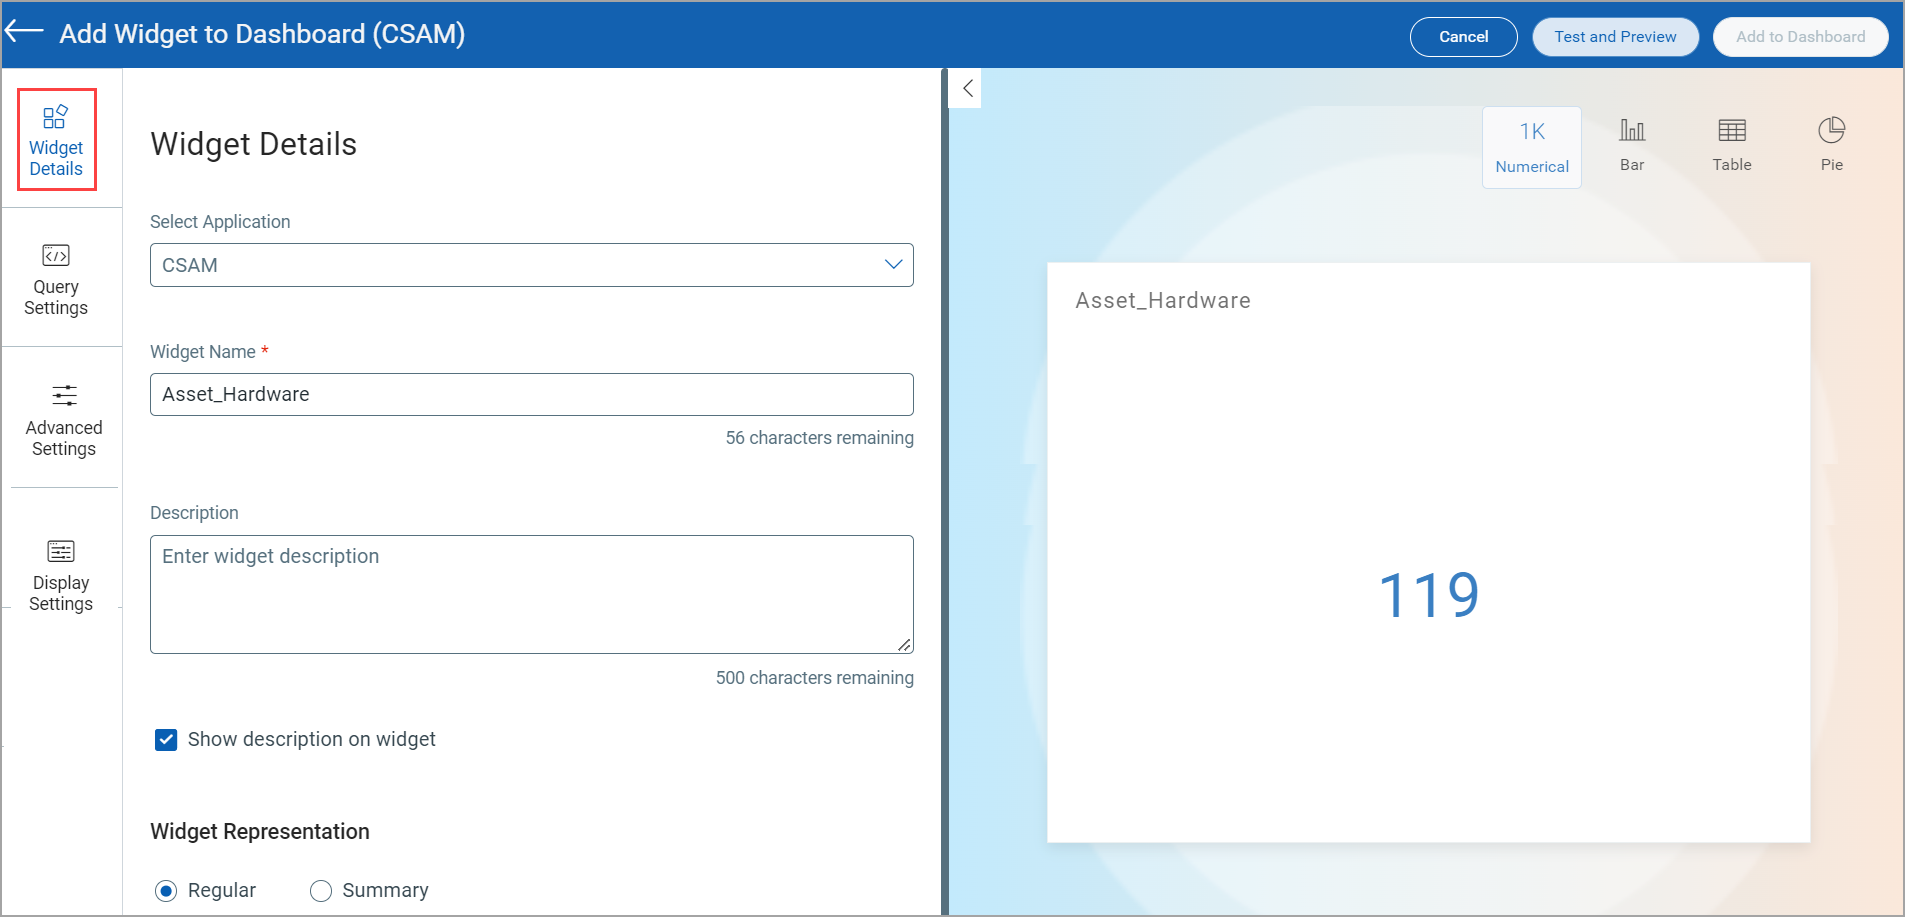
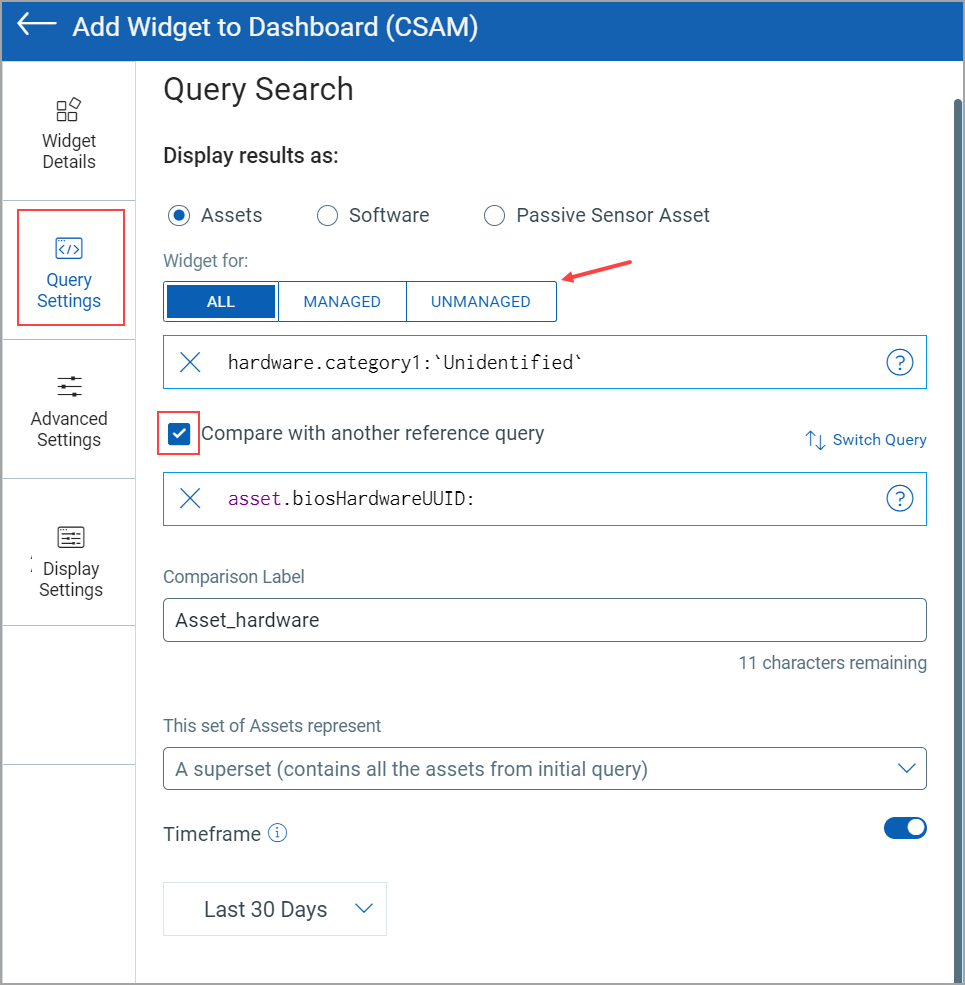
Select Display results as: Assets, Software, or Passive Sensor Asset to add your query and widget for ALL, Managed, and Unmanaged assets.
To add your query and widget to show the Group by details, you must click Bar, Table, or Pie. Select the required option from the Group by list then.
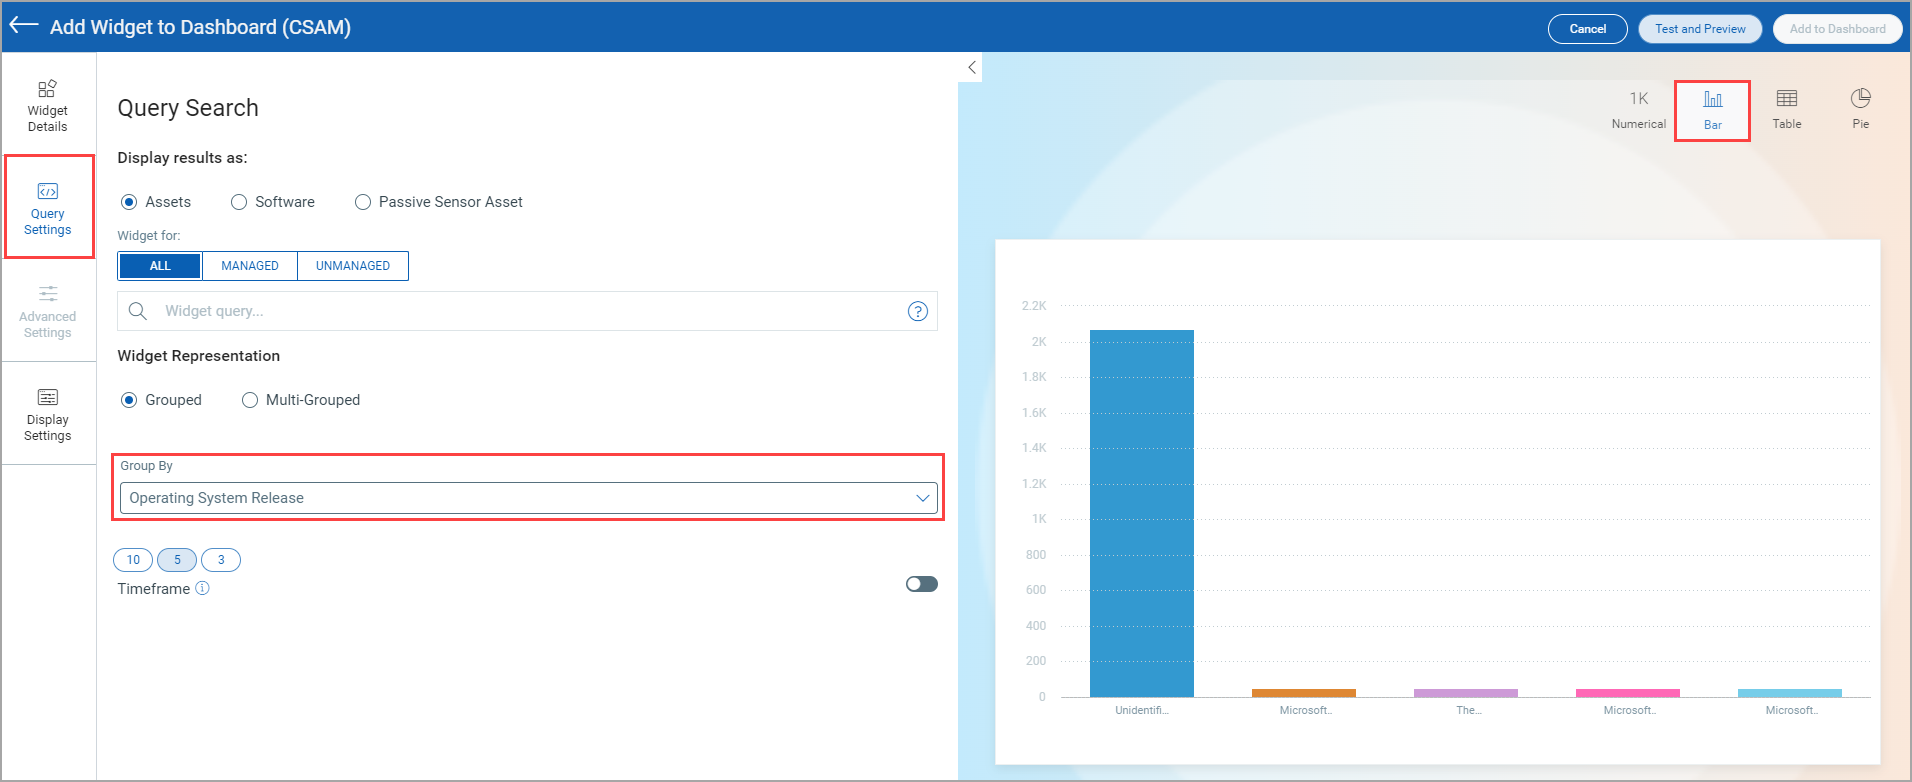
For Multi-Grouped representation, click Multi-Grouped and then click the Group by 2 (X-axis 2) link. The Group By 2 list is shown. Select the required option from the Group By 2 list then.