Gather Dynamic Attributes from Multiple Providers via System Events
We can gather dynamic attributes from multiple providers. This creates a robust, adaptable system for managing system events, making it easier to add new providers and event types.
Viewing System Events
To get started
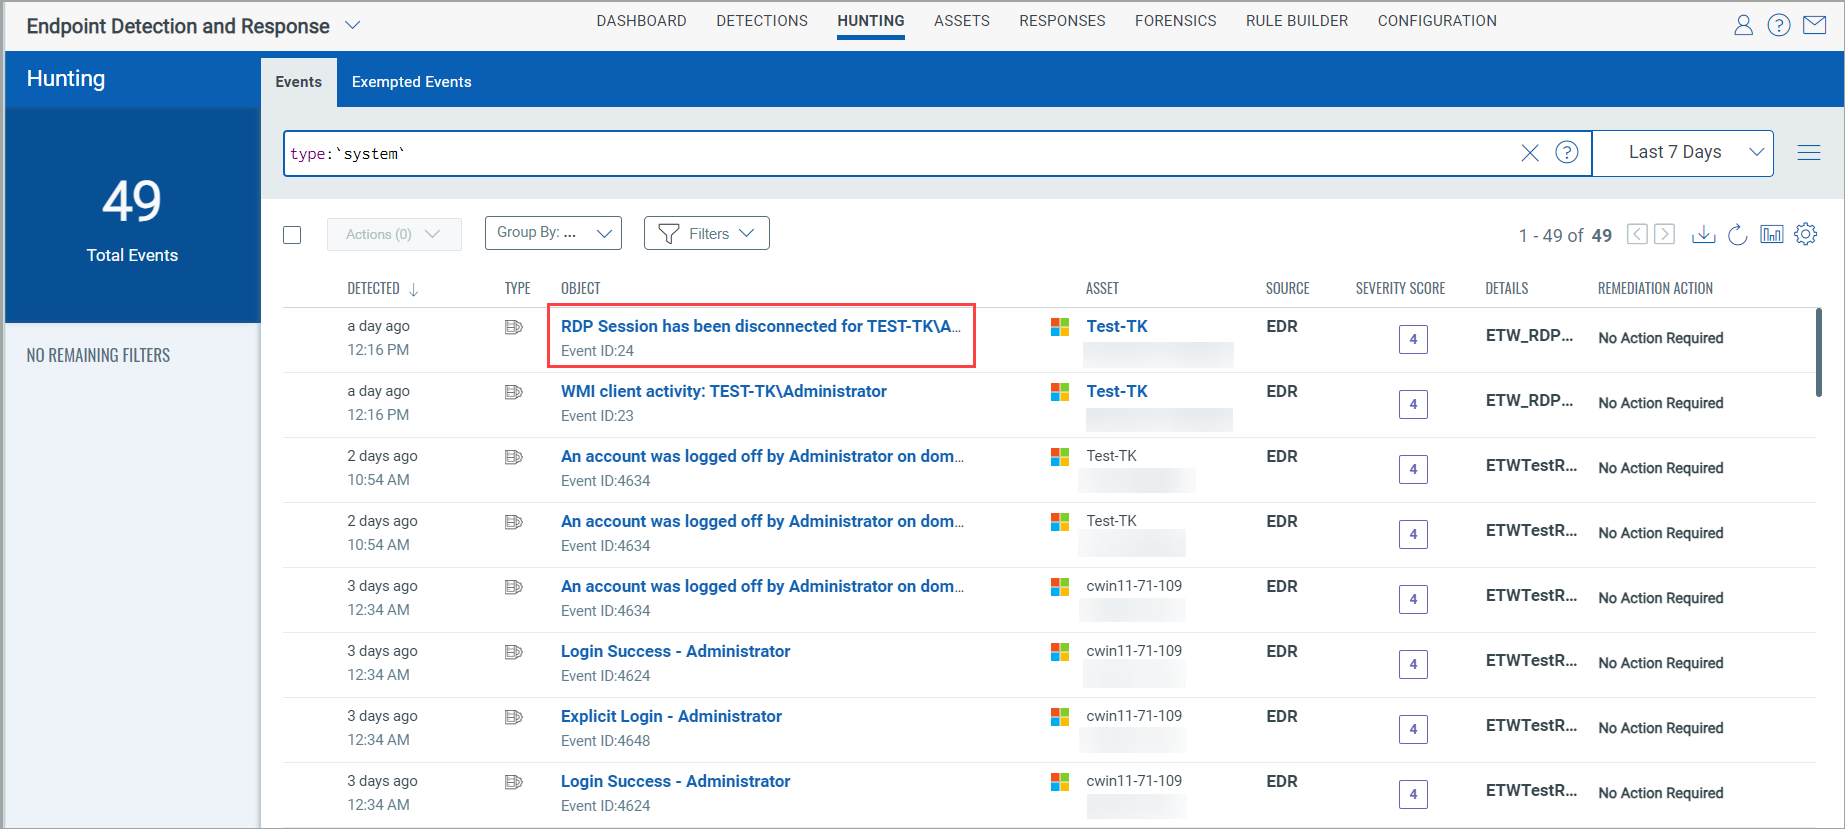
- In the Endpoint Detection and Response menu bar, click Hunting.
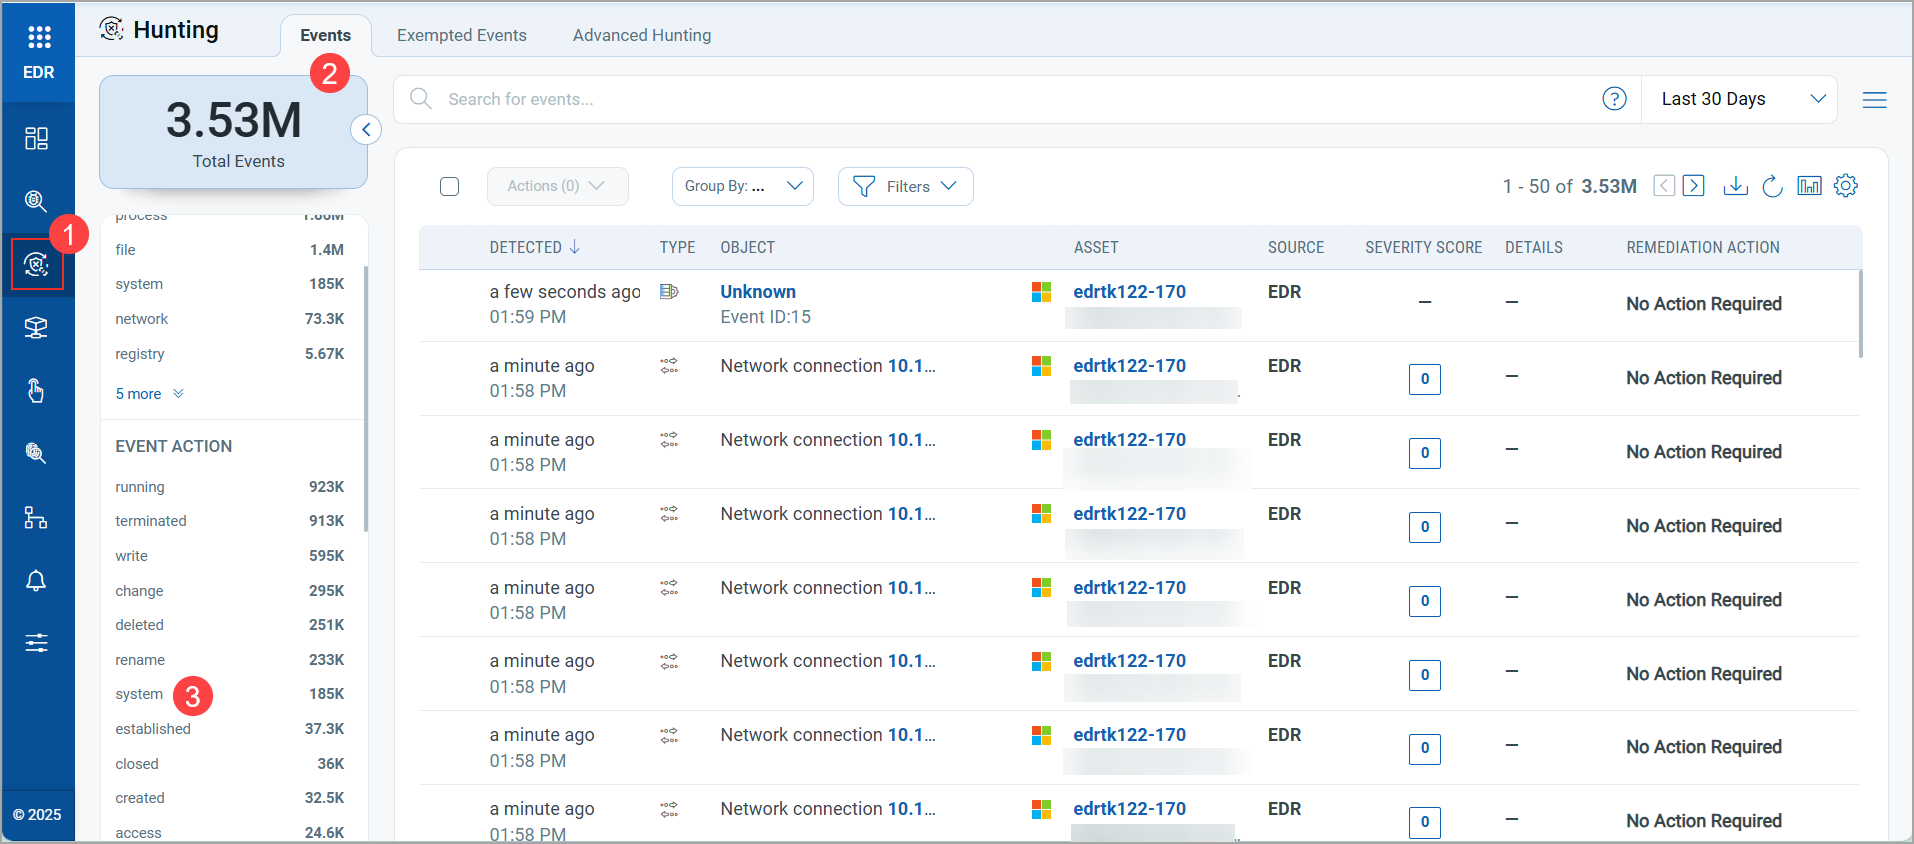
- In the Type panel, click system.
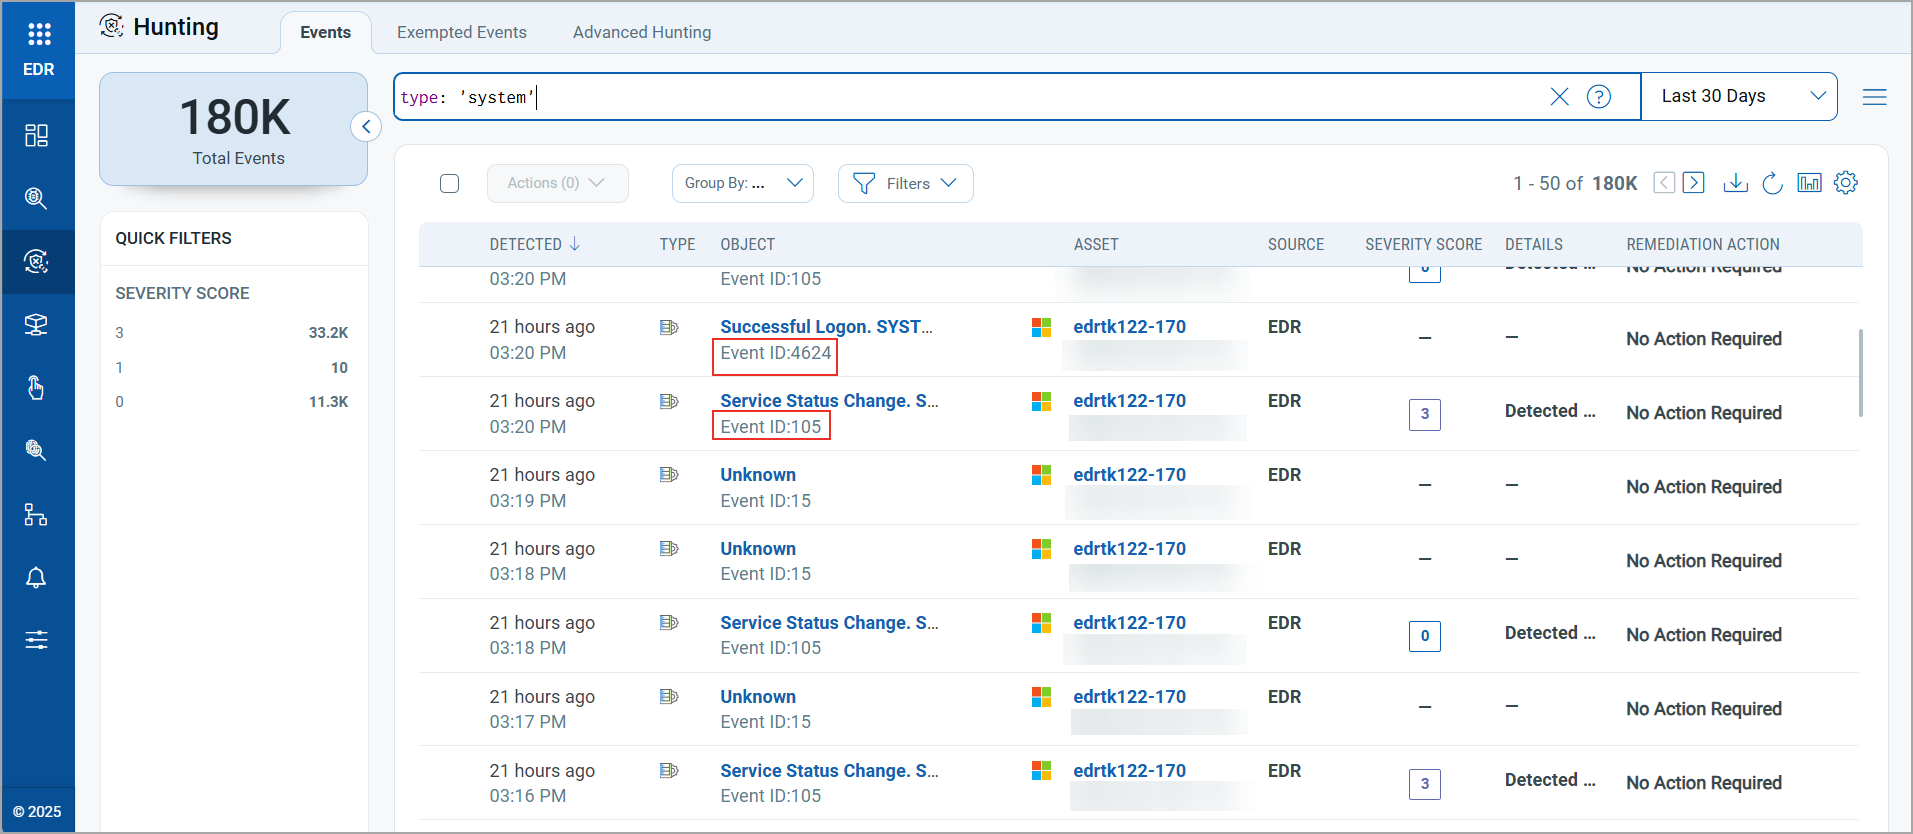
Alternatively, enter type: 'system' in the search bar and press Enter. All the system events are displayed.
Filtering Events
Via QQL Tokens
You can filter events using the following QQL tokens:
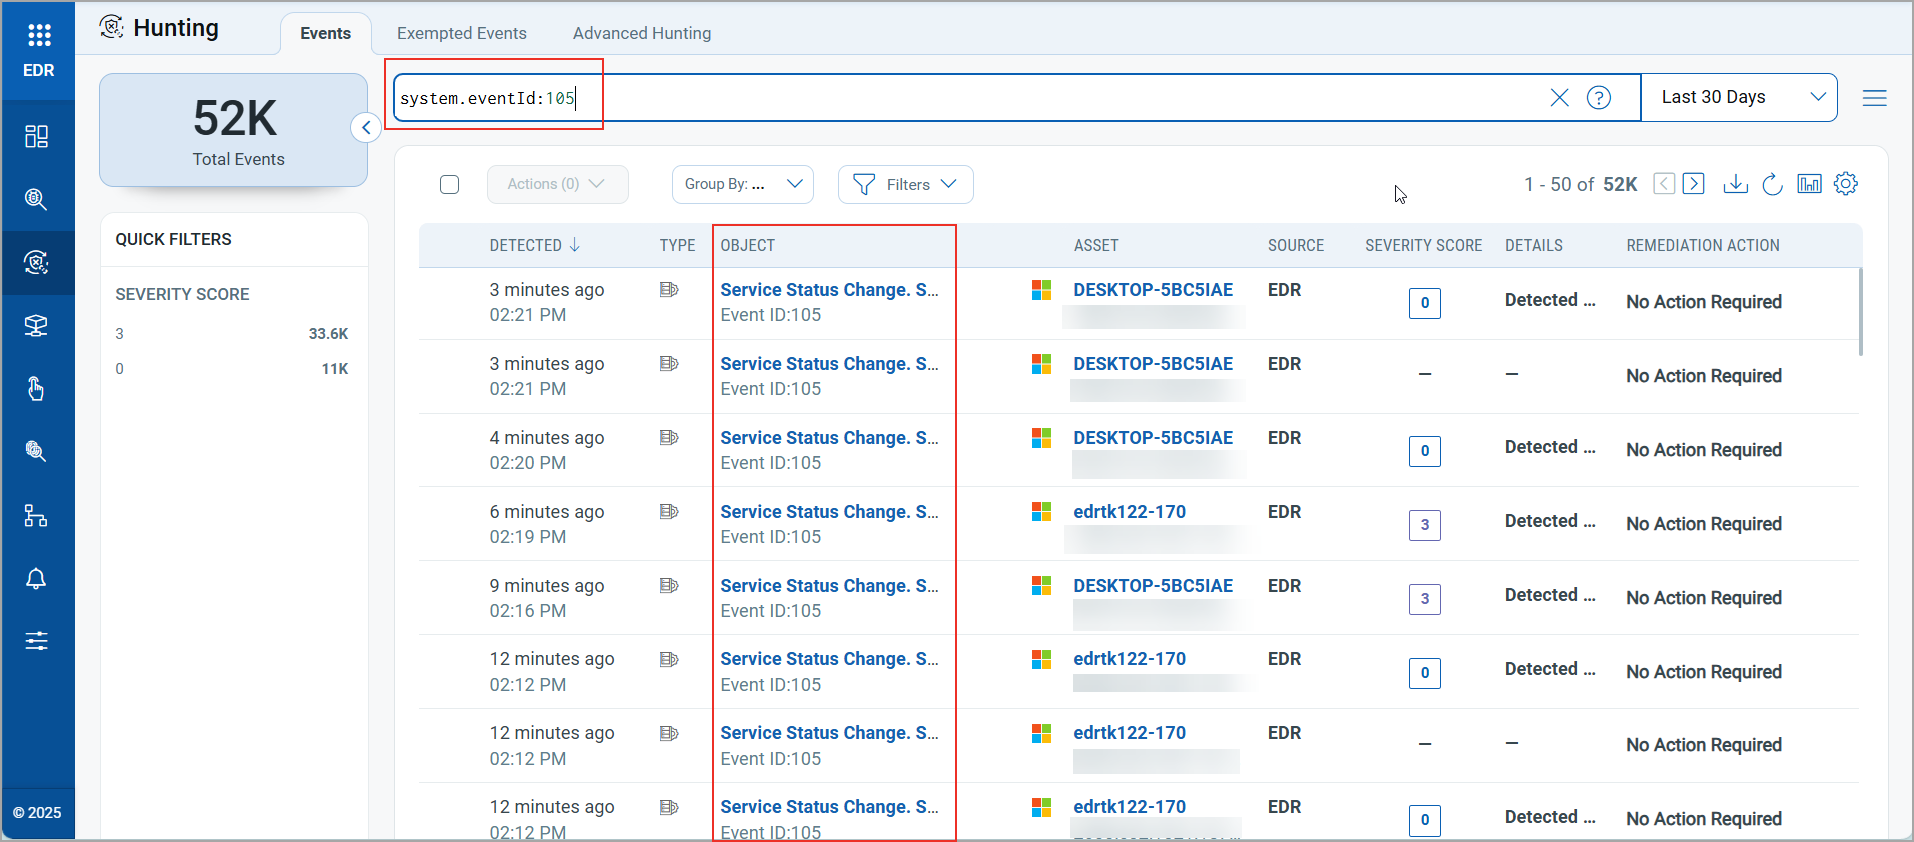
- system.eventid – to view system-type events for a particular event type. For example, system.eventid:4624
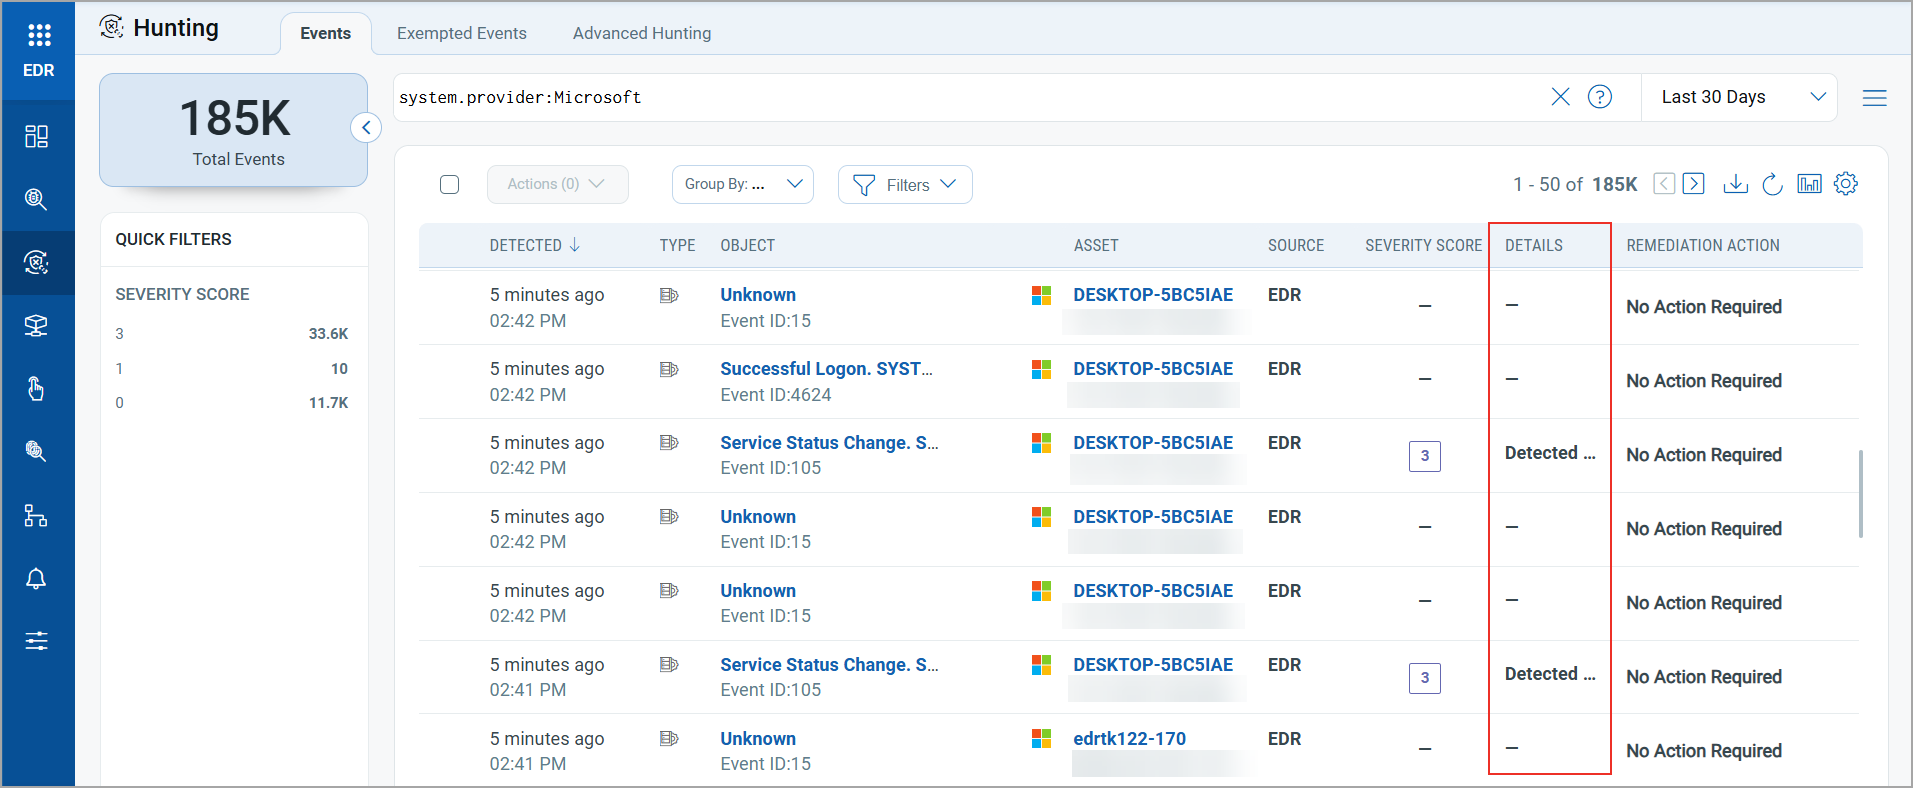
- system.provider - to view system events based on provider. For example, system.provider:‘Microsoft-Windows-Win32k'
Via Incident Number
You can view system events by their incident number. An "incident" refers to a significant event or a group of events logged for monitoring, debugging, and performance analysis. You can access this information through the Detections or Hunting tabs. All incidents related to the event will be displayed in these tabs, along with additional events. You can use the QQL query type: SYSTEM to filter the system events from the events list.
Via Detections
Perform the following steps:
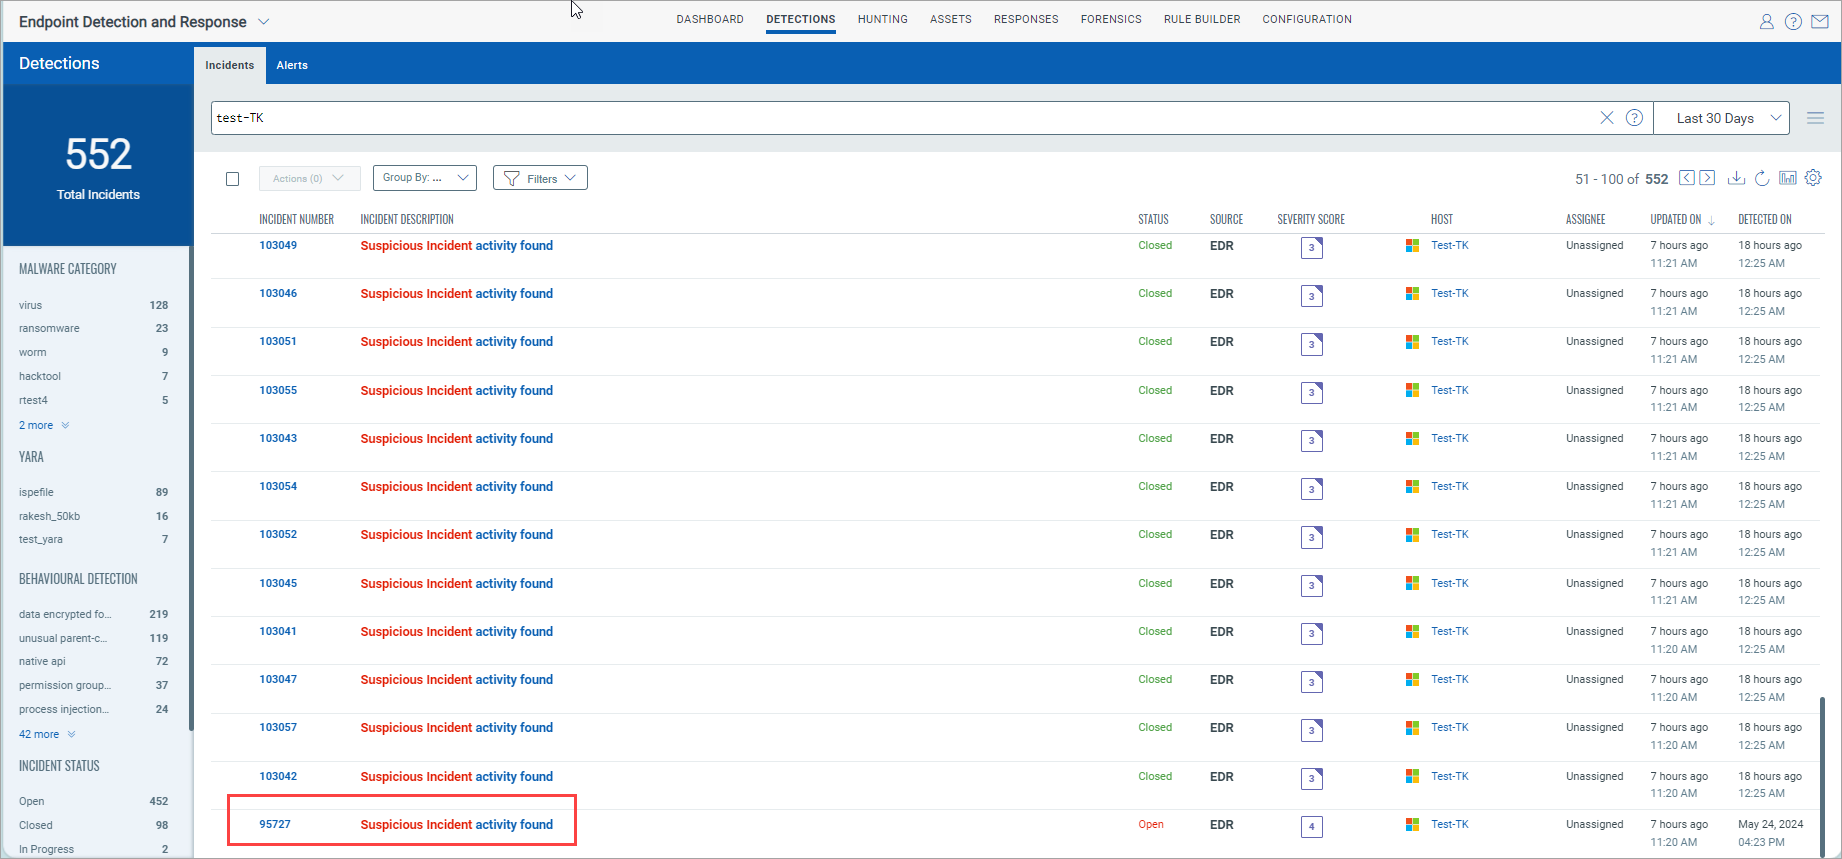
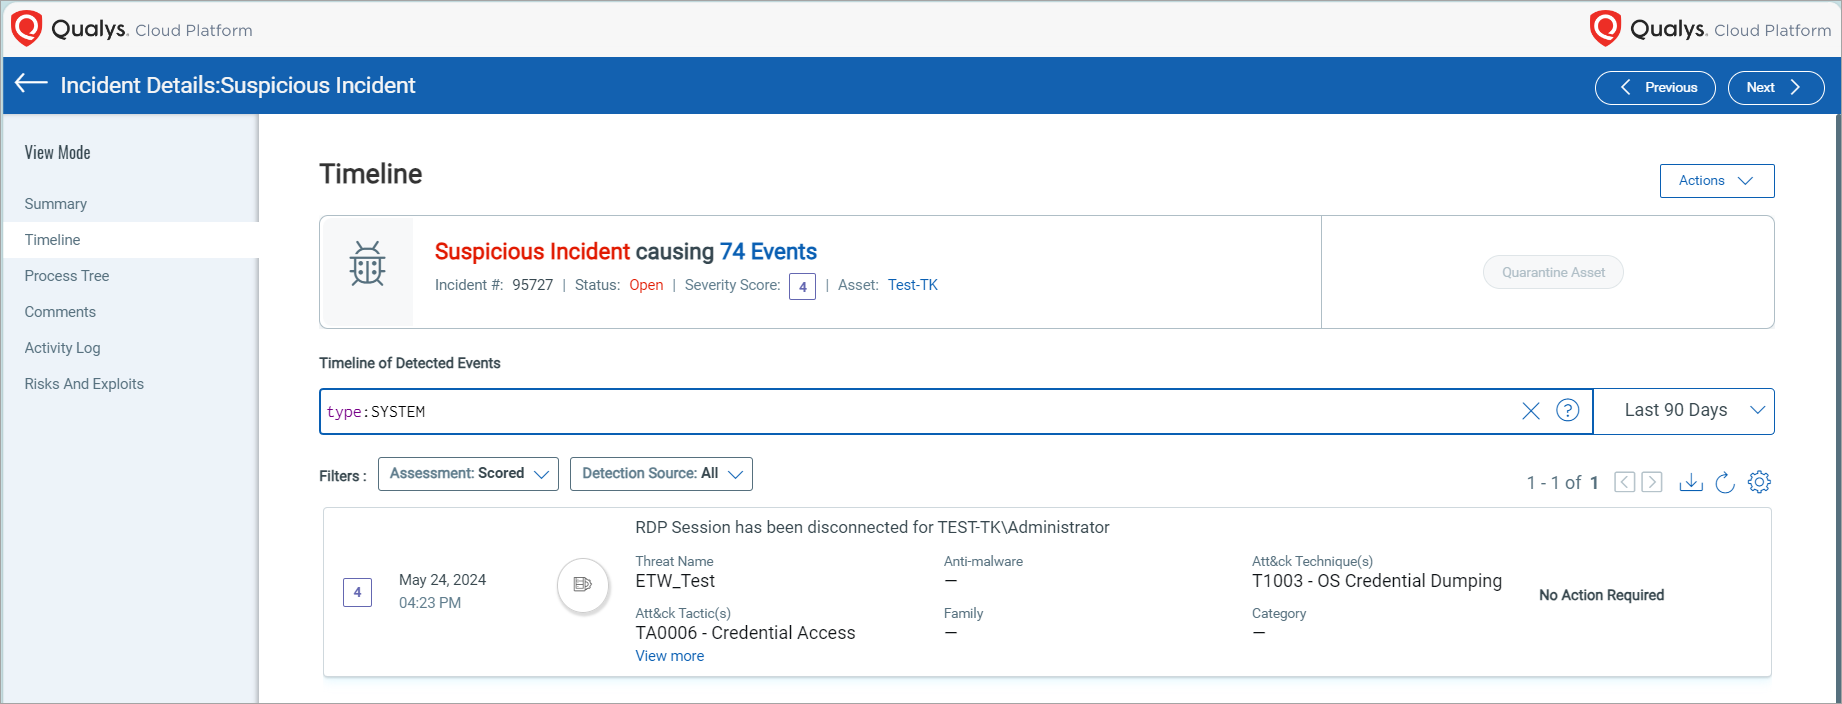
- Go to Detections > Incidents.
- Click an incident from the Incident Number column.
- In the Timeline view, click the Events link to see the events generated for the incident.
- In the Search bar, enter type:SYSTEM and then press Enter on your keyboard.
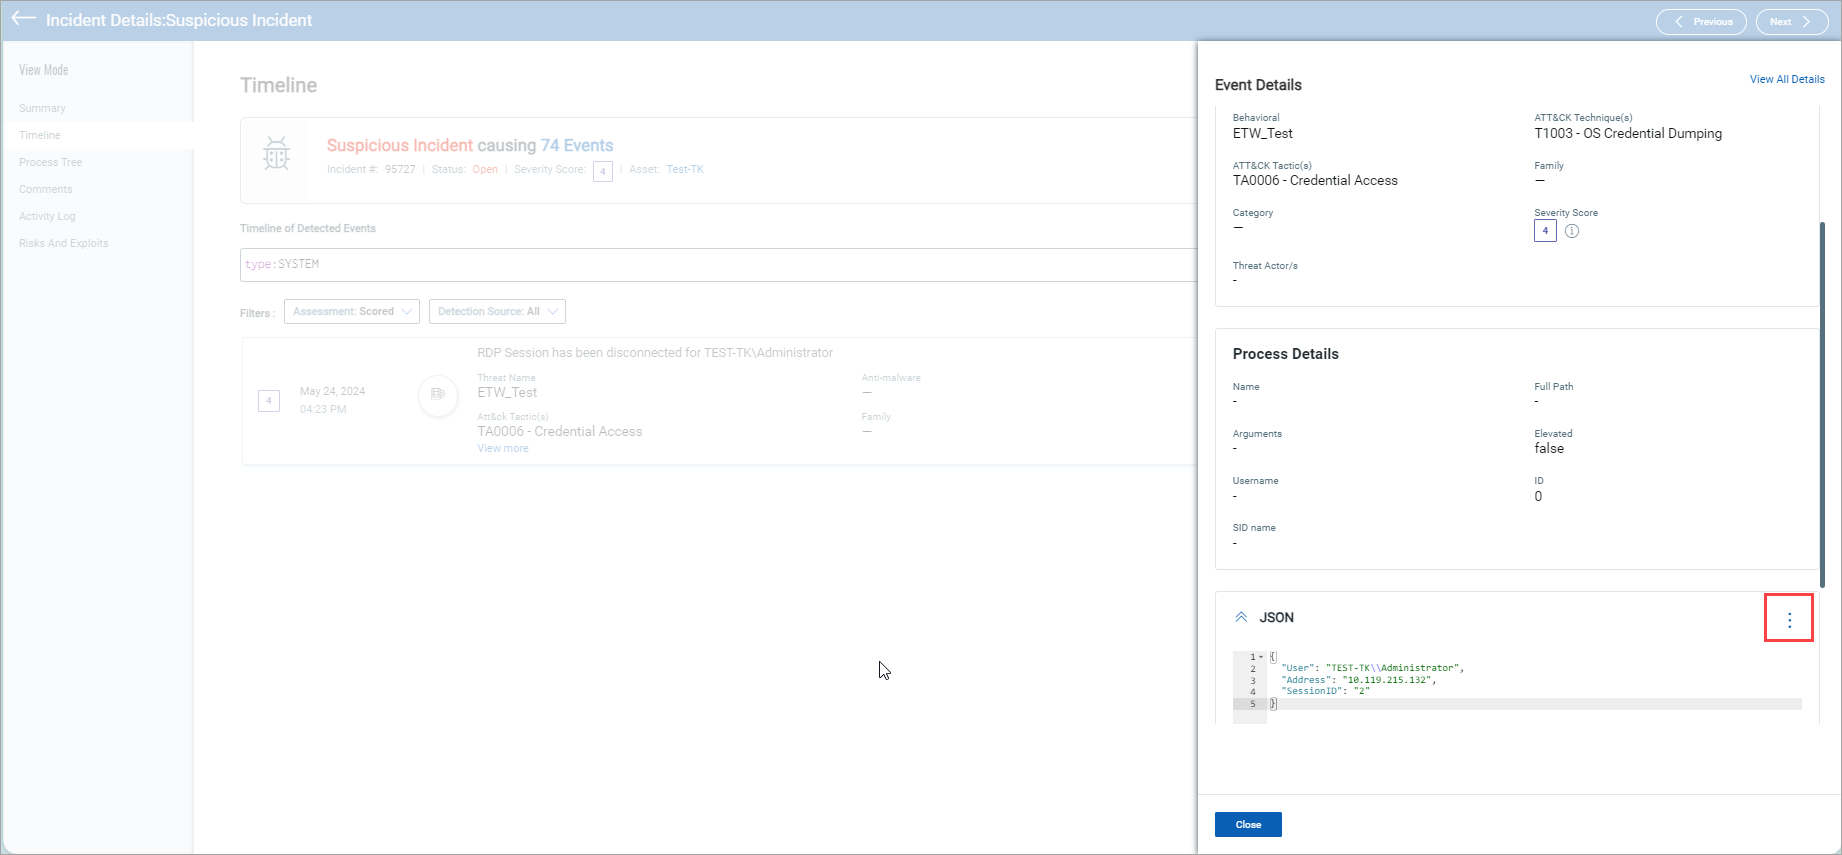
- (Optional) Click View more to see the event details, which include threat, process, and JSON details. You can download the JSON file by clicking the three vertical dots and then clicking Download. This downloading functionality is also available in the Hunting > Event > Event Details view.
Via Hunting
Perform the following steps:
- Click the Hunting tab.
- In the Search bar, type:SYSTEM and press Enter on your keyboard.
- Click an object.
- In the Summary view, click Suspicious Incident.
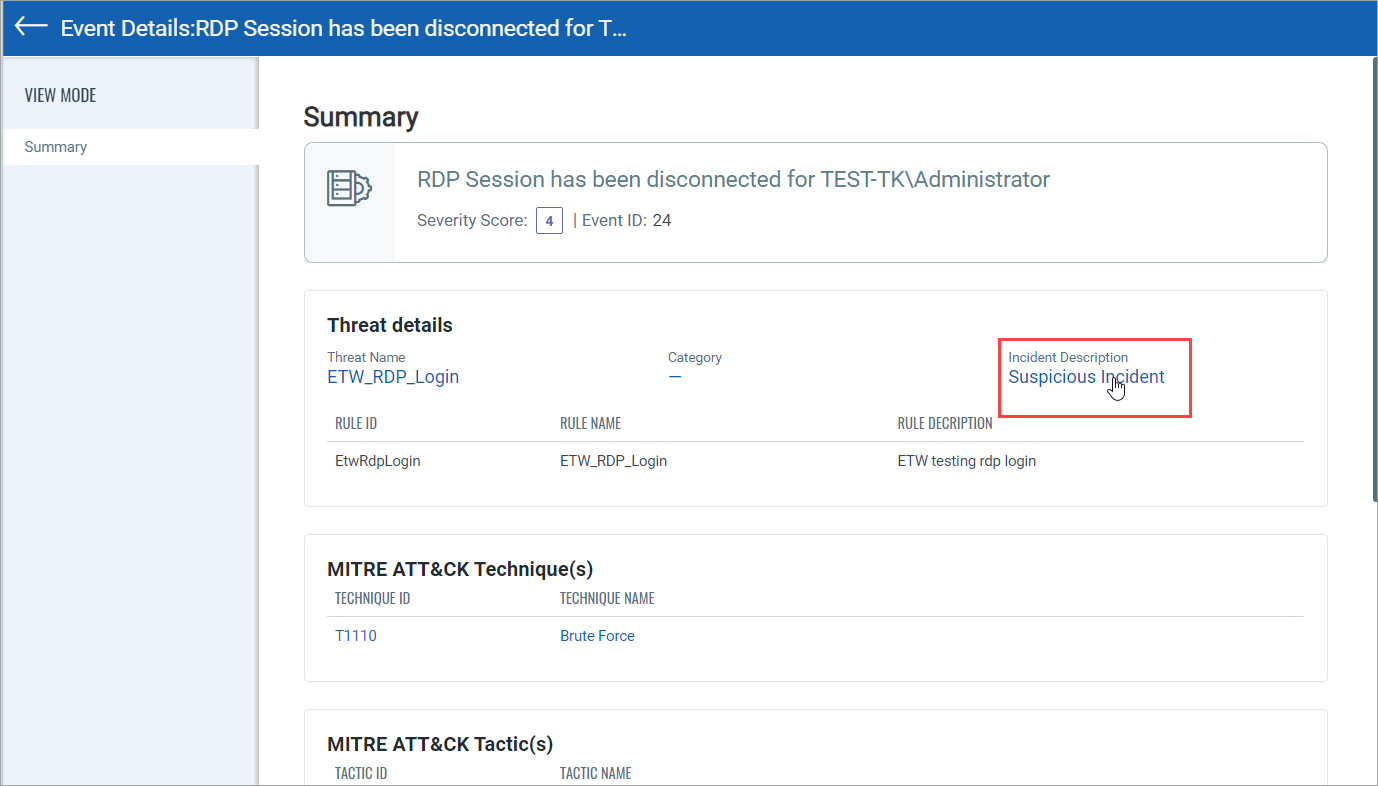
You are redirected to the Incidents Details page. You can perform steps 3-5, mentioned in the Via Detections section above.
Viewing the Event Summary
When you click an event, the Summary page opens. Summary is a concise overview of the event and typically includes critical details that help security analysts quickly understand its nature, scope, and potential impact.
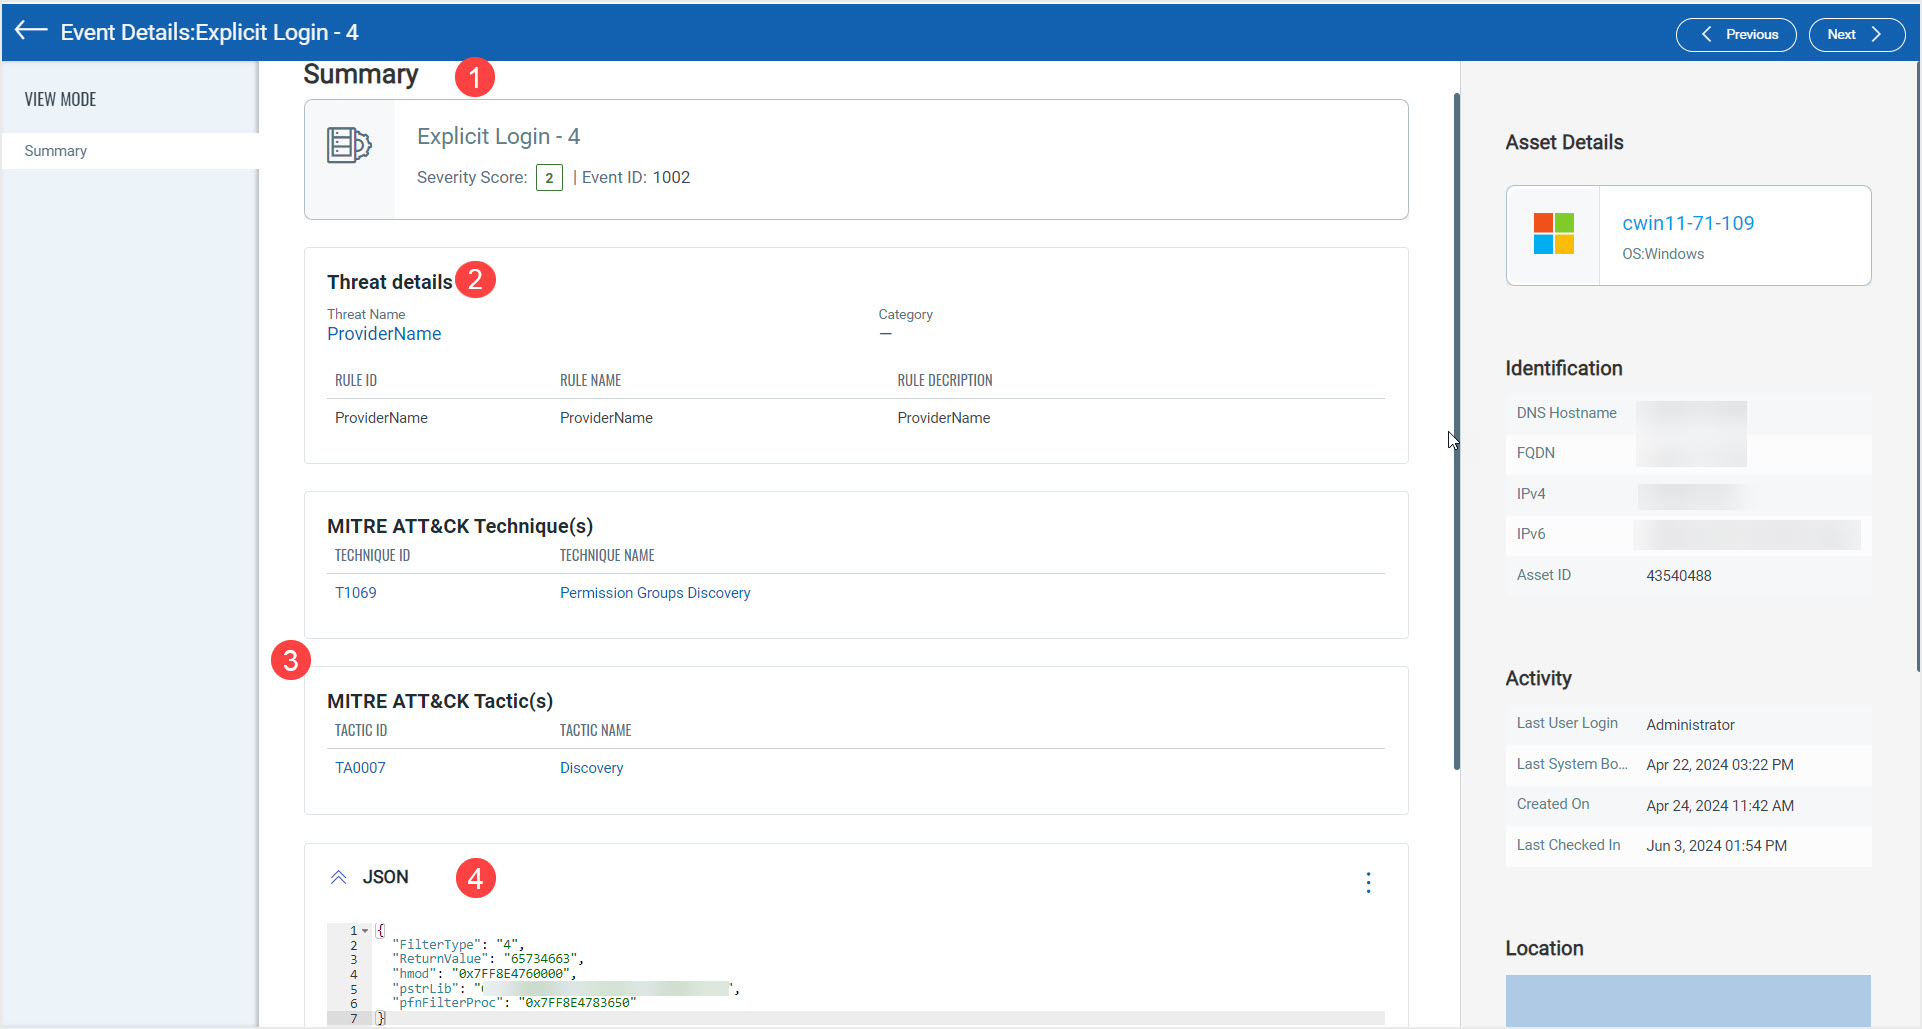
Here’s what you see when you click an event.
| Area | Description |
| 1 - Summary | This shows the event label, severity score, and event ID. |
| 2 - Threat details | This shows the threat details. |
| 3 - MITRE Attack Tactics and Techniques |
This shows the MITRE Attack information. |
| 4 - JSON | This information can be used by threat research or security teams to create security rules. You can also use it to perform free text searches for events. |
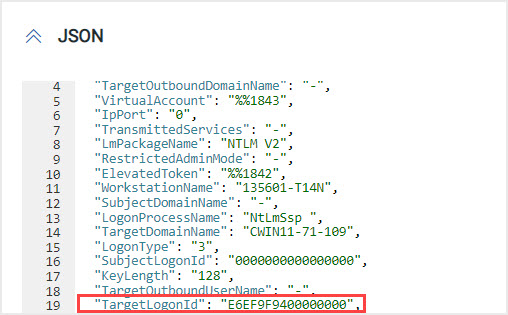
Performing Free Text Search via JSON
We have provided the ability to perform free text search in JSON. This means searching through JSON data to find entries that match a given search query.
To perform this action
- In the Endpoint Detection and Response menu bar, click Hunting and then click the Events tab.
- In the Type panel, click system. Alternatively, enter type: ‘system’ in the search bar and press Enter on your keyboard. All the system events are displayed.
- Click an event.
- In the Summary page, scroll to the bottom, and under JSON, copy the input information of a string.
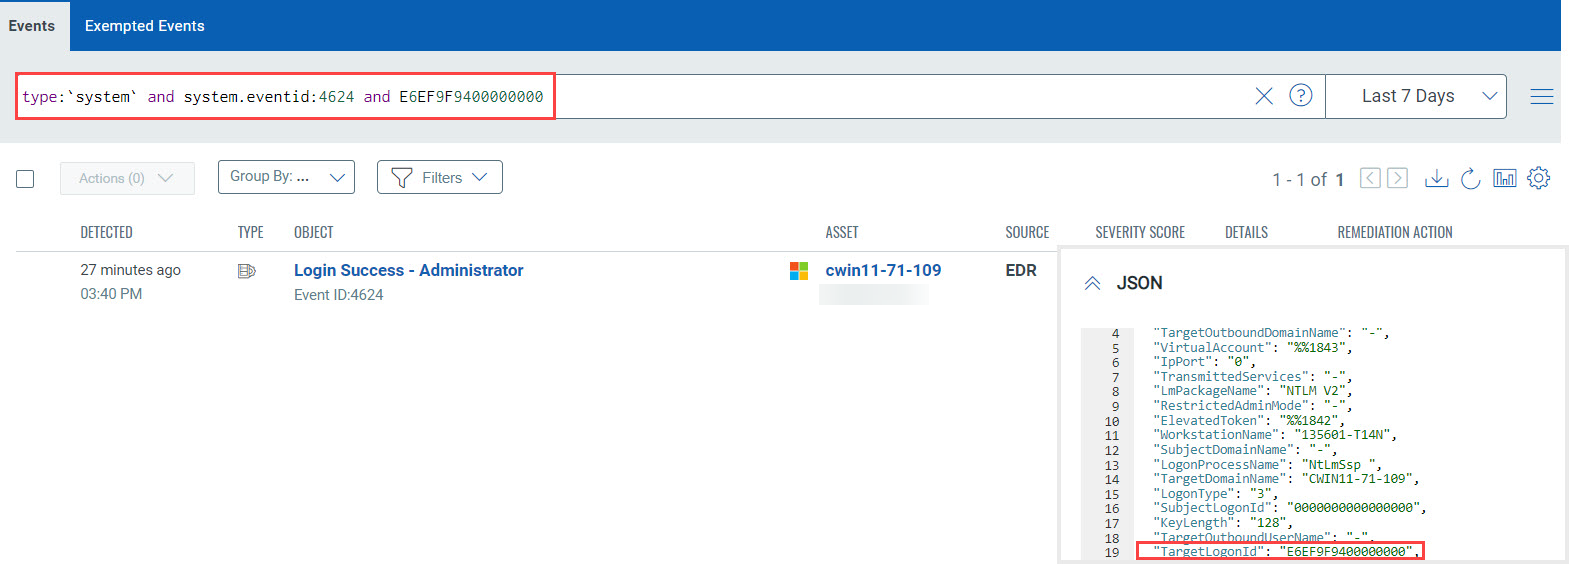
- Go to Hunting > Events > enter the query and the text copied from JSON and press Enter on your keyboard. The event-matching query is displayed.
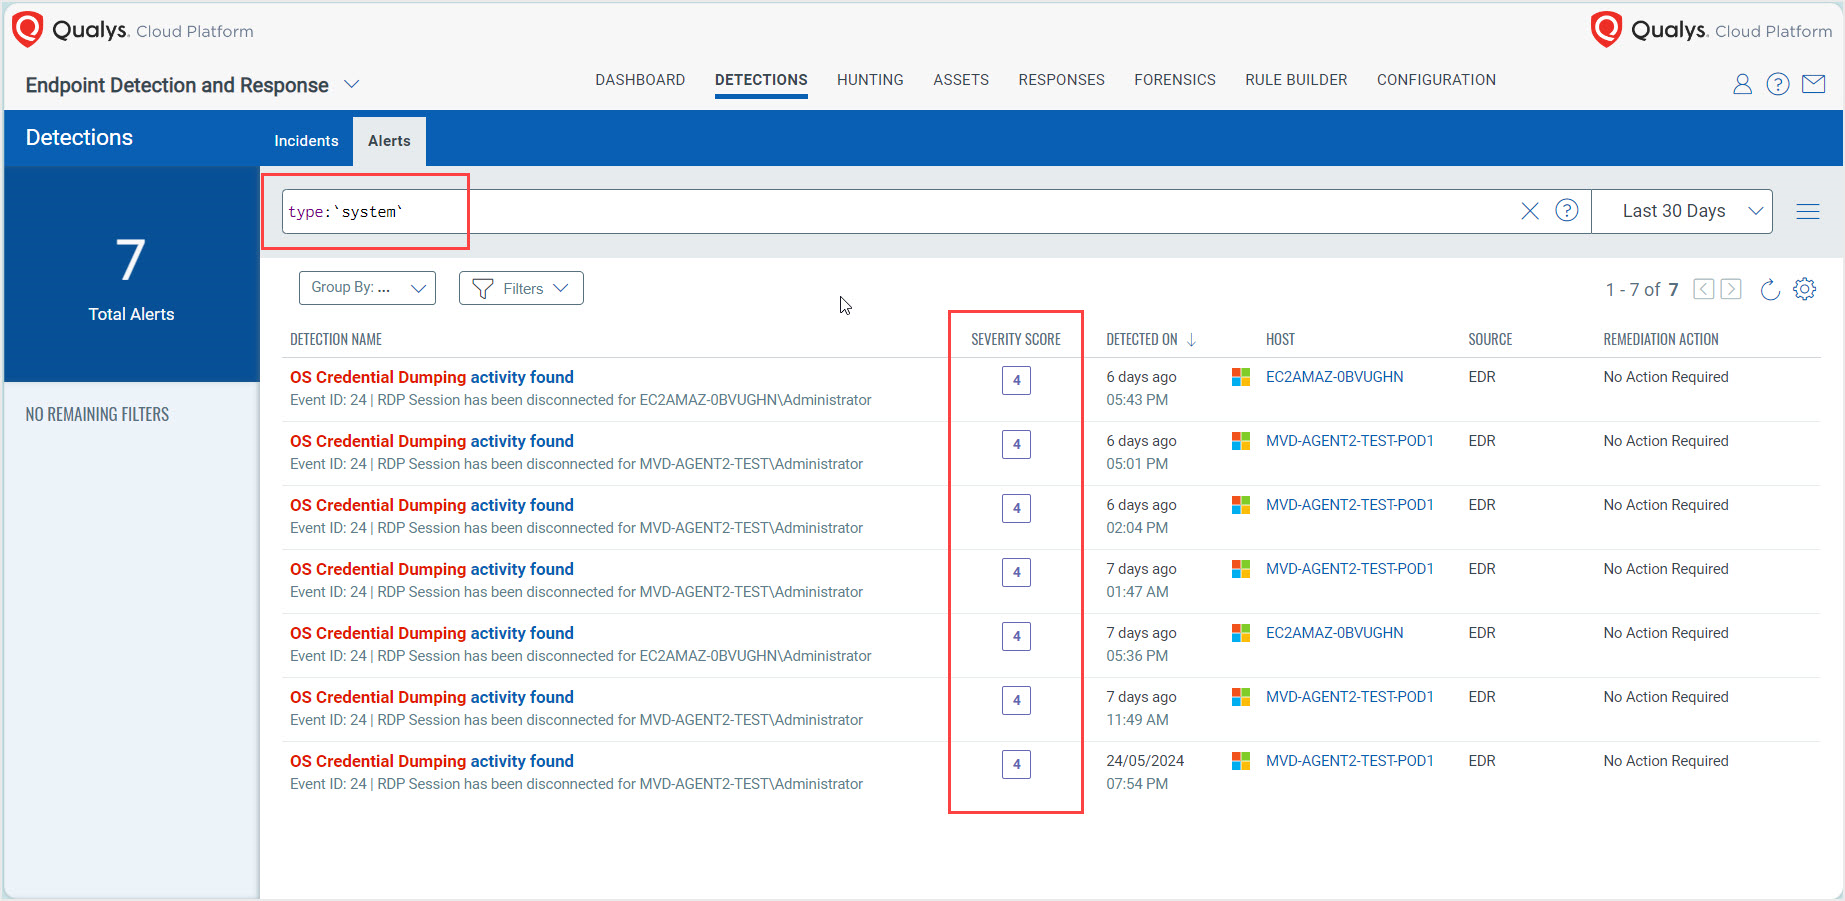
Viewing Events based on their Severity Score
The event scores can be viewed under Detections > Alerts. In the Type panel, click system to display only events with a severity score.
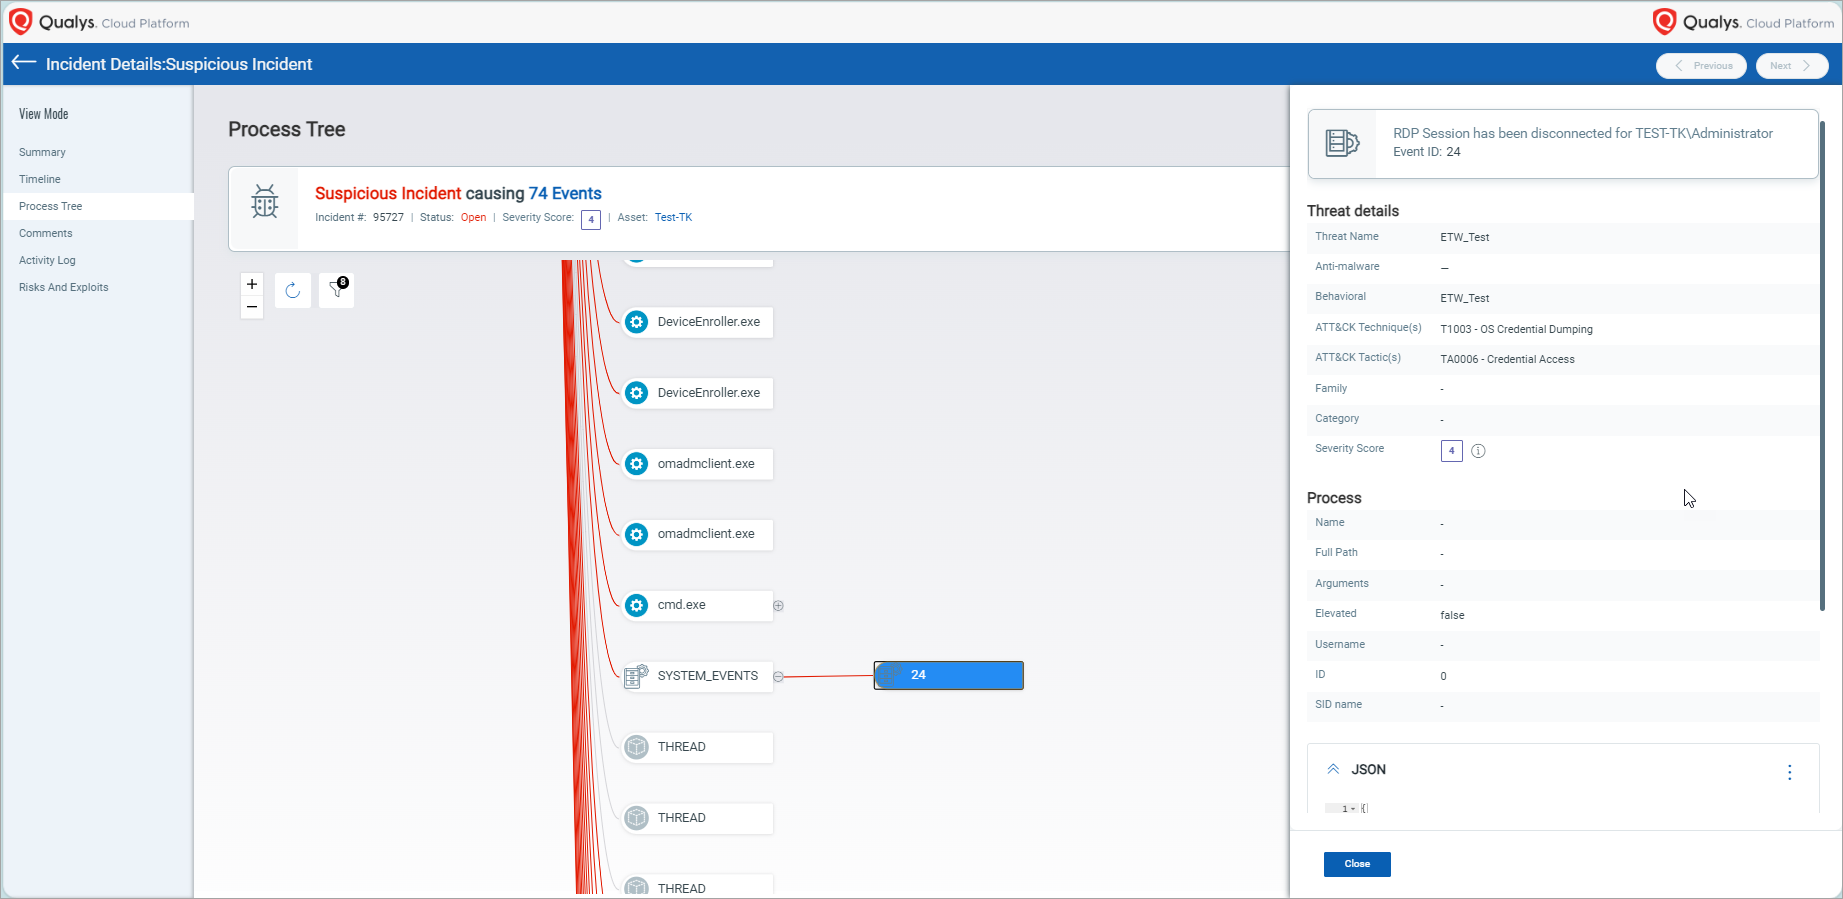
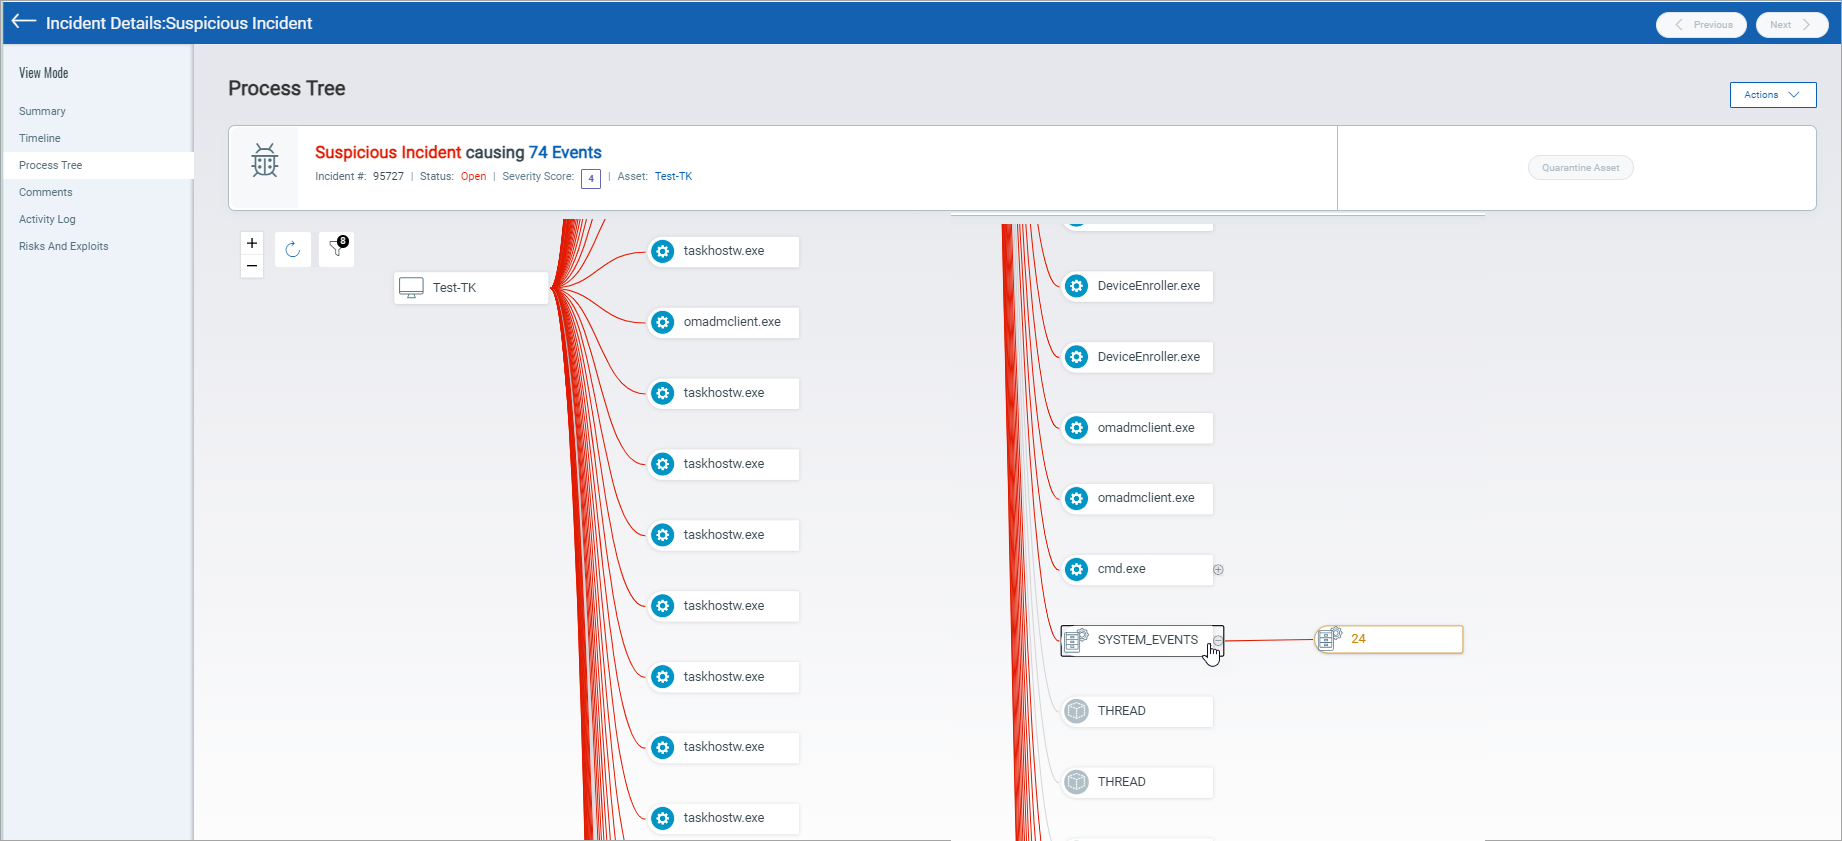
Viewing System Events as a Process Tree
When used in the context of events, a "process tree" refers to a hierarchical representation of processes in which each process can have one or more events.
To view the process tree
- Go to Detections > Incidents.
- In the search bar, enter incident.number: followed by the number and press Enter on your keyboard. For example, incident.number:95727
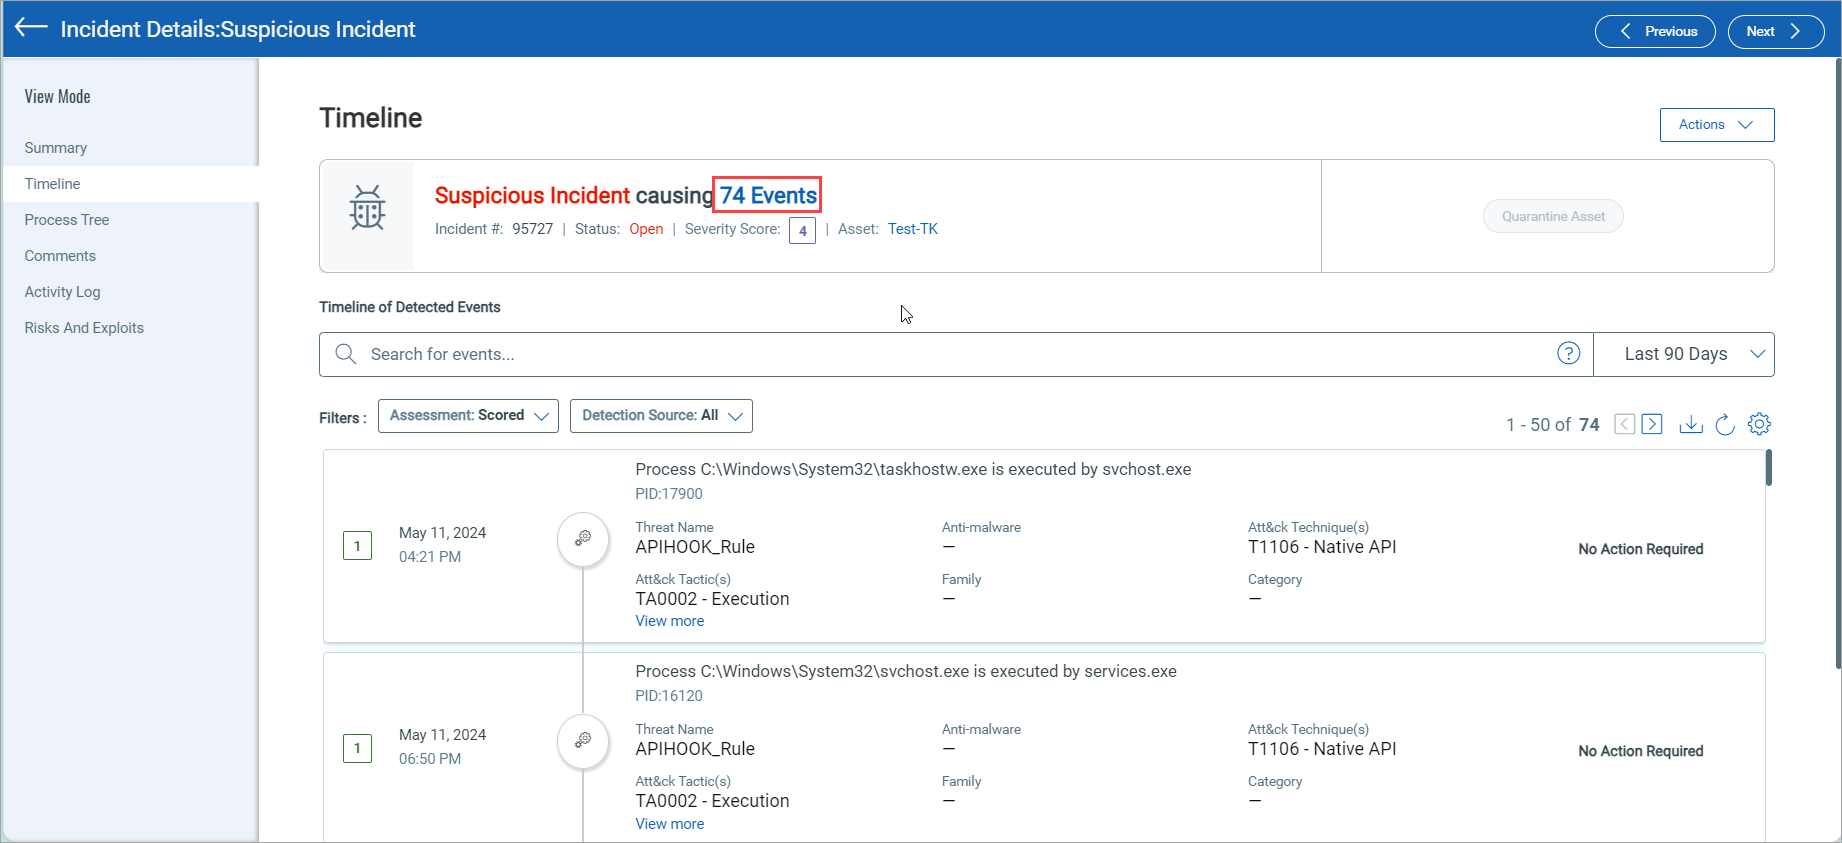
- Click the incident number. The Incident Details page for that incident is displayed.
- In the View Mode panel, click Process Tree.
In this example, you can see 74 events associated with this incident. Now scroll to the SYSTEM_EVENTS event and click the plus sign (+). The event IDs associated with SYSTEM_EVENTS are displayed.
- Use the filter to filter the events you want to see.