Incident Details
The Incident Details window displays the information about the following:
Summary
The Summary section in the Incident Details provides the overall overview of the Asset Details, Threat Actors, and Malware Summary.
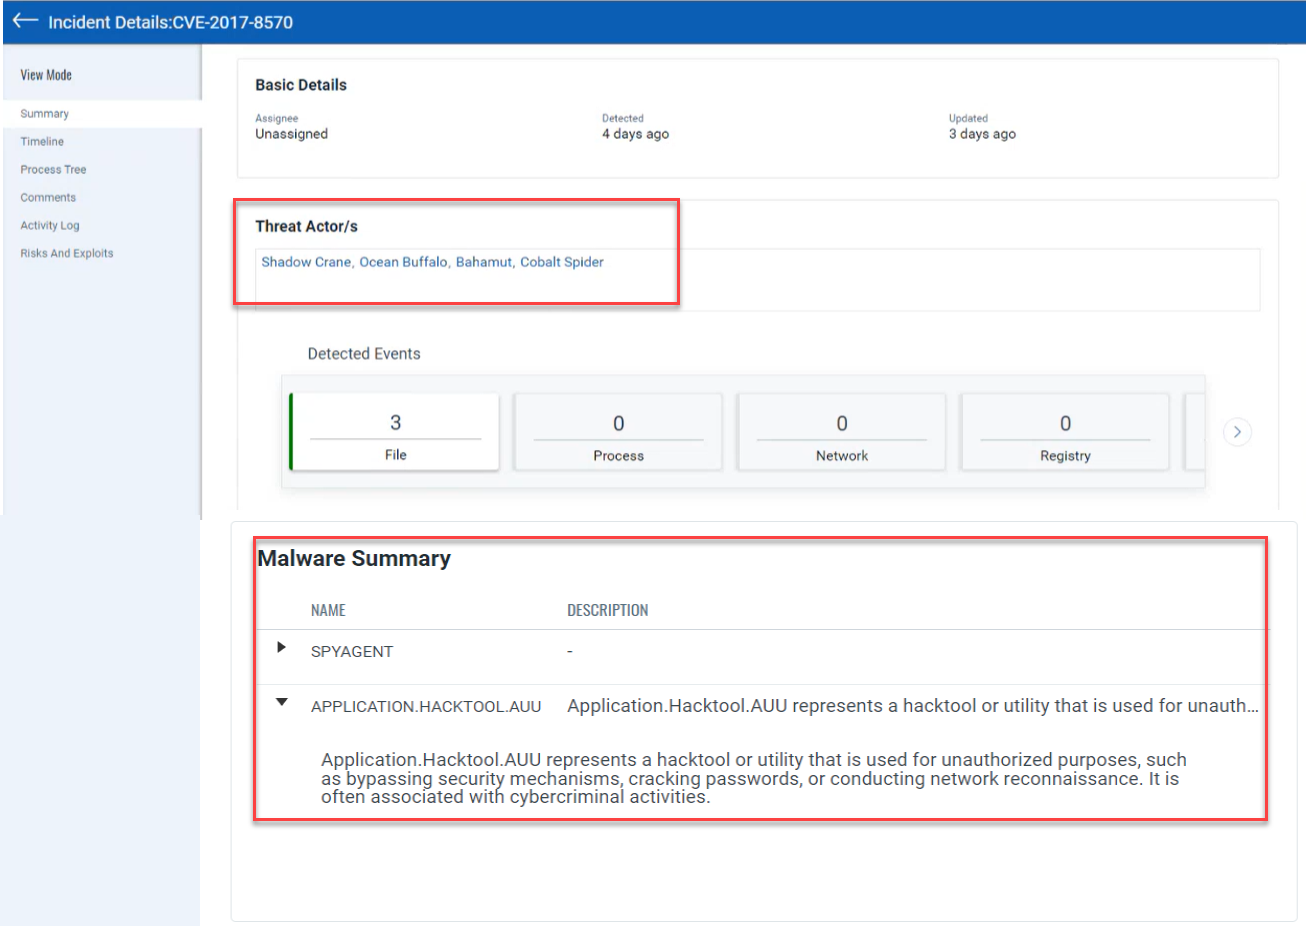
- Threat Actors: As the name suggests, Threat Actor(s) can be an individual or a group of attackers trying to infect your network. If such actor(s) attempt to perform a malicious activity in the network, you can get the list of these actor(s) in the Threat Actor(s) section of the Summary page. If Threat Actor(s) does not exist for the event severity score displayed in the Summary, the Threat Actor(s) is not listed.
All the Threat Actor(s) are listed in the Event Details of the Timeline section, irrespective of the event severity score.
- Malware Summary: The Malware Summary lists the malware name and its description for the malicious events that occurred.
The following screenshot is an example that lists the Threat Actor(s) and Malware Summary of an event:
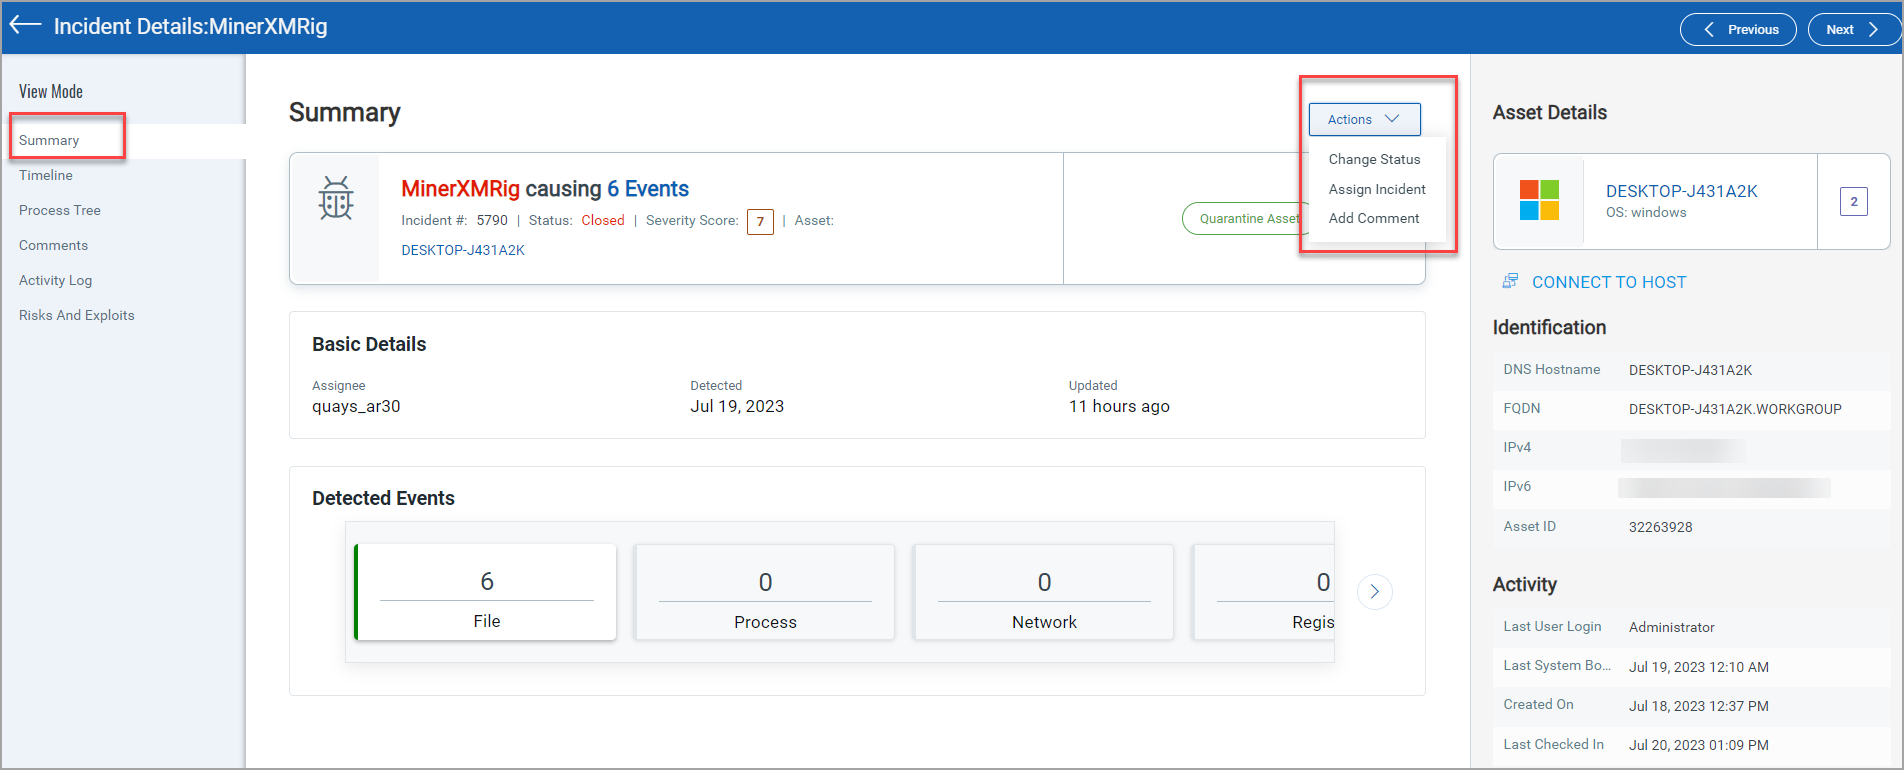
Actions
You can perform actions such as Change Status, Assign Incident, or Add Comment from the Actions menu. Using the Add Comment option, you can provide comments about the incident. Only the writer of the comment can edit or delete their comment.
The following screenshot is an example of the Incident Summary and Actions:
Timeline
The Timeline section provides the list of the detected events. Alternatively, you can search for the detected events from the Search for events search bar using the Events Search Token and choose a remediation action if applicable. You can enhance the search results by selecting the timeframe from the Last 2 years to Today.
To view and remediate unaddressed high-severity events associated with the incident, toggle the Show Non-Remediated (Score > 3) option. All events with a severity score above 3 will be listed below.
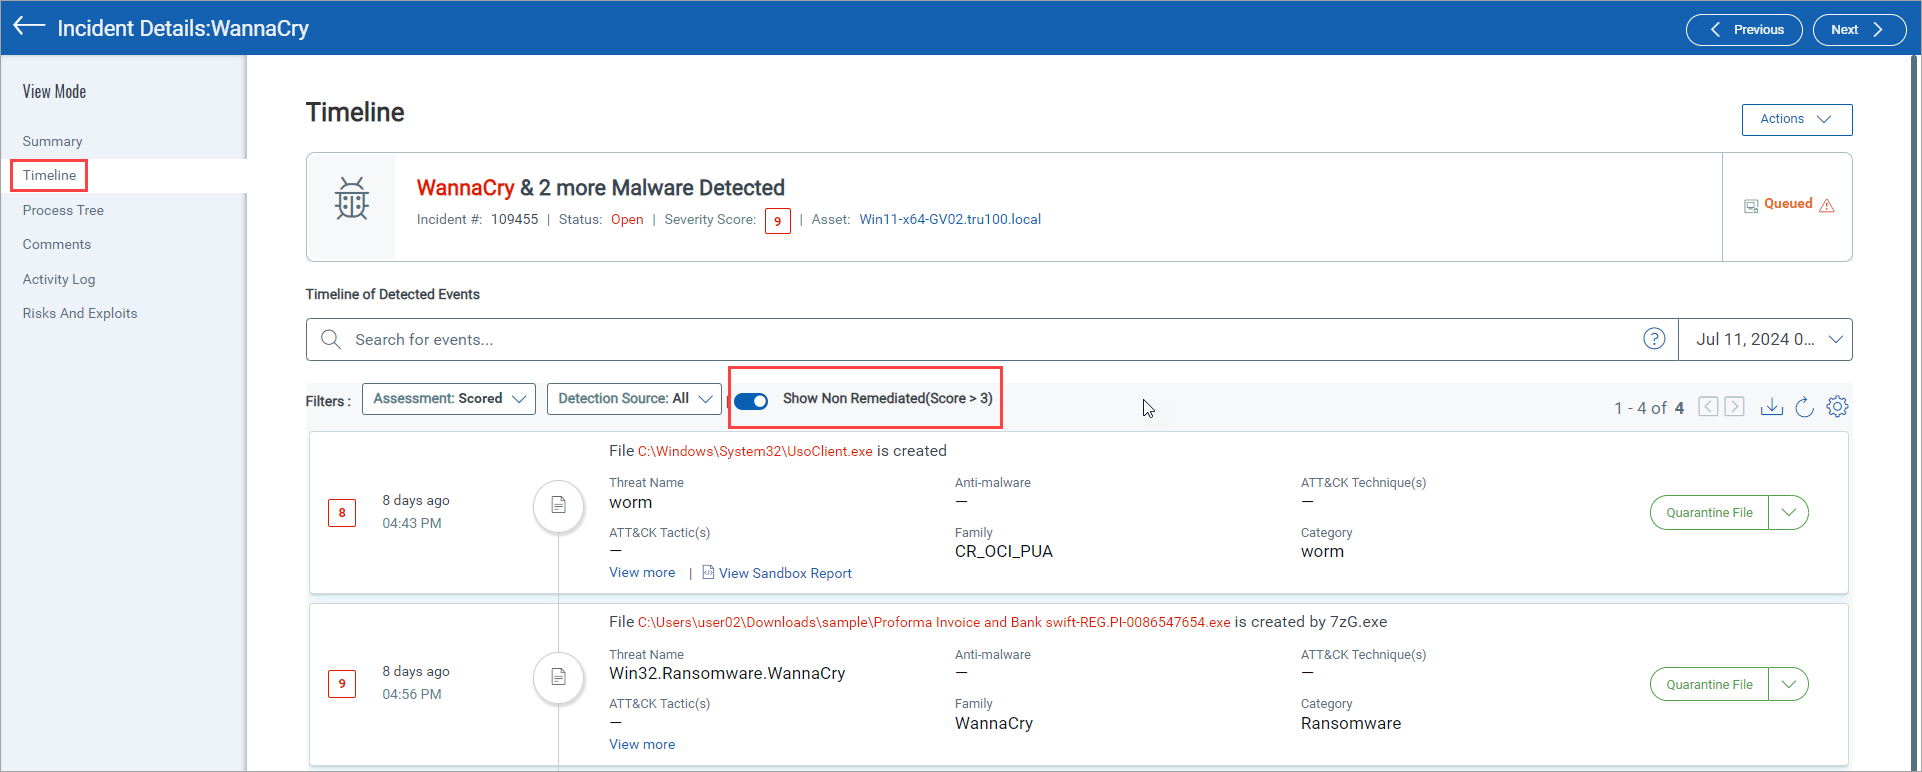
Assessment and Detection Source filters in the Timeline section display the list of events based on the selected options.
- Assessment: The Scored and Not Scored fields in the Assessment filter lists the events based on the severity score.
- Scored: Scored lists the events with the Severity Score from 1 to 10.
- Not Scored: Not Scored lists the events with a Severity Score 0.
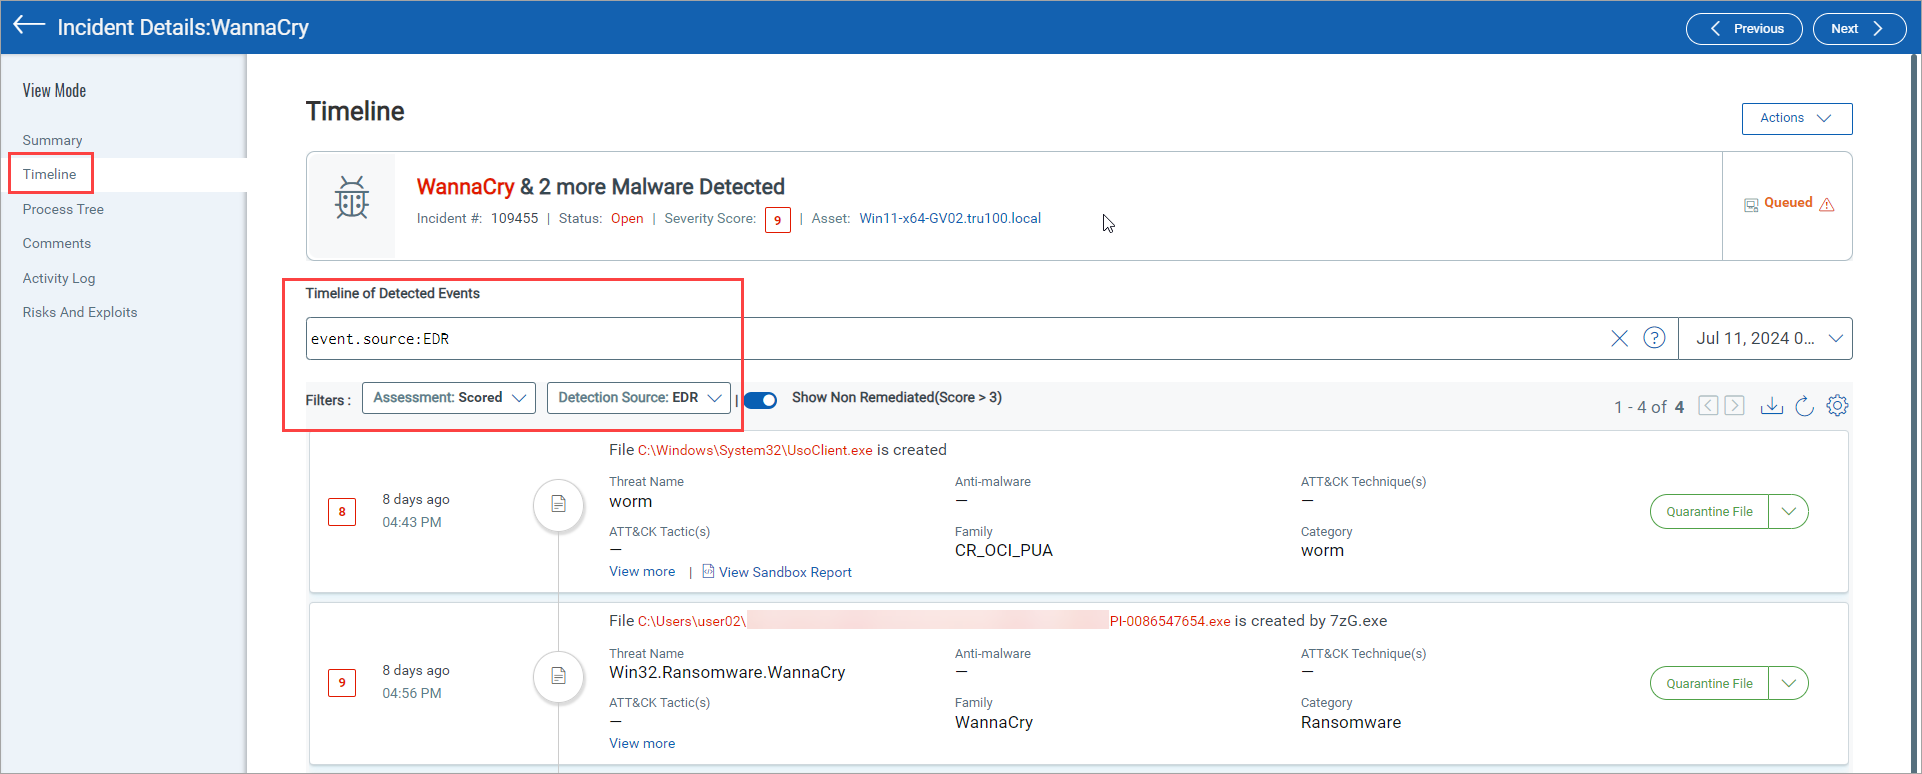
- Detection Source: You can select the threat source from the Detection Source filter as Anti-malware, Behavioral Detection, or Threat Intel.
You can select multiple threat sources using the Detection Source filter.
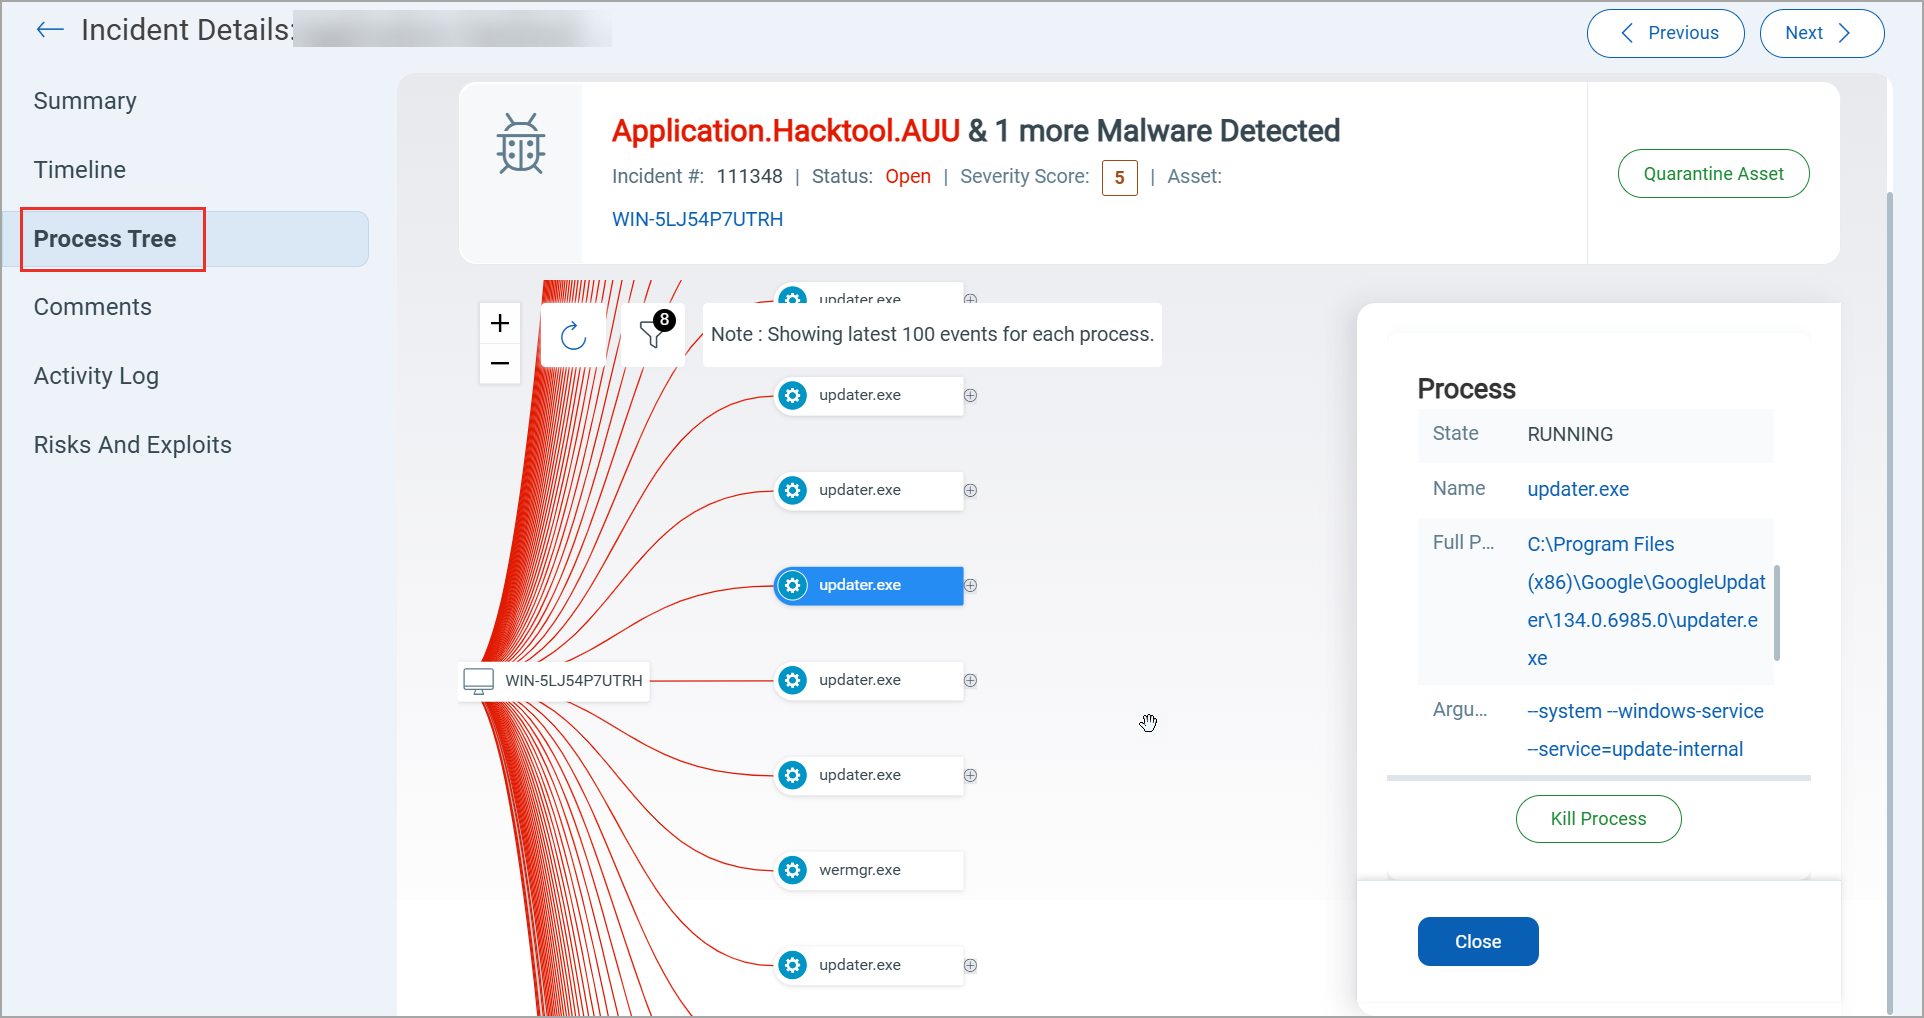
Process Tree
You can perform the remediate action from the Process Tree section. The process tree displays all the related events of the selected incident. An event of the “Process” type will show its parent and child processes.
In the process tree view, you can traverse between the nodes by clicking a node in the hierarchy. You can click the (+) and (-) to expand and collapse the tree nodes and display the related events.
In the Threat details section, you can view the detection engine (Malware Detection, Yara rules (if enabled), Behavioral Analysis, Threat Intelligence, etc.) for the event and the event risk score. The Process Tree view displays a zoom bar and reset option. The filter can view a specific event type in the process tree. The Process event will always be visible.
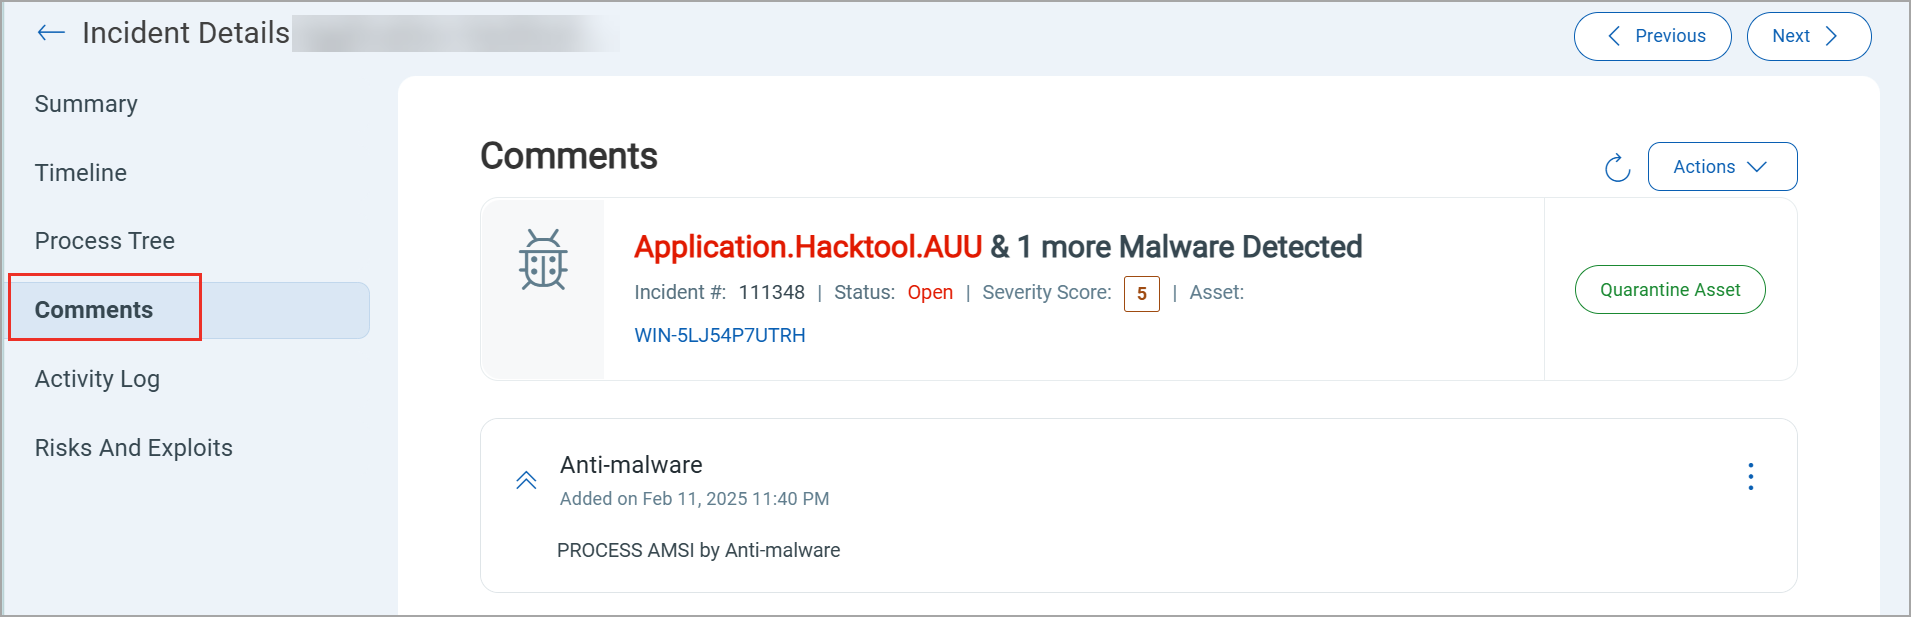
Comments
The comments you add using the Actions menu are listed in the Comments section. For Antimalware Assignee, with the closed Status, by default, the comment displayed is based on the action performed.
For example, in the following screenshot, the network has been closed. Hence, the comment displayed is Network Closed.
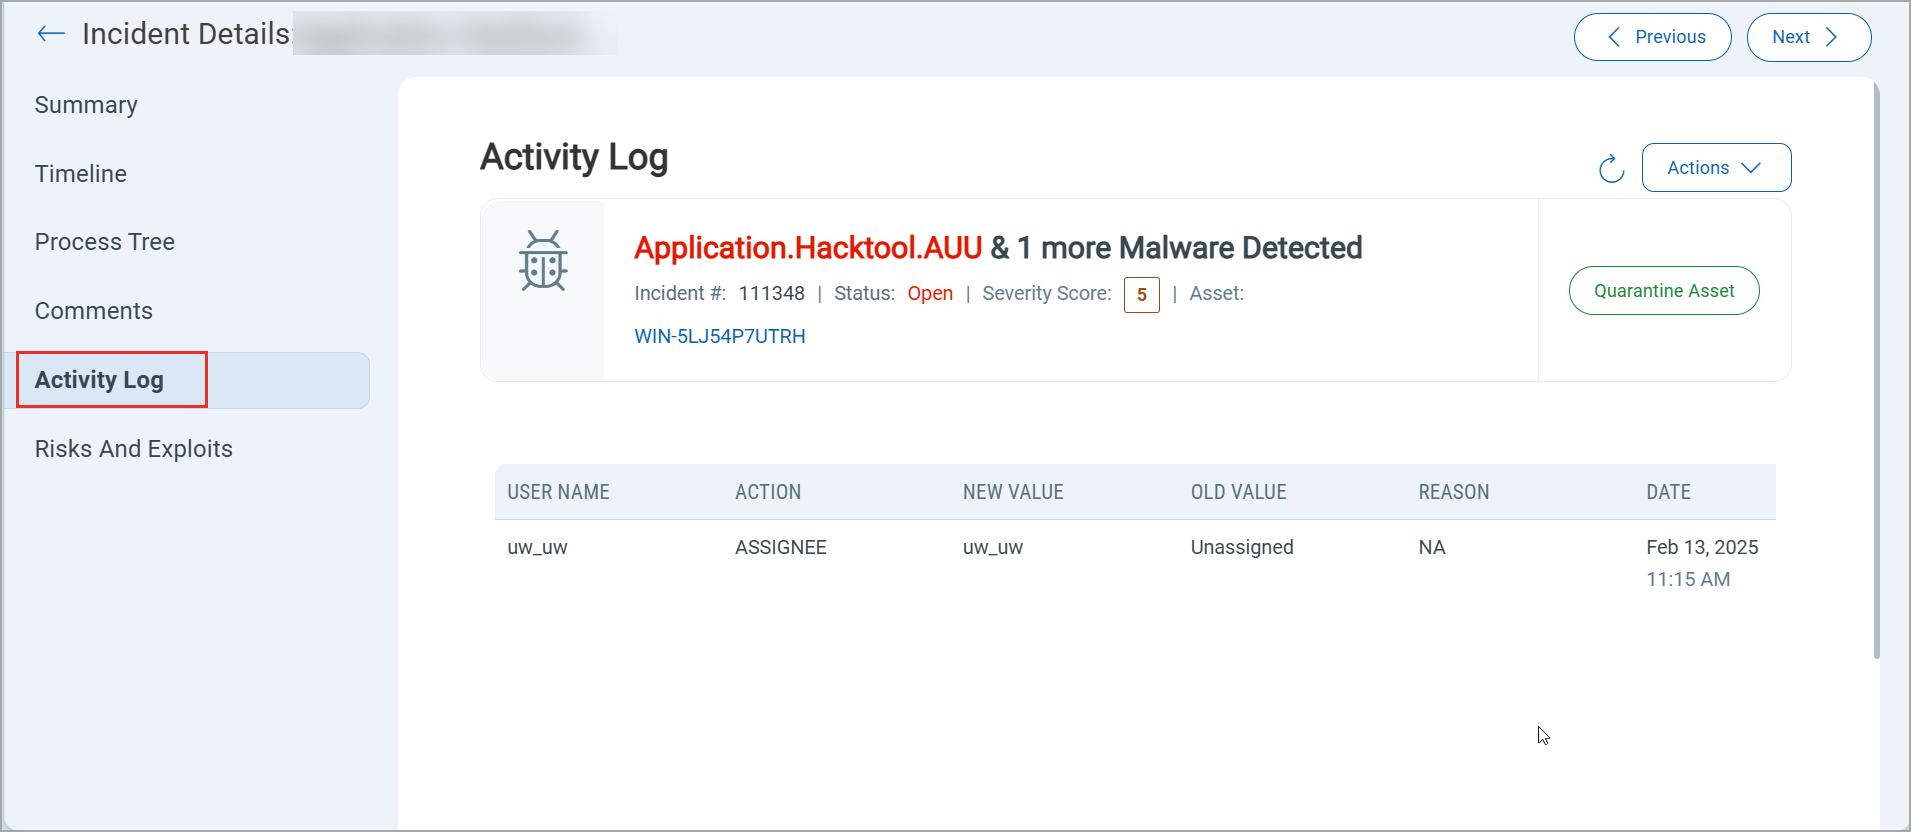
Activity Log
The Activity Log logs all the actions you perform on the Incident page. The following screenshot is an example of the Activity Log:
Risks and Exploits
The Risks and Exploits section focuses on the data generated via the integration with Qualys Vulnerability Management Detection and Response (VMDR) and Qualys Policy Audit (PA) applications. The Patch Management (PM) integration helps you to patch vulnerabilities.
Prerequisites
- VMDR subscription for Threat Risk & Exposure
- PM subscription to patch vulnerabilities
- PA subscription for System Misconfiguration
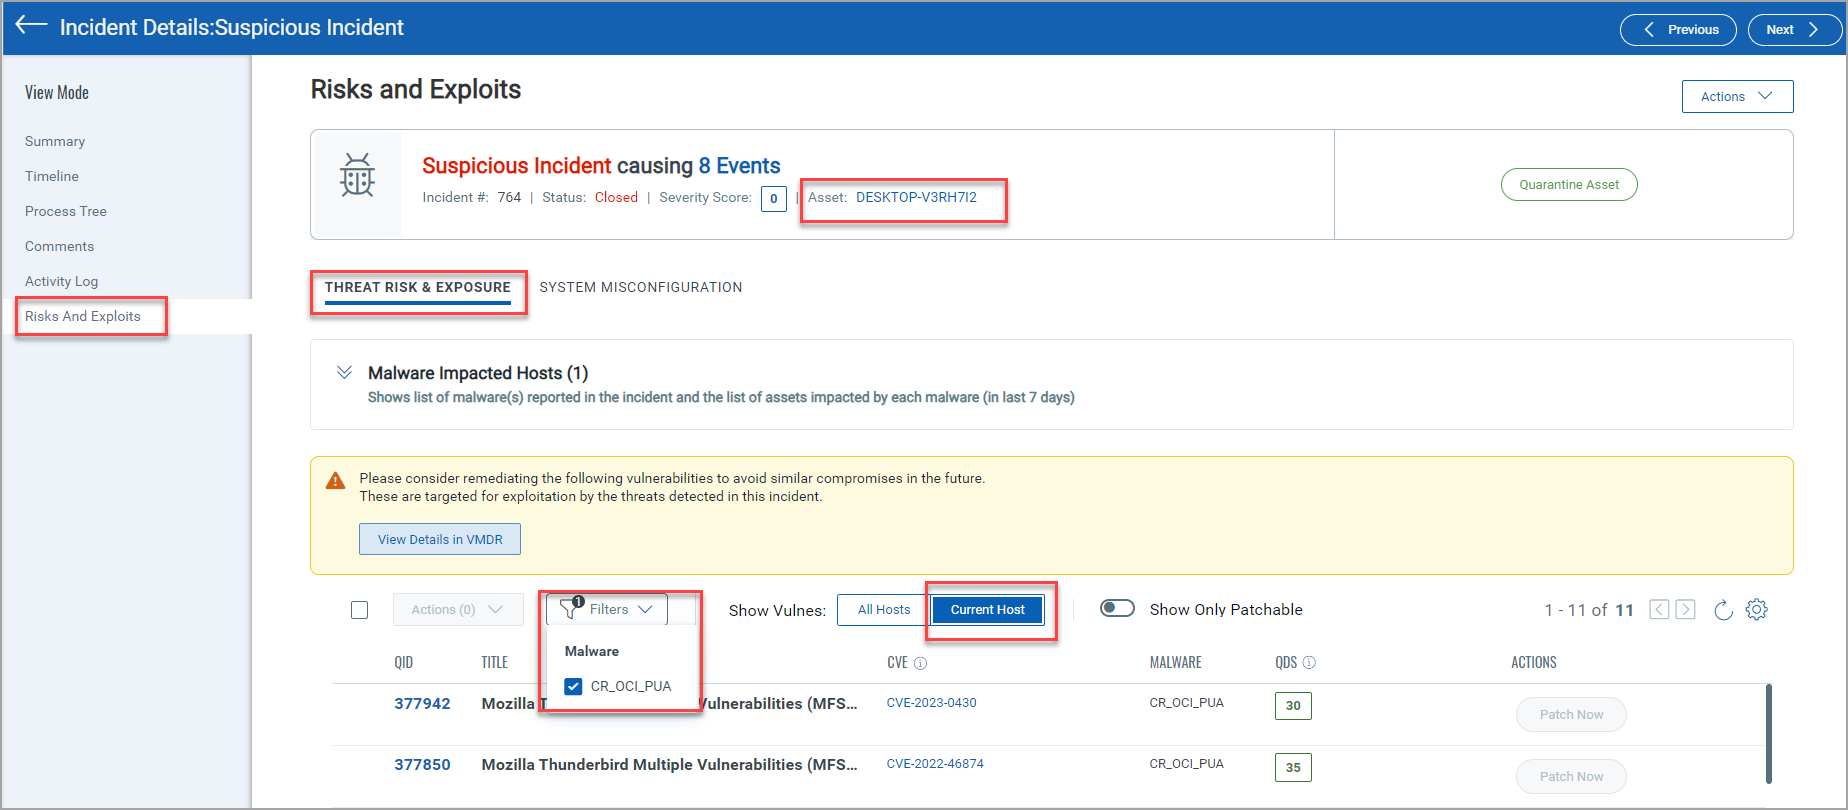
Threat Risk & Exposure - Integration with Qualys VMDR
The Threat Risk & Exposure section lists the vulnerabilities linked to an incident along with the option to patch those vulnerabilities. The integration with VMDR helps you remediate endpoints based on the QID, Title, CVE, Malware, and QDS. When a Patch is available for a vulnerability, the Patch Now option is enabled. You can view the Vulnerabilities by selecting the Malware from the Filters drop-down, or by selecting the type of Host- All Hosts and Current Host.
- All Hosts- Select this option to get the list of vulnerabilities that have impacted all the hosts. The Total Hosts column lists the hosts impacted by the vulnerability. The following screenshot is an example of the All Hosts selection:

- Current Host- Select this option to get the list of vulnerabilities that have impacted the host for which you are viewing its Incident Details.
In the following screenshot, the vulnerabilities listed are for the Current Host, in this case- Desktop-v3RH712:
How do I get more insights about Risks and Exploits using VMDR?
- Click View Details in VMDR. You will be redirected to the Vulnerabilities tab of the VMDR application.
- In the Vulnerabilities tab, the vulnerabilities are listed based on the CVE IDs. The Vulnerability token enlisted is `vulnerabilities.vulnerability.cveIDs:[CVE ID number]`. Click on any of the QID to get insights of the Vulnerability.
How can I patch the vulnerability detected in EDR using the Patch Now option?
If you have Patch Management subscription, the Patch Now option will be enabled for you.
- Click Patch Now. You are redirected to the Jobs tab of the Patch Management application.
- In the Basic Information section, the Job title is pre-populated.
- In the Select Assets section, the assets are populated based on the asset tags selected. You can add or exclude asset tags for the job.
- In the Select Patches page, select the type of patch you want to install. The patches are pre-populated; if required, you can select more patches.
- Provide information for the remaining fields and click Save and Enable.
For more information, see Creating Patch Job for Windows Assets.
System Misconfiguration - Integration with Qualys Policy Audit
The System Misconfiguration section lists the CIDs, Control Statement, Technology/Instance, MITRE Technique ID and Policy that failed the Qualys Policy Audit assessment due to endpoint misconfiguration. To get complete summary of a CID, click any of the CID and you are redirected to the Posture Details page of PAapplication. Using the Remediate now option you can remediate a Control Statement.
The following screenshot is an example of the System Misconfiguration page:
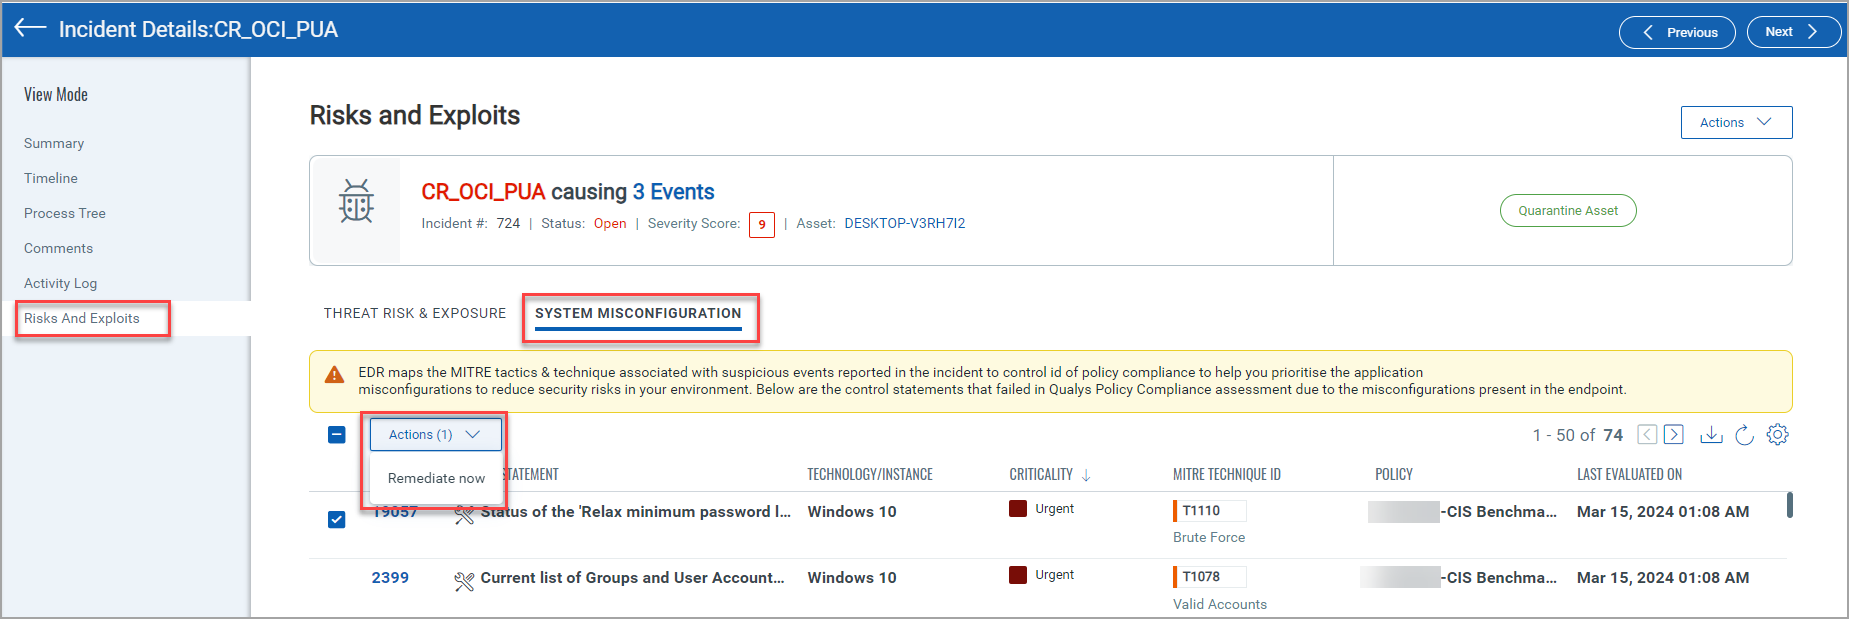
How can I use the Remediate now option?
- From the System Misconfiguration section, select the CID you want to Remediate. The
 icon represents the CID is remediable.
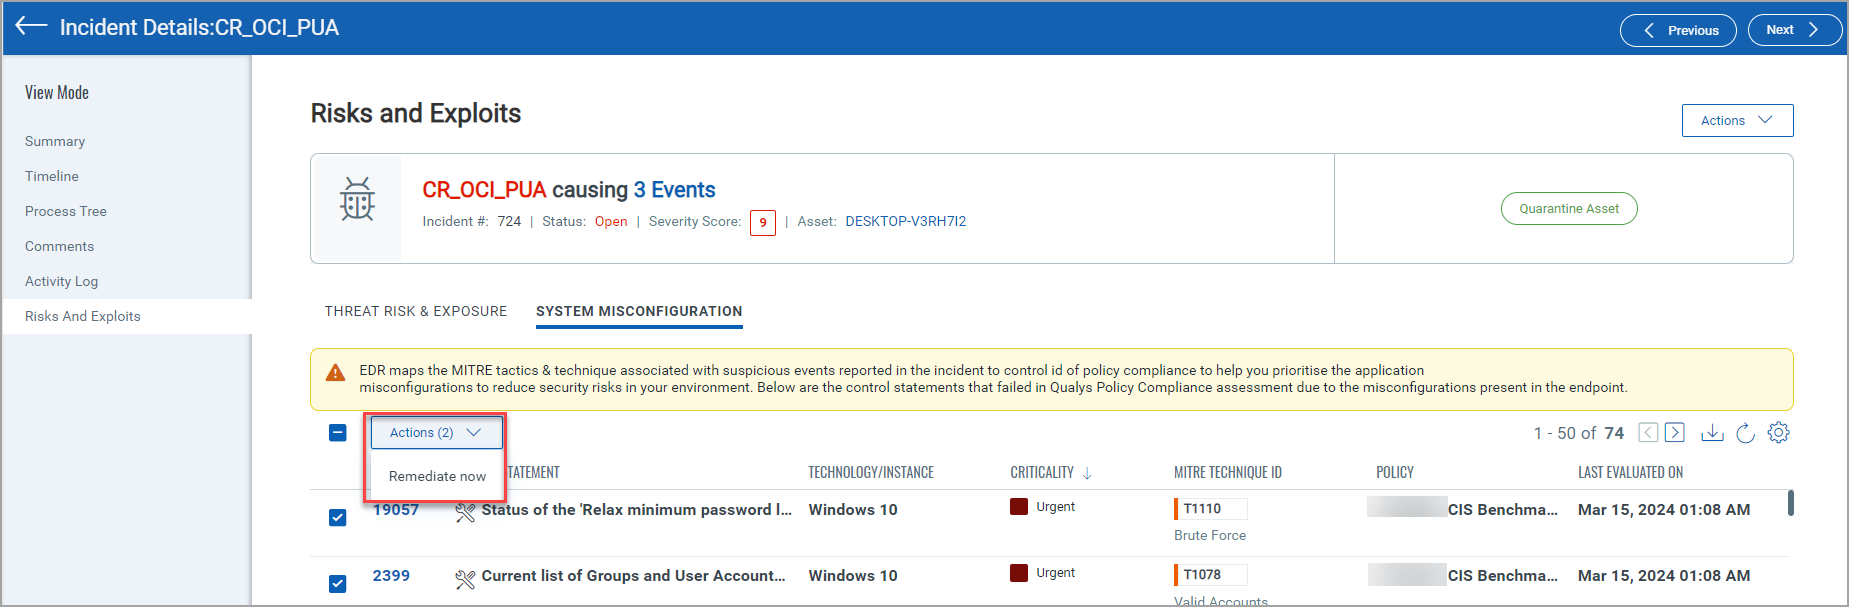
You can select bulk CIDs for remediation.
- From the Actions drop-down, select Remediate now.
The following screenshot is an example of the Remediate now option in the System Misconfiguration section of EDR application:
-
You are redirected to the Posture tab of the PA application. Click Remediate Now from the PA application or you can perform other actions from its Quick Actions menu.
For more information about the Posture in PA application, refer Know Your Compliance Posture. The following screenshot is an example of the Posture tab in the PA application:

Additional Resource
- MITRE ATT&CK webpage