Monitor Active Directory Events
This section provides details on identifying, monitoring, and analyzing events in your Active Directory infrastructure.
The Events provides comprehensive visibility into directory activities and user actions. This tab captures and organizes critical security events across your identity systems, enabling you to detect anomalies, investigate incidents, and maintain audit compliance.
Prerequisite: Availability of AD Real-Time Monitoring is dependent on Qualys Cloud Agent version 6.6.0+
What is an Event?
An event is a recorded action or activity that occurs within your Active Directory environment. Each event in this tab captures:
- User actions, including logons, logoffs, and access requests
- Service activities such as Kerberos ticket requests and service operations
- Privilege changes and special access assignments
- Timestamp information for precise audit trails
- Source host and domain information for complete context
Unlike security alerts that identify threats, events are raw directory activities that provide the foundation for security analysis and forensic investigations.
Event Categories
Events are organized into several categories to help you filter and analyze specific types of activities:
- Logon/Logoff: User authentication events, successful and failed logon attempts
- Account Logon: Service account activities and system authentication events
- Policy Change: Modifications to security policies and group policies
- DS Access: Directory service access and modifications to directory objects
- Other System Events: General system and application events
Events Findings
To view the events detected on your monitored systems, navigate to the Monitoring > Events page. You can also use various filters, group-by options, and search capabilities.
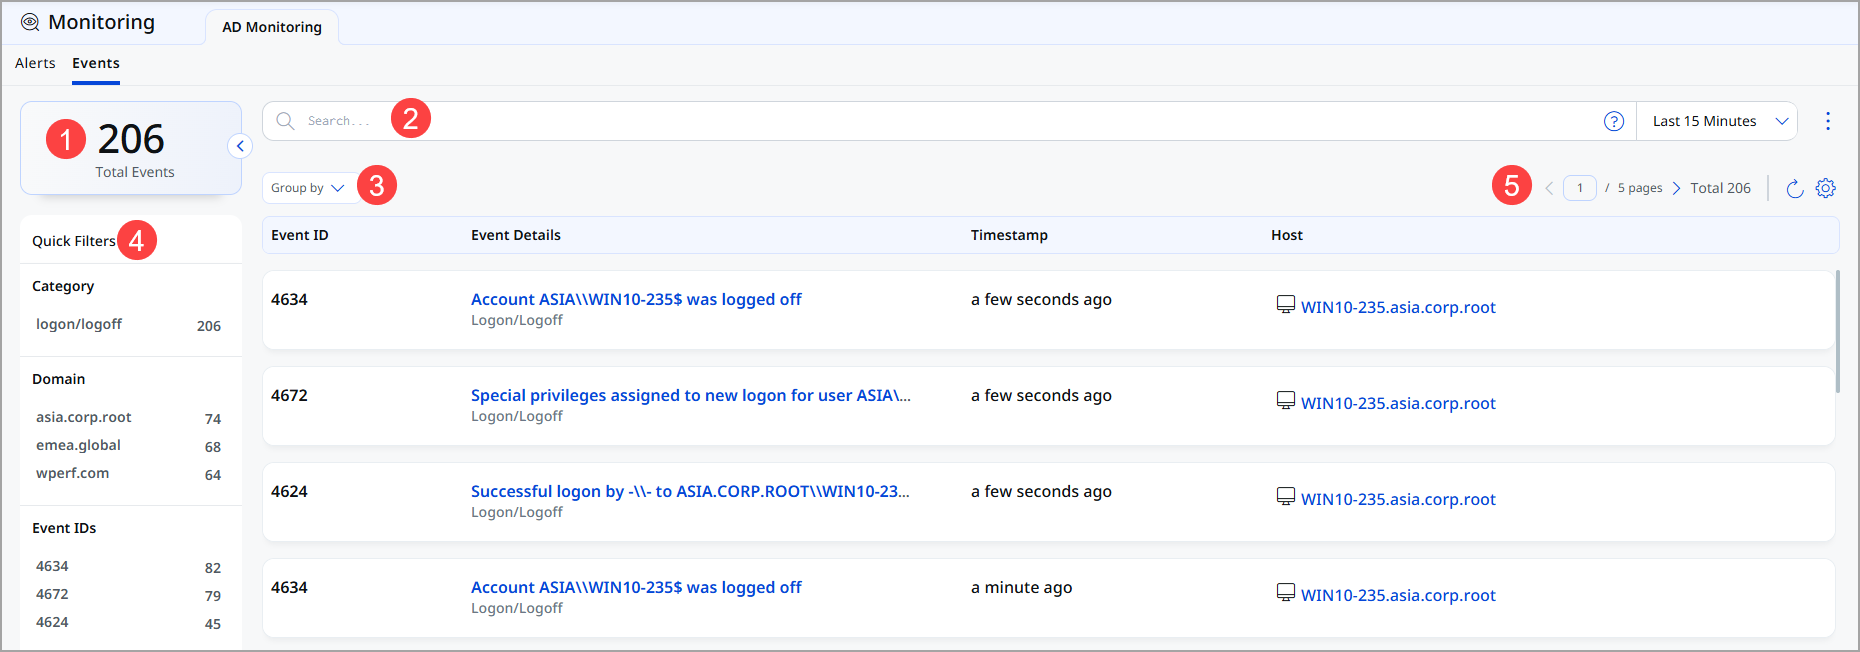
The Events listing page highlights the following key elements:
- Total Events Counter: Displays the total number of events available in the current time period (for example, 206 events).
- Search Bar: Allows you to search for specific events using tokens based on event IDs, domains, categories, host names, and many more.
- Group By Option: Helps you organize events by Source IP, logon type, Target domain and many more. Click any value in the results to drill down and view related events.
- Quick Filters: Located in the left sidebar, these filters allow you to quickly narrow down events by category (Logon/Logoff, Policy Change, Account Logon, DS Access, and many more), Domain , and Event ID's
- Pagination Controls: Navigate through pages of events and adjust the time range (For example, Last 15 Minutes) to focus on recent or historical data.
The Events table displays the following columns:
- Event ID: A unique identifier for each event (For example, 4634, 4672, 4624). Event IDs correspond to Windows Event Log event numbers.
- Event Details: A description of the event, including the action performed and the category. Click the event details to view full information.
- Timestamp: The date and time when the event occurred (For example, 'a few seconds ago').
- Host: The computer or domain where the event originated (For example, WIN10-235.asia.corp.root).
View Event Details
Click any event in the listing to open the Event Details panel. The details are organized into three tabs: Overview, Event Data, and Raw JSON tabs.
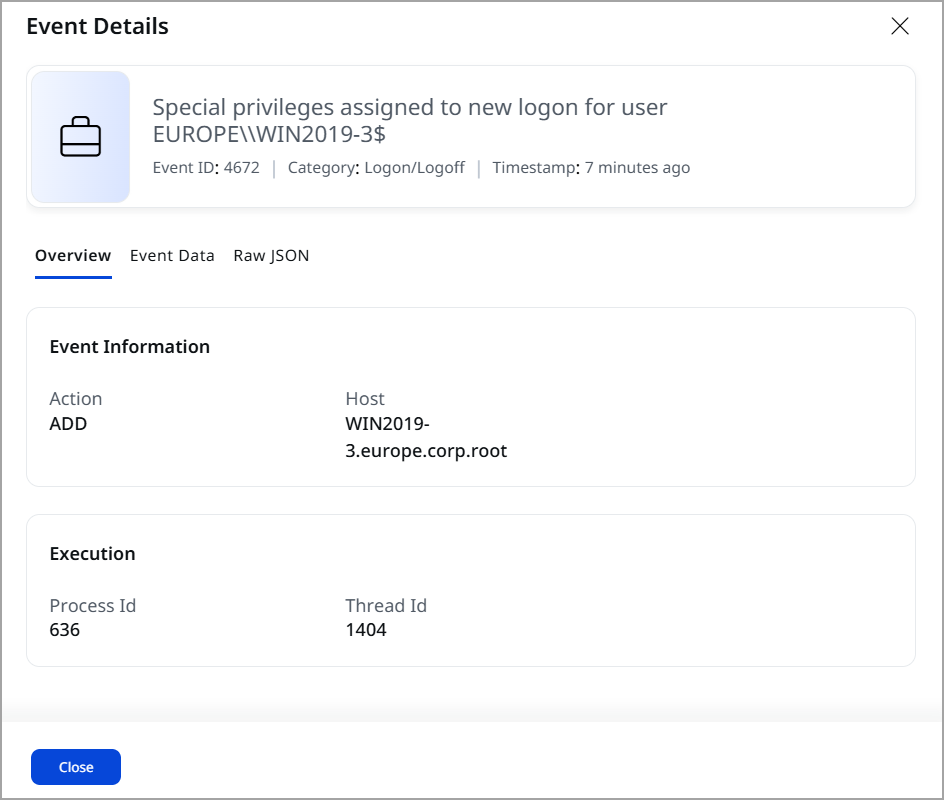
Overview Tab
The Overview tab displays:
- Event Header: Shows the event ID, category, and timestamp
- Event Information: Displays the action performed and the host where the event occurred
- Execution Details: Shows the process ID and thread ID for the event
Event Data Tab
The Event Data tab provides detailed field information:
- User Name: The account name under which the event was generated.
- Domain Name: The domain associated with the user account.
- Subject User SID: The Security Identifier (SID) of the account performing the action.
- Subject SID: The SID, along with the friendly name of the actor account.
- Subject Logon ID: A unique identifier for the logon session of the user.
- Privilege List: The list of system privileges assigned or used during the event.
Raw JSON Tab
The Raw JSON tab shows the complete event data in JSON format. This section provides the detailed, structured event data in its original JSON format, enabling advanced users to validate, troubleshoot, and perform in‑depth analysis of security events beyond the summarized view.
Best Practices
Follow these best practices when working with events:
- Regular Monitoring: Review events at least daily, and more frequently for critical systems
- Timestamp Validation: Always check event timestamps to establish accurate timelines during investigations
- Category Filtering: Use event categories to focus on the most relevant activities for your analysis
- Documentation: Keep records of significant events and investigations for compliance and audit trails
- Correlation: Look for patterns across multiple events to identify attack chains or suspicious behavior
- Automation: Export event data in JSON format for use in security orchestration and automated response (SOAR) platforms
- Retention: Maintain event logs according to regulatory and organizational requirements
- Active Directory events are critical for compliance and forensics. Ensure that:
- Events are retained for 7 days.
- Critical events (failed logons, privilege escalations) are retained for extended periods
- Event data is exported to secure storage systems for long-term archival
- JSON export functionality is used for integration with security platforms and SIEM systems