Active Directory Assets
The AD Assets tab provides a centralized view of assets discovered and inventoried across your environment. From this page, you can browse, filter, and manage assets using available quick actions and bulk actions.
You can view asset details such as operating system, hardware, risk posture, and discovery sources. The asset inventory is continuously updated using data from multiple sources such as agents, scanners, and integrations, ensuring comprehensive visibility.
View AD Assets
To view the AD assets, navigate to the Risk Inventory > Ad Assets. You can also use various metadata filters, group-by options, and custom query capabilities.
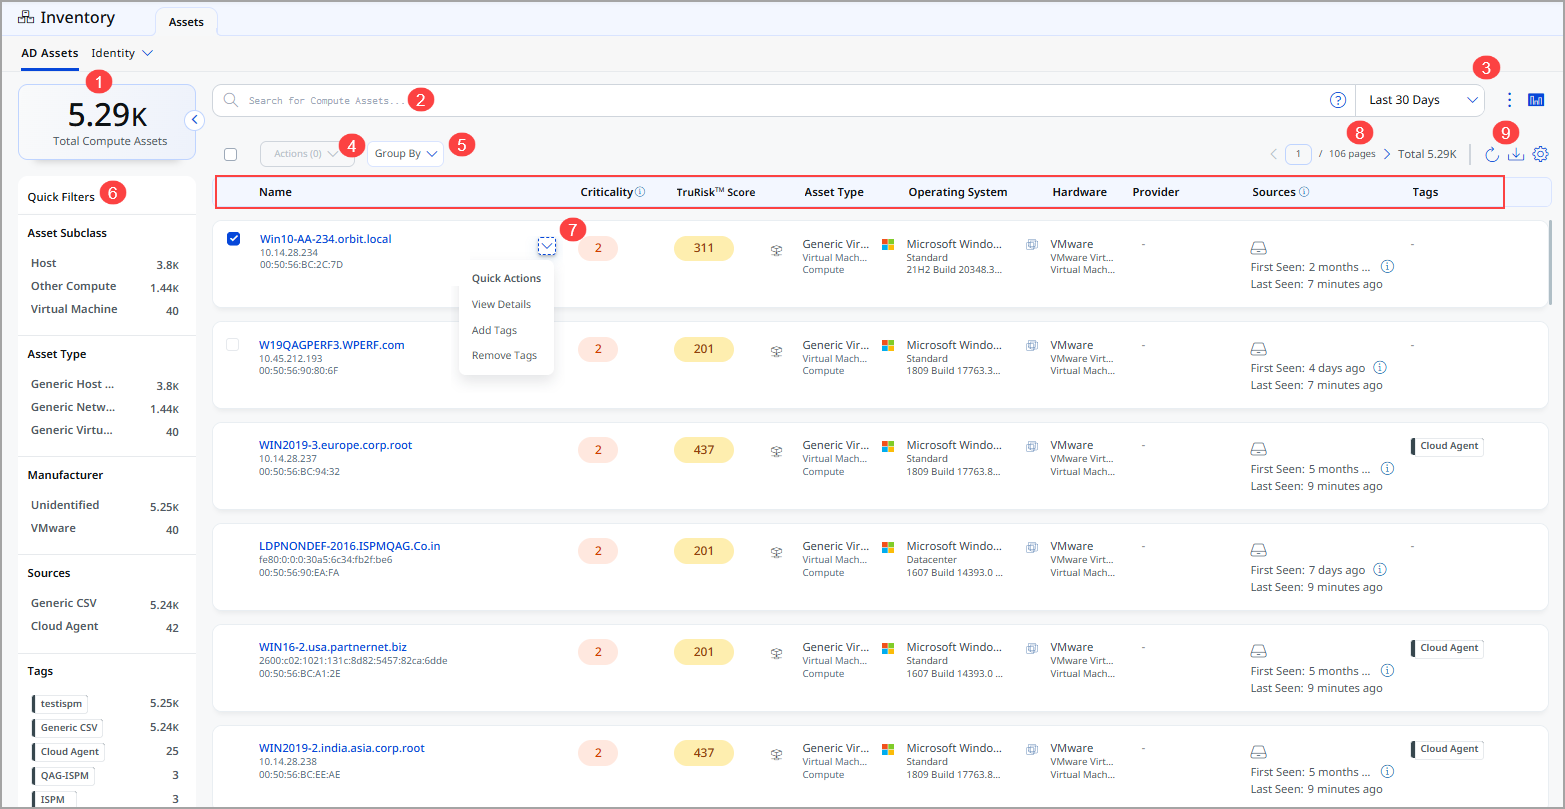
- Total Compute Assets: Displays the total number of compute assets discovered in the environment.
- Search for assets: You can search for assets using a Qualys Query Language (QQL) query for a specific time frame.
- Time Range Filter: Allows you to filter and view assets based on a selected time period (for example, Today, Last 7 Days, Last 30 Days, or a custom range).
- Actions menu: Enables bulk actions on selected assets.
- Group By: Allows grouping of assets based on selected attributes.
- Quick Filters: You can view the total assets matching your search criteria and the asset manufacturer and asset tags with their count of assets from the left pane. Click the count of assets to view the list of assets.
- Quick Action menu: You can perform multiple actions, such as viewing asset details, adding or removing tags to the asset from the Quick Actions menu.
- Pagination Controls: Navigates through asset pages and shows total count.
- Settings and Export Options: Provides options for export, refresh, and configuration.
The following is the asset data listed on the AD Assets page:
| Column | Description |
|---|---|
| Name | Name of an asset. |
| Criticality: | You can see the asset criticality score for the assets. |
| TruRisk Score | You can see the TruRisk™ Score of the asset. The TruRisk™ score enables you to prioritize vulnerabilities, assets, and groups of assets based on the actual risk they pose to the organization. |
| Asset Type | Displays the type of the asset (for example, host, compute, or virtual machine). |
| Operating System | Displays the operating system running on the compute asset. |
| Hardware | Displays the detected hardware category. |
| Provider | Displays the cloud or infrastructure provider. |
| Sources | Displays discovery sources along with their first-seen and last-seen timestamps. |
| Tags | Displays tags associated with the compute asset. |
View AD Asset Details
The Asset Details page provides a comprehensive view of an individual compute asset discovered in your environment. This page brings together identity, system, network, security, and activity information to help you understand the asset’s configuration, usage, and risk posture in one place.
You can access this page by selecting a compute asset from Inventory > AD Assets > click the selected asset.
You can expand the Inventory, Security, Compliance and Sources sections from the left pane and see various tabs under each section. To know more about the details you can see from these tabs, refer to the following topics:
Inventory Section Details
Asset Inventory gives you visibility into the assets, granting you a detailed, multidimensional view of each one that encompasses its IT data. The following tabs are available under the Inventory section.
The following tabs are available under the Inventory section:
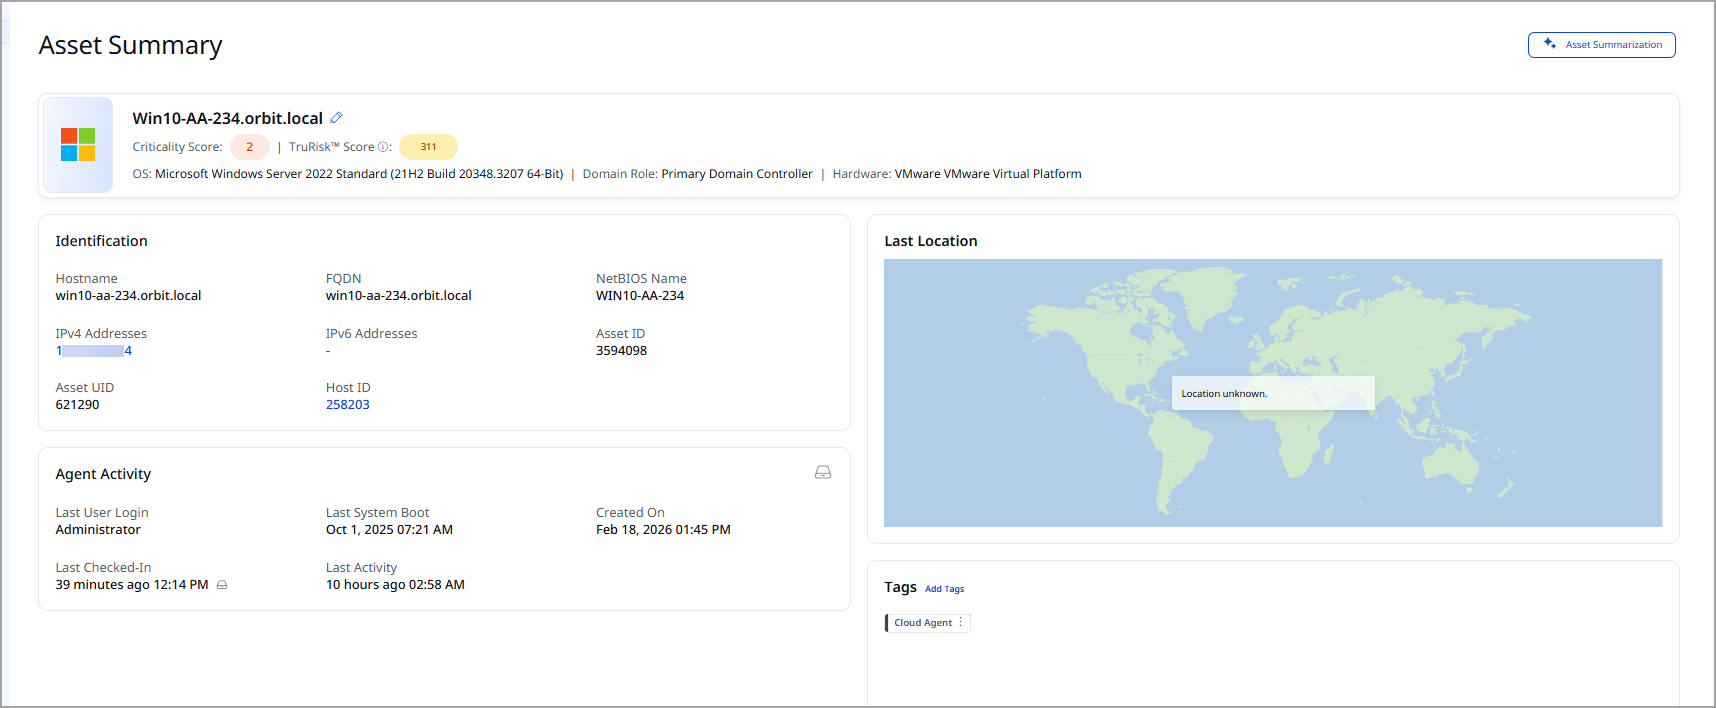
You can find the following details from the Asset Summary tab:
| Details | Description |
|---|---|
| Asset Summary | |
| Asset Name | The display name of the asset as detected from the source. |
| Criticality Score | The assigned criticality score of the asset. |
| TruRisk™ Score | The calculated risk score based on vulnerabilities and security posture. |
| OS | Identified operating system of the asset. |
| Hardware | The detected hardware vendor or platform. |
| Identification | |
| Hostname | The system hostname reported by the asset. |
| FQDN | The fully qualified domain name of the asset. |
| NetBIOS Name | The NetBIOS identifier used in Windows environments. |
| IPv4 Addresses | Public or private IPv4 address assigned to the asset. |
| IPv6 Addresses | Any IPv6 address associated with the asset. |
| Asset ID | Unique identification number of the asset assigned by Qualys. |
| Host ID | Unique identification number of the host. |
| Activity | |
| Last User Login | The most recent user login timestamp. |
| Last System Boot | The last time the system was restarted or booted. |
| Created On | The date and time the asset record was first created in the UAI inventory. |
| Last Updated | The most recent timestamp when the asset was updated. |
| Last Activity | The latest interaction or detected activity from the asset. |
| Tags | |
|
Tags assigned to the asset. You can remove tags from this section by choosing the Remove Tag option from the more options menu. You cannot remove dynamic and system-defined tags assigned to that asset. The Remove Tag option is shown only for static tags. When you click View to see the tag details, a Tag Details page opens, wherein you can see the tag details. When you click Ctrl+View, the Tag Details page opens in the next tab. |
|
| Last Location | |
| Geographical location derived from the asset’s IP or metadata. For more information, refer to Geolocation of Assets. | |
Geolocation of Assets
Qualys determines the geolocation of your assets based on their public IP addresses. Asset Geolocation is enabled by default for customers in the United States. When an asset has at least one valid public IP, its last known location appears on the world map in Asset Details > Asset Summary.
To identify a public IP for geolocation, Qualys evaluates the following sources:
- The asset’s network interfaces for any public IP address
- For agent-based assets, the public IP reported by the Cloud Agent
- For AWS EC2 assets, the instance’s assigned public IP
- For assets discovered via network scans, any public IP associated with the scanner used
- If no public IP is detected from any of these sources, the asset’s location is shown as Unknown.
If you want to enable or disable Asset Geolocation for your subscription, contact Qualys Support.
System InformationSystem Information
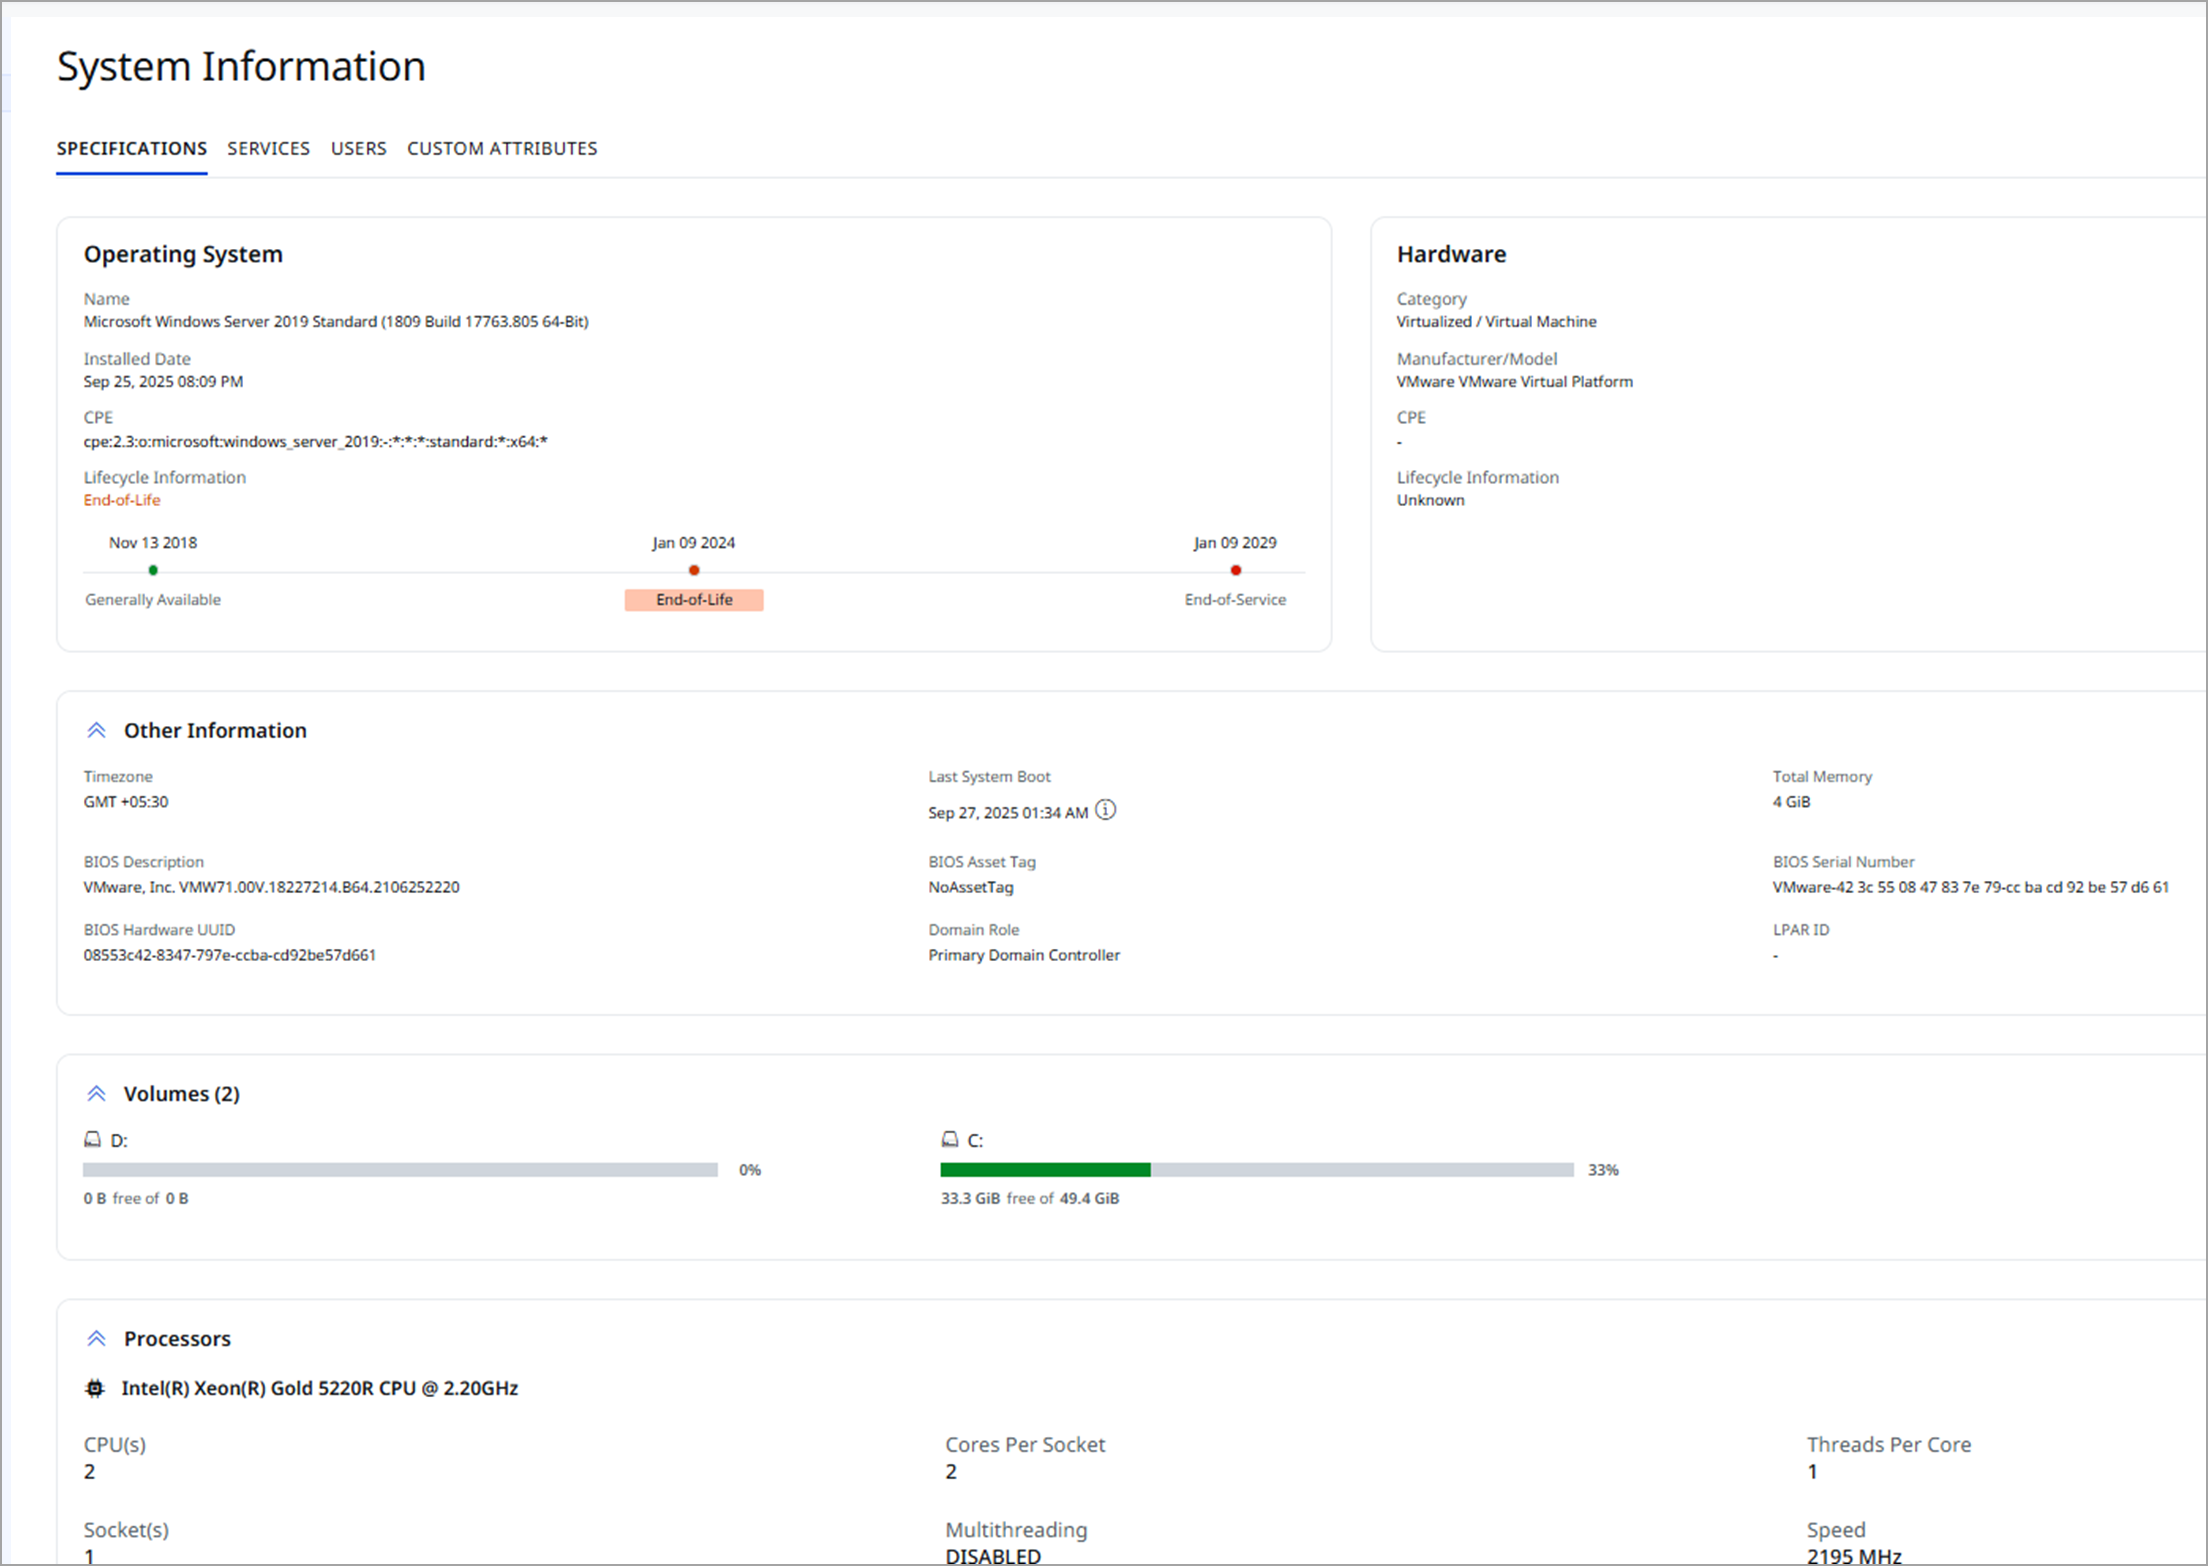
The System Information tab provides a comprehensive view of an asset’s technical profile, including operating system details, hardware specifications, volumes, processors, GPU information, services, users, and any custom attributes added for that asset.
This tab displays detailed information grouped into the following sections:
| Details | Description |
|---|---|
| Operating System | |
| Name | The detected operating system running on the asset. |
| Installed Date | The date when the operating system was installed on the asset. |
| CPE |
The Common Platform Enumeration (CPE) identifier for the OS. CPE values are shown for Operating System, Hardware, and Software when a matching entry exists in Qualys catalog. If no matching CPE is available, the CPE field remains blank. For Operating System and Software, if the current CPE is unavailable, previous and next best-match CPEs can be viewed via the information tooltip. |
| Lifecycle Information (OS) | Displays lifecycle details (for example, end-of-life) for the OS. Not shown if the OS version cannot be identified. |
| Hardware | |
| Category | The classification of the hardware, such as Virtual Machine, Physical Server, or Cloud Instance. |
| Manufacturer/Model | The detected hardware vendor and model. |
| CPE | The Common Platform Enumeration (CPE) identifier for the OS. |
| Lifecycle Information | Lifecycle details for the detected hardware model. Not applicable if the model cannot be determined. |
| Other Information | |
| Timezone | The system's configured timezone. |
| Last System Boot | The last recorded time the system was restarted. |
| Total Memory | The total physical memory installed on the asset. |
| BIOS Description | Information about the BIOS firmware running on the asset. |
| BIOS Asset Tag | The asset tag value embedded in the BIOS, typically used for inventory tracking. |
| BIOS Serial Number | The unique hardware serial number reported by the BIOS. |
| BIOS Hardware UUID | A unique hardware identifier assigned by the BIOS, used to track physical systems. |
| Domain Role | The system’s role within a domain (for example, workstation, domain controller). |
| LPAR ID | The Logical Partition ID for AIX systems, used to uniquely identify AIX assets. |
| Volumes | |
| Lists detected storage volumes such as disks or partitions. | |
| Processors | |
| Displays processor details such as CPU model, cores, and threads. | |
| GPU | |
| Lists GPU details for assets equipped for AI processing. Shows “–” when GPU data is not detected. | |
| Services | |
| Displays discovered running services on the asset. | |
| Users | |
| Lists local and domain users associated with the asset. | |
| Custom Attributes | |
| User-defined metadata (key-value pairs) added to classify or filter assets. For more information, refer to Custom Attributes. | |
Custom Attributes
You can add Custom Attributes to an asset to support filtering and metadata classification. Click Add Attributes to define a new attribute. Each attribute requires a Key and a Value.
You can assign up to 20 custom attributes per asset.
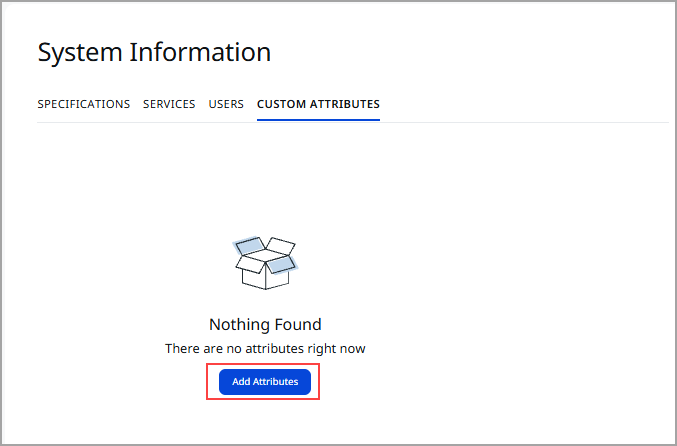
This feature is not available for users with a free CSAM subscription.
Confidence Levels for Unmanaged Assets
There is confidence associated with Hardware, and OS reported for unmanaged assets sensed by PS, as the PS fingerprints the asset based on the metadata it sees from the traffic copy fed to the NPS appliance, and does not actively query the asset. The operating system and hardware confidence details are displayed on the System Information page of the asset details, in the Operating System and Hardware sections.
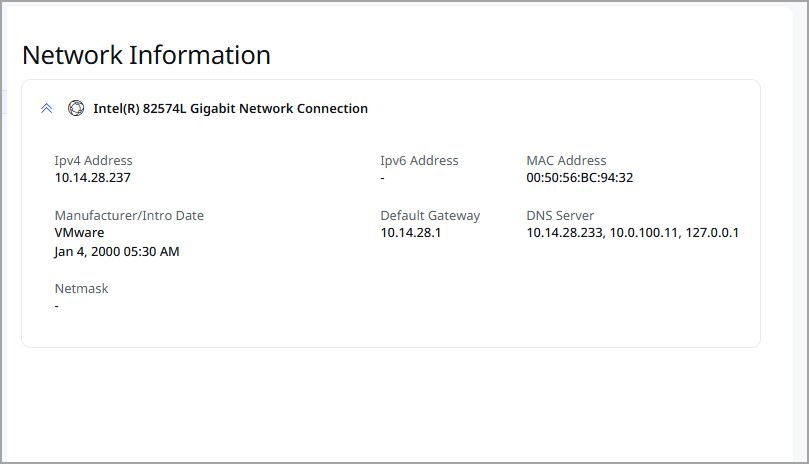
Network InformationNetwork Information
You can view the details, including information about the network connection to the asset, such as IPv4 and IPv6 addresses, MAC Address, Netmask, and Manufacturer/Introduction Date, in the Network Information tab.
| Data Point | Description |
|---|---|
| Interface Name | Network interface name. |
| IPv4 Address | The assigned IPv4 address of the asset used for network communication. |
| IPv6 Address | The assigned IPv6 address of the asset. |
| MAC Address | The MAC address of the network interface. |
| Manufacturer | The vendor that manufactured the network interface. |
| Intro Date | The date and time the manufacturer introduced this hardware model. |
| Netmask | The subnet mask associated with the IPv4 address. |
| Default Gateway | The IP address of the router that provides access outside the local network. |
| DNS Server | The DNS servers configured for name resolution. |
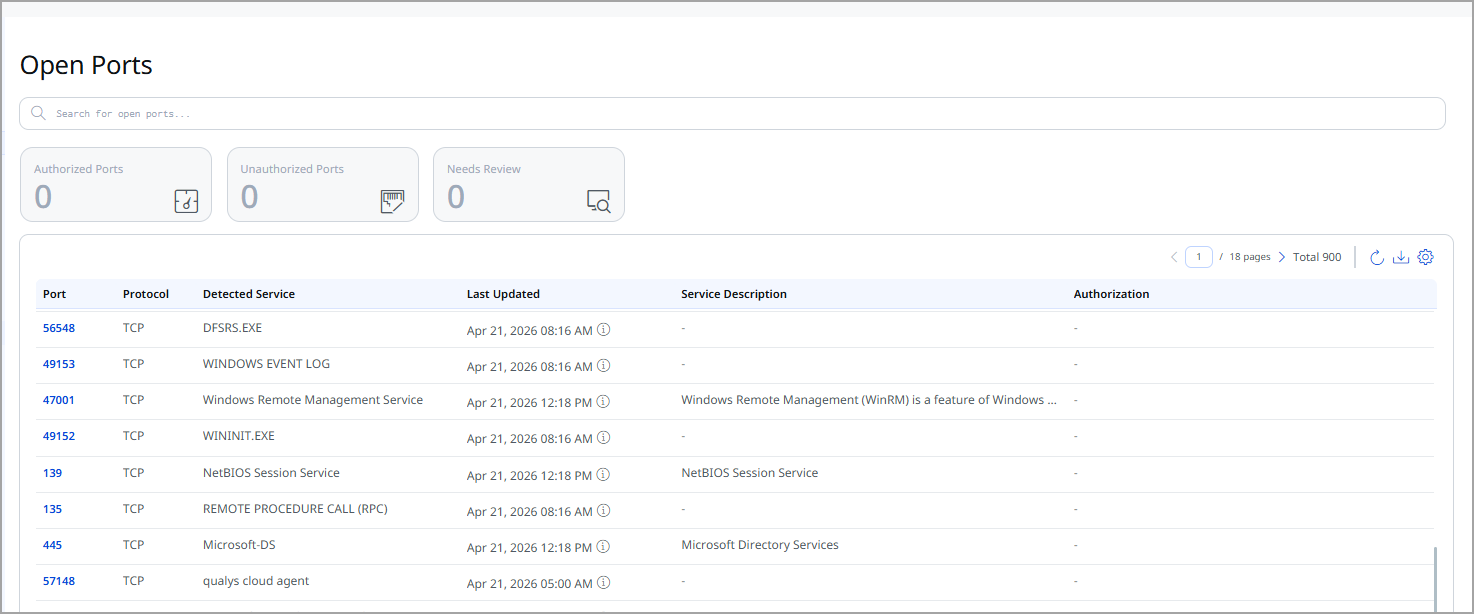
The Open Ports tab displays all network ports detected on the asset along with details about the services running on those ports. This information helps you assess exposure, identify unauthorized services, and track changes over time.
The system automatically classifies ports into three categories:
- Authorized Ports: Ports that have been marked as approved for use on the asset.
- Unauthorized Ports: Ports that are open but have not been approved and may require investigation.
- Needs Review: Ports that require additional validation before they can be classified as authorized or unauthorized.
The following port details are displayed:
| Column | Description |
|---|---|
| Port | The port number detected as open on the asset. |
| Protocol | The network protocol associated with the port (for example, TCP, UDP). |
| Detected Service | The identified service running on the port (for example, SSH, HTTP). |
| Last Updated | The date and time at which this port information was last updated. |
| Service Description | Additional context about the detected service, if available. |
| Authorization | Indicates whether the port is Authorized, Unauthorized, or Needs Review. |
You can export the port list using the Download option.
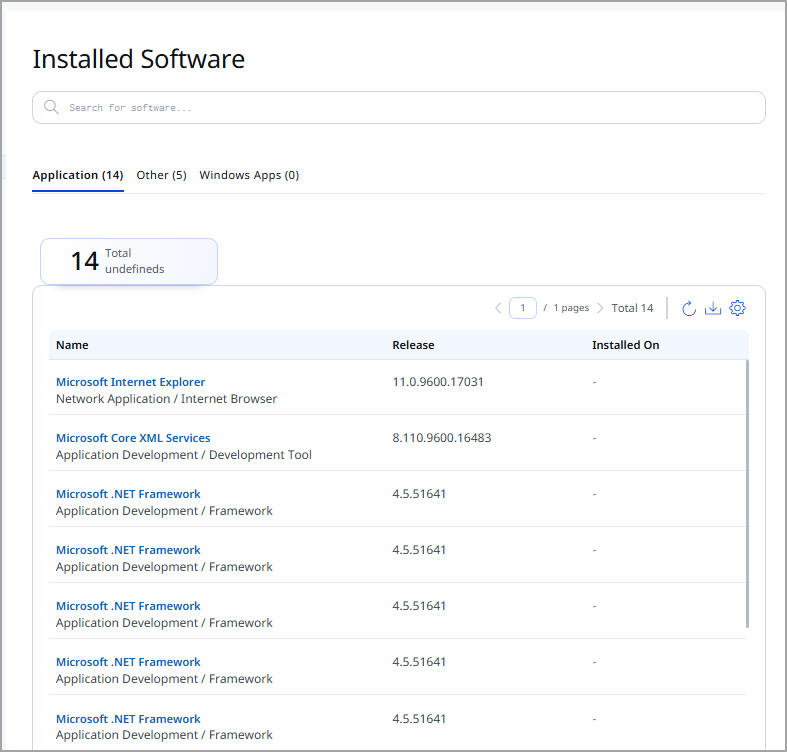
Installed SoftwareInstalled Software
The Installed Software tab provides a consolidated view of all software detected on an asset. This view helps you understand the software inventory, identify outdated or unsupported software.
The following software details are displayed:
| Detail | Description |
|---|---|
| EOL card | Displays the number of installed software entries that have reached End of Life (EOL). These software versions are no longer maintained by the vendor. |
| EOS card | Displays the number of installed software entries that have reached End of Support (EOS), indicating that vendor support has ended. |
| Name | Shows the software name along with its functional category (for example, Network Application / Internet Browser). You can click the name for more details. |
| Release | Displays the detected software version. If applicable, EOL or EOS dates are shown below the version. Hovering over the caution icon provides you with data such as the stage of the software, support, and GA, EOL, and EOS dates. |
| Installed On | Shows the software installation date, when available. |
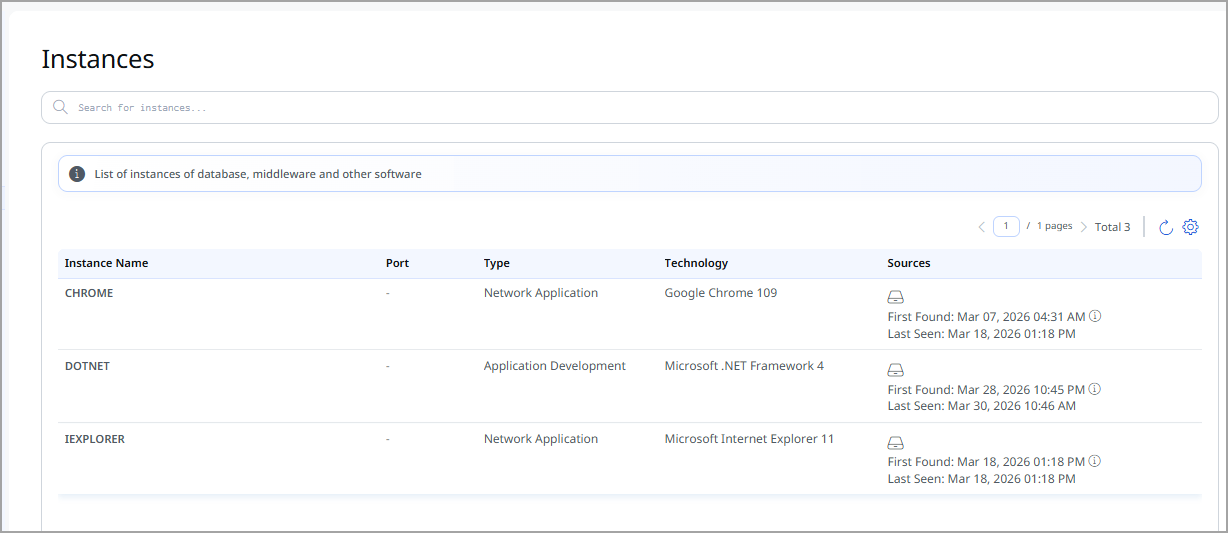
Software InstancesSoftware Instances
The Software Instances tab provides visibility into the running instances of databases, middleware, and other software detected on an asset. This view helps you understand which software is actively running, the associated ports, underlying technologies, and how the instance was discovered.
The following instance details are displayed:
| Detail | Description |
|---|---|
| Instance Name | Displays the name of the detected software instance. For example, a service name like MSSQLSERVER or an application name like Google Chrome. |
| Port | Displays the port number on which the instance is running or listening. |
| Type | Displays the category of the instance, such as Databases or Network Application. |
| Technology | Displays the detected technology and version associated with the instance, such as Microsoft SQL Server 2019 or Google Chrome 84. |
| Sources | Identifies the discovery source (for example, Cloud Agent or scanner) and provides visibility into how the instance was detected.
|
Traffic SummaryTraffic Summary
You can see the traffic details for Clients and Servers, such as to and from date details, Total Ingress, and Total Egress from the Traffic Summary tab.
Business InformationBusiness Information
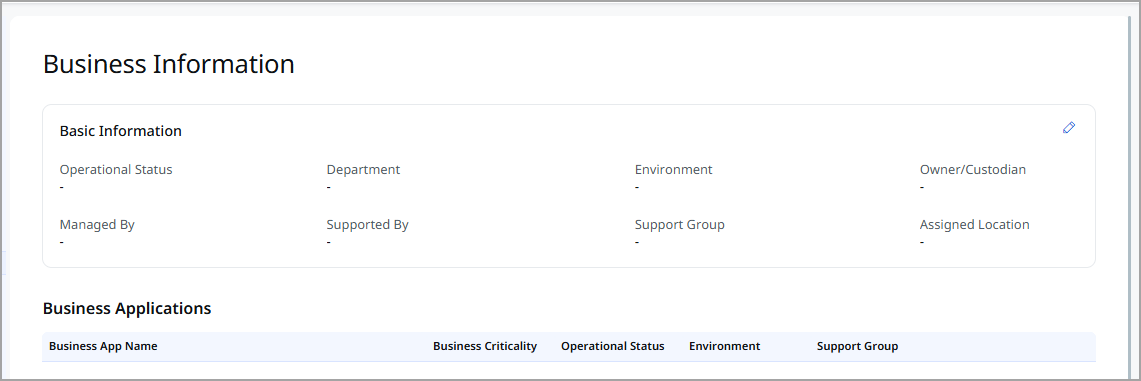
The Business Information tab provides business context for an asset by mapping it to ownership, environment, support structure, and associated business applications.
The Business Information is displayed:
| Field | Description |
|---|---|
| Basic Information | |
| Operational Status | Indicates the current operational state of the asset, such as active, inactive, or undefined. |
| Department | Displays the department to which the asset belongs. |
| Environment | Indicates the environment in which the asset is used, such as Development, Test, or Production. |
| Owner / Custodian | Identifies the business owner or custodian responsible for the asset. |
| Managed By | Displays the individual or team responsible for managing the asset. |
| Supported By | Identifies the primary support contact for the asset. |
| Support Group | Displays the support group responsible for handling issues related to the asset. |
| Assigned Location | Shows the physical or logical location associated with the asset. |
| Edit icon | Allows authorized users to update the business information associated with the asset. |
| Business Applications | |
| Business App Name | Name of the business application associated with the asset. |
| Business Criticality | Indicates how critical the application is to business operations. |
| Operational Status | Shows the current operational state of the business application. |
| Environment | Displays the environment in which the business application operates. |
| Support Group | Identifies the support group responsible for the business application. |
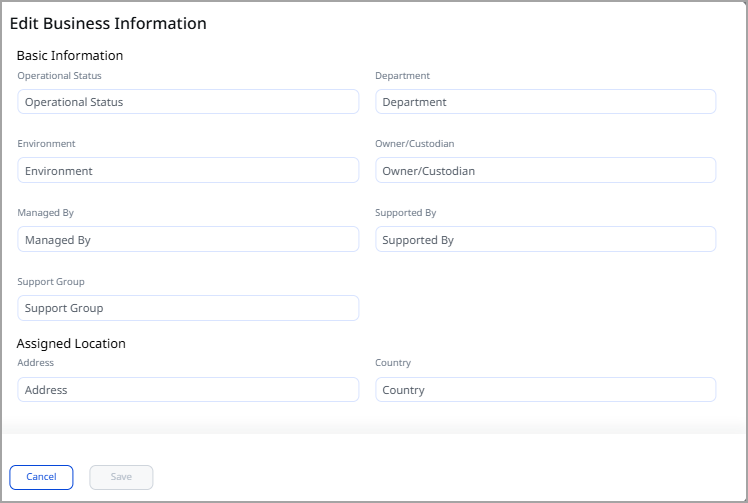
Edit Basic Information
You can update the business information associated with the asset by clicking edit icon.
Security Section Details
The Security section provides a comprehensive security posture of an asset by consolidating risk, vulnerability, exposure, and compliance–related insights across multiple Qualys security modules. The tabs displayed in this section give you actionable visibility into the asset’s security health and help you prioritize remediation effectively.
The tabs available in this section may vary from asset to asset based on activation status, subscriptions, and asset type.
The following tabs are available under the Security section.
The TruRisk™ Score tab provides a detailed, asset-level view of risk by correlating technical findings with business context. It helps you understand how risky an asset is, why it is risky, and which factors contribute most to that risk, enabling effective prioritization and remediation.
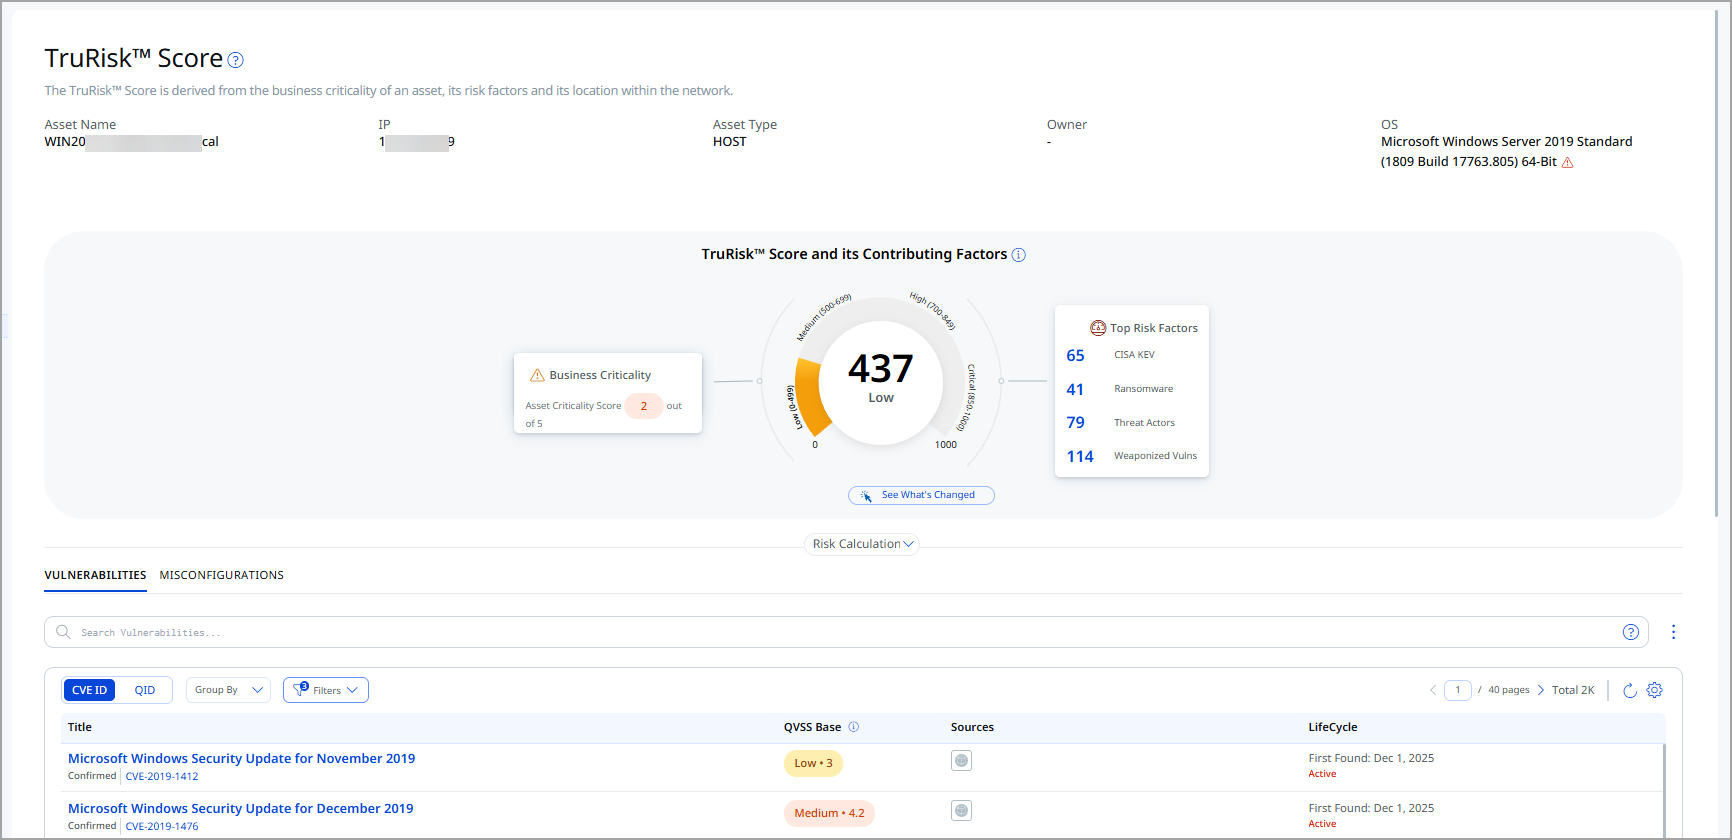
Asset overview
At the top of the page, you can view the primary asset details, including:
| Field | Description |
|---|---|
| Asset Name | The unique name assigned to the asset. |
| IP Address | The IP address associated with the asset. |
| Asset Type | Indicates the type of asset, such as a host, virtual machine, cloud asset, or container. |
| Operating System | Displays the operating system running on the asset (for example, Windows or Linux). |
| Owner | Identifies the person or group responsible for the asset. |
TruRisk™ Score overview
The TruRisk™ Score represents the overall risk associated with the asset and is derived from:
- Business criticality of the asset
- Security risk factors
- Asset location within the network
The score is categorized into the following severity levels:
- Low
- Medium
- High
- Severe
If the TruRisk™ score is not yet calculated, a message is displayed prompting you to scan the asset to generate the score.
TruRisk™ Calculation details
This section explains the TruRisk™ calculation formula, showing how multiple contributing factors are aggregated to compute the final score. It provides transparency into how business context and security findings influence risk scoring.
The factors that contribute to the TruRisk™ Score are shown as individual tabs. Each tab represents a specific risk domain and displays how that factor contributes to the overall TruRisk™ in aggregation.
TruRisk™ Score contributing factors:
- CSAM Trial or Paid user with VMDR enabled:
Vulnerabilities detected by VMDR, along with CSAM TruRisk calculation factors, contribute to the risk contributors and generate the TruRisk™ Score. - CSAM Trial or Paid user without VMDR enabled:
Only CSAM TruRisk calculation factors contribute to the risk contributors, and the TruRisk™ Score is generated based solely on CSAM risk factors.
Vulnerabilities tab
You can view the vulnerabilities detected for the asset from the Vulnerabilities tab. By default, the detailed list of vulnerabilities is shown based on Critical and High QDS vulnerabilities. You can also choose to include other vulnerabilities.
The detailed vulnerability details include the QID, Title, date when the vulnerability was detected, Source, Severity, and QDS. The Qualys Detection Score (QDS) is calculated, considering the CVSS score and the vulnerability context to prioritize remediation actions.
If the asset is activated for the VM module, you can choose to patch the vulnerability by clicking Patch Now. You can also patch multiple vulnerabilities by selecting the checkboxes next to the QID of required vulnerabilities. If you want to patch all the vulnerabilities on the page, select the checkbox next to the Actions Menu. Then, you can add it to an existing or a new job.
You can also download the vulnerability details in the CSV format.
Misconfigurations tab
You can view the misconfigurations detected on your assets. The detailed misconfigurations include the Title,Technology/Category, QVSS Base, Sources and LifeCycle.
The Certificate Instances tab provides visibility into digital certificates detected on the asset. This view helps you monitor certificate usage, understand where certificates are deployed, and identify potential security or compliance risks related to certificate configuration and lifecycle.
The following Certificate Instance details are displayed:
| Column | Description |
|---|---|
| Certificate Name | Displays the name or common name (CN) of the detected certificate. This helps identify the certificate in use. |
| Sources | Indicates the discovery source from which the certificate information was collected (for example, scanner or certificate view). |
| Port | Shows the port number on which the certificate is deployed or detected. |
| Protocol | Indicates the protocol associated with the certificate, such as TLS or SSL. |
| Service | Displays the service that is using the certificate (for example, HTTPS or another secure service). |
| Last Found | Shows the most recent date when the certificate was detected on the asset, helping confirm active usage. |
| Grade | Represents the security grade assigned to the certificate based on its configuration, strength, and compliance with best practices. |
Sources Section Details
The Sources section provides visibility into how and from where the compute asset was discovered.
The following tabs are available under the Sources section:
The Summary tab displays the origin of the asset and its correlation across external sources. This section helps you understand which integrations identified the asset, when it was discovered, and how it is tracked in the source system.
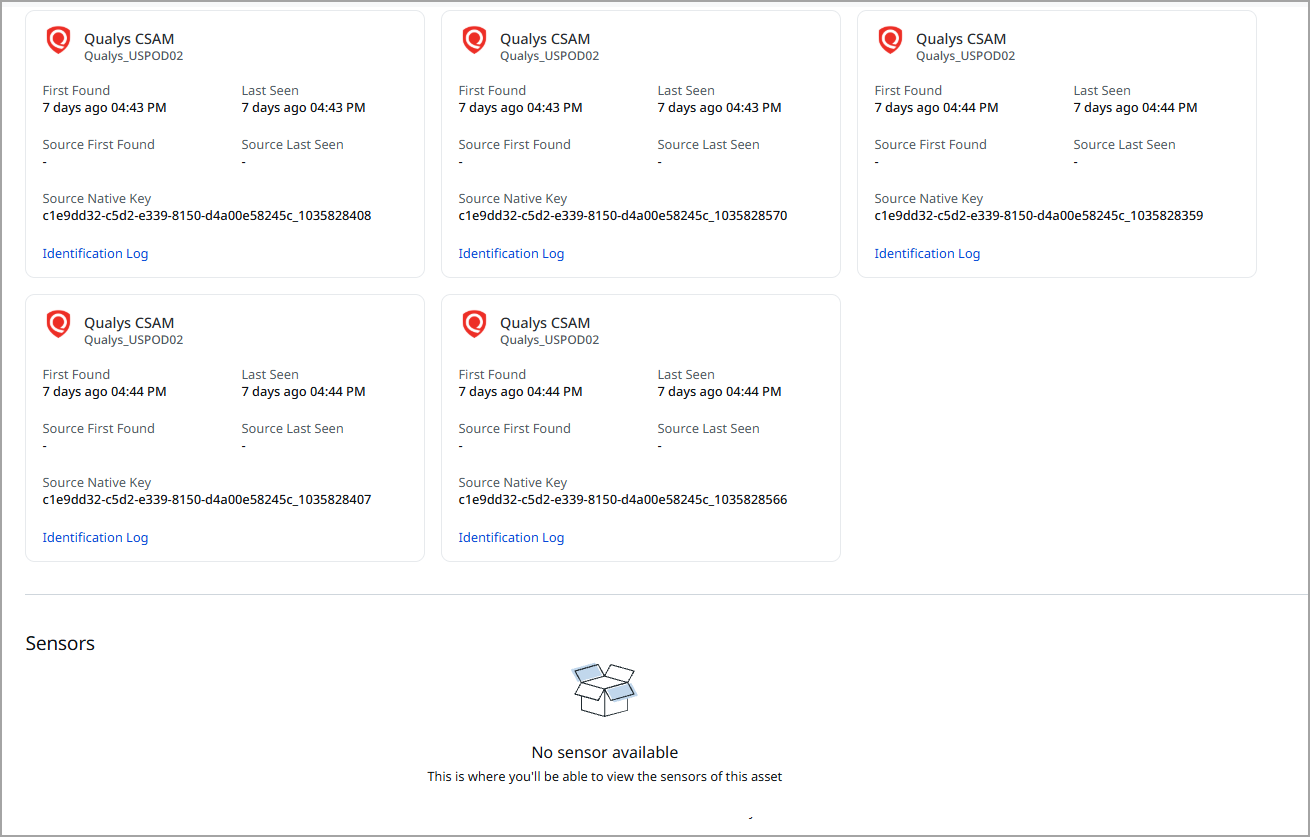
The following asset source information is displayed:
| Field | Description |
|---|---|
| Source Name | Displays the name of the external system from which the asset data is sourced (for example, ServiceNow). |
| Source Instance | Displays the specific instance or integration name within the external source that provided the asset data. |
| First Found | Indicates the date and time when the asset was first discovered or ingested from the external source. |
| Last Seen | Indicates the most recent date and time when the asset was observed or updated from the same source. |
| Source First Found | The date when the asset was first discovered by the connector source. |
| Source Last Seen | The date when the asset was last updated by the connector source. |
| Source Native Key | Displays the unique identifier used by the external source to track the asset. This helps correlate the asset across systems. |
Asset Identification Log
The Identification Logs section provides detailed logs showing how the asset was identified and matched across data sources.
| Column | Description |
|---|---|
| Rule Name | Displays the name of the identification rule that was evaluated for the asset. |
| Identification Attributes | Shows the asset attributes used by the rule to attempt identification, such as MAC Address, Serial Number, Hostname, or IP. |
| Result | Indicates the outcome of the rule evaluation. For example, Match Found or No Match Found. |
| Timestamp | Displays the date and time when the identification rule was executed. |
The Passive Sensor tab provides the details of the sensor that reported the asset. However, ICS_OCA tagged assets are created from the project file that is uploaded by the user in the "VMDR OT module". Hence, the passive sensor information is not applicable for such assets and therefore not shown on the Passive Sensor tab.
The Cloud Agent Passive Sensor (CAPS) tab provides passive discovery details collected by the Qualys Cloud Agent.
The following information is displayed:
| Field | Description |
|---|---|
| Asset / Host Name | Displays the hostname of the asset detected by the Cloud Agent Passive Sensor. |
| Geographical IP | Shows the IP address associated with the asset at the time of passive detection. |
| Agent UUID | Unique identifier of the Cloud Agent that passively detected the asset. |
| Last Checked-In Date | Indicates the last date and time when the Cloud Agent reported passive sensor data. |
| First Found | Displays the date and time when the asset was first passively observed by CAPS. |
| Last Seen | Displays the most recent date and time when the asset was passively observed. |
| Last Seen MAC Address | Shows the MAC address detected during the most recent passive observation. |
| Last Seen IP Address | Shows the IP address detected during the most recent passive observation. |
From the Agent Summary tab, you can see the information of the agent from where the asset is collected.
Alert NotificationAlert Notification
You can see alert notification details that are applicable to the asset. The alert notifications are set from the Continuous Monitoring application. If the alert notifications set are not applicable to the asset, you can see the text No Alert Notifications.
Connector Source DetailsConnector Source Details
The connector sources that discovered the asset are displayed under the SOURCES section. You can click each connector source to view its details, including custom and identification attributes.
Add or Remove Tags
You can manage tags of the compute assets from the Quick Actions or Actions menu. For more information on managing tags, refer to Manage Asset Tags.
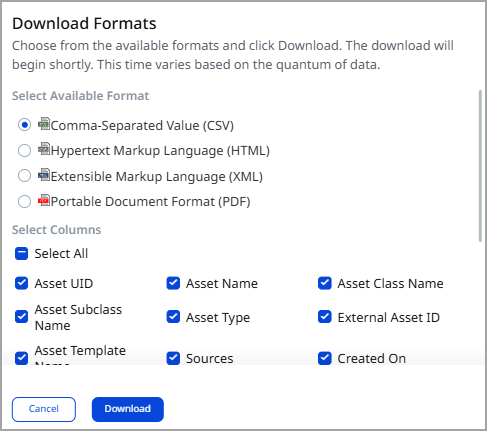
Download Compute Assets List
You can download the list of assets in a report from the AD Assets tab in the following formats:
- Comma-Separated Value (CSV)
- Hypertext Markup Language (HTML)
- Extensible Markup Language (XML)
- Portable Document Format (PDF)
If you want to download the report in PDF format, you can select a maximum of 5 columns. If you select the Tags column, the report for up to 5,000 assets is downloaded.
To download, follow these steps:
- Click
 on the AD Assets tab.
 - Select the download format and the columns you want in the report.
-
Select the timezone.
-
Click Download.