Enterprise TruRisk Management Release 1.6
January 02, 2026
Introduced Unified Asset Inventory (UAI)
The Unified Asset Inventory (UAI) provides a single, comprehensive view of all assets across your organization’s hybrid IT environment. It consolidates asset data from Identity, Applications, Compute, Containers, Storage, Software, Network, Resources, and Certificates into a single inventory.
UAI unifies asset discovery, classification, and context across different company modules and external integrations. This approach eliminates isolated views. As a result, every asset is visible, whether it is cloud-based, on-premises, or externally integrated. Additionally, all assets can be searched easily and assessed consistently.
Prerequisite
This feature is available on request; contact Qualys support or your Technical Account Manager (TAM) to activate it for your account.
What’s New with the Unified Asset Inventory
- Introduced a centralized asset inventory serving as the single source of truth for all asset types.
- Unified asset visibility across company-managed and externally discovered or integrated assets.
- Enabled cross-asset tagging to associate business services with infrastructure, applications, and identities.
- Added global search across all asset classes using hostnames, tags, domains, and service names.
- Laid the foundation for asset relationship mapping to support dependency and impact analysis.
Unified Asset Tagging
You can now apply the same tag across multiple asset types, enabling a business-centric view of your infrastructure.
Example:
Apply the tag Banking Service to on-prem hosts, cloud storage (S3), containers, web applications, and certificates. A single dashboard or report can then show all assets supporting the Banking Service along with their associated security findings.
Unified Search Across All Asset Types
UAI enables a single search experience across the entire asset landscape. You can search using:
- Hostnames or IPs
- Tag names (business services, environments, owners)
- Domains or application names
- Service or resource identifiers
Search results return all related assets across compute, containers, storage, applications, identities, and certificates, along with their corresponding security assessments.
Supported Asset Classes and Subclasses
Unified Asset Inventory includes the following asset classes and key subclasses:
- Compute
- Virtual Machines
- Hosts
- Other Compute
- Container
- Container Instances (Docker containers, Kubernetes pods, ECS tasks)
- Container Images (registry images)
- Storage
- Disk volumes, object storage (S3), databases, file shares, blob storage
- Software
- Generic Software (applications, runtimes)
- Component Software (libraries, packages, dependencies)
- Application
- Web Applications
- Code Repositories
- Resource
- Cloud resources such as load balancers, DNS records, API gateways
- Certificate Resources (SSL/TLS and code-signing certificates)
- Identity
- User Identities
- Group Identities
- Role Identities
- Network
- Routers, switches, firewalls, VPNs, network interfaces, security groups
Asset Sources
UAI maintains visibility into assets regardless of how they enter the platform:
- Company-discovered and managed assets from native modules.
- Externally discovered or managed assets integrated via connectors, CMDBs, APIs, or third-party platforms.
For example, cloud assets may appear both as:
- Assets managed and visible in Total Cloud
- Assets discovered and managed via Wiz and surfaced through company/Wiz connectors
Asset Relationships and Context
UAI is designed to support asset relationship modeling, enabling you to understand how different asset types are connected. These relationships help with dependency mapping, blast-radius analysis, and risk prioritization.
Example Relationship Chain
Web Application > Load Balancer > Virtual Machine > Container Instance > Software Component > Object Storage > IAM Role > User/Group
You can view all your assets by navigating to the Inventory tab.

Support for New Tokens for UAI
For improved usability and searchability, we have introduced support for new tokens. These new tokens are available in the User Interface and documented in the token help. For more information, refer to the Token help from the ETM Online Help.
Introduced Vulnerability Scoring System (QVSS)
QVSS brings the power of Qualys threat intelligence (TruLens and RTIs) together with a CVSS-like 0–10 scale. It preserves QDS logic while expressing severity in a way that’s easier to interpret and compare across teams.
Why QVSS?
QVSS addresses two common issues users encountered:
- Different scoring scales (CVSS 0–10 vs QDS 1–100) made comparison and communication difficult.
- Customers wanted the intuitive CVSS-style scale but without losing Qualys’ threat intelligence advantages.
QVSS Applies to
QVSS is applied to every finding ETM manages, including:
- Vulnerabilities (CVEs) from VMDR and third-party scanners.
- Misconfigurations and policy violations from Policy Compliance, SCA, CSAM, and third-party tools.
QVSS (finding-level) = QVSS Base ± Environmental Adjustments
QVSS Base - It is a global inherent risk of an exposure. It utilizes real-world threat signals, including known exploits, CISA KEV data, Malware and ransomware activity, Threat actor TTPs, trending activity, and EPSS.
Environmental Adjustments - It adjusts the score for your environment using risk factors, business context, and compensatory controls.
This is the value displayed in ETM and used for prioritization, SLAs, and reporting purposes.
Relationship with QDS
QVSS is backward compatible, preserving the QDS logic and expressing it on a 0–10 scale (QDS ÷ 10). Existing QDS-driven automations and APIs continue to work.
QVSS = QDS ÷ 10 (normalized) + CVSS-like severity mapping. QDS continues to be supported for existing automation.
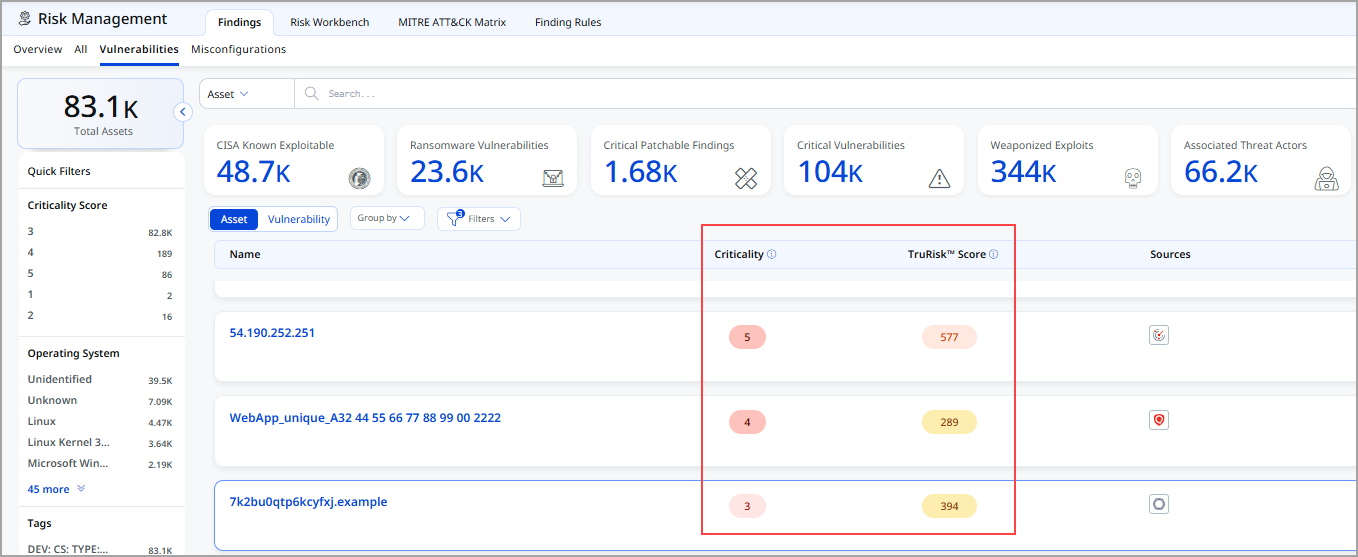
Currently, the QVSS score is displayed on the Vulnerabilities page, while QDS details will continue to be shown on the Misconfiguration Details page.
You can view the QVSS score column on the Findings listing page.
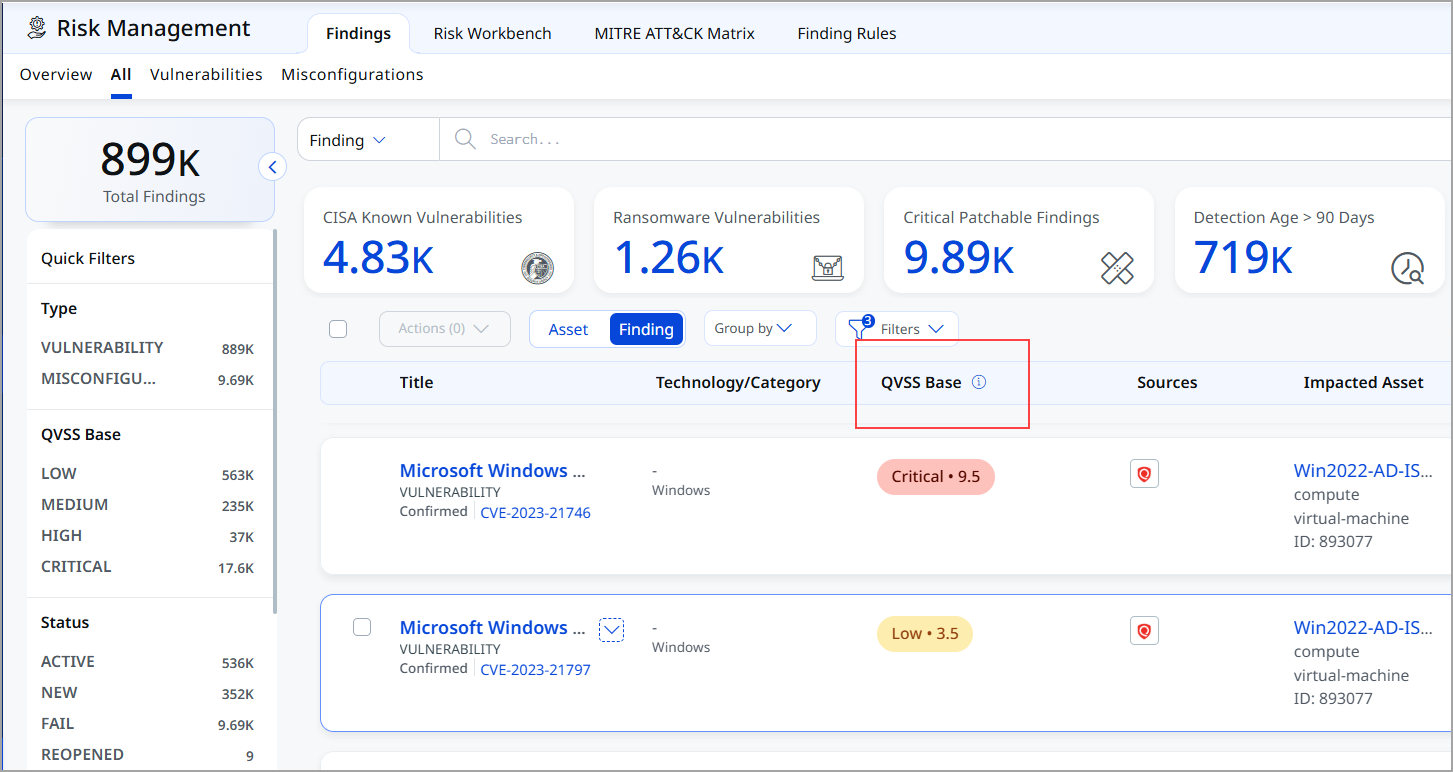
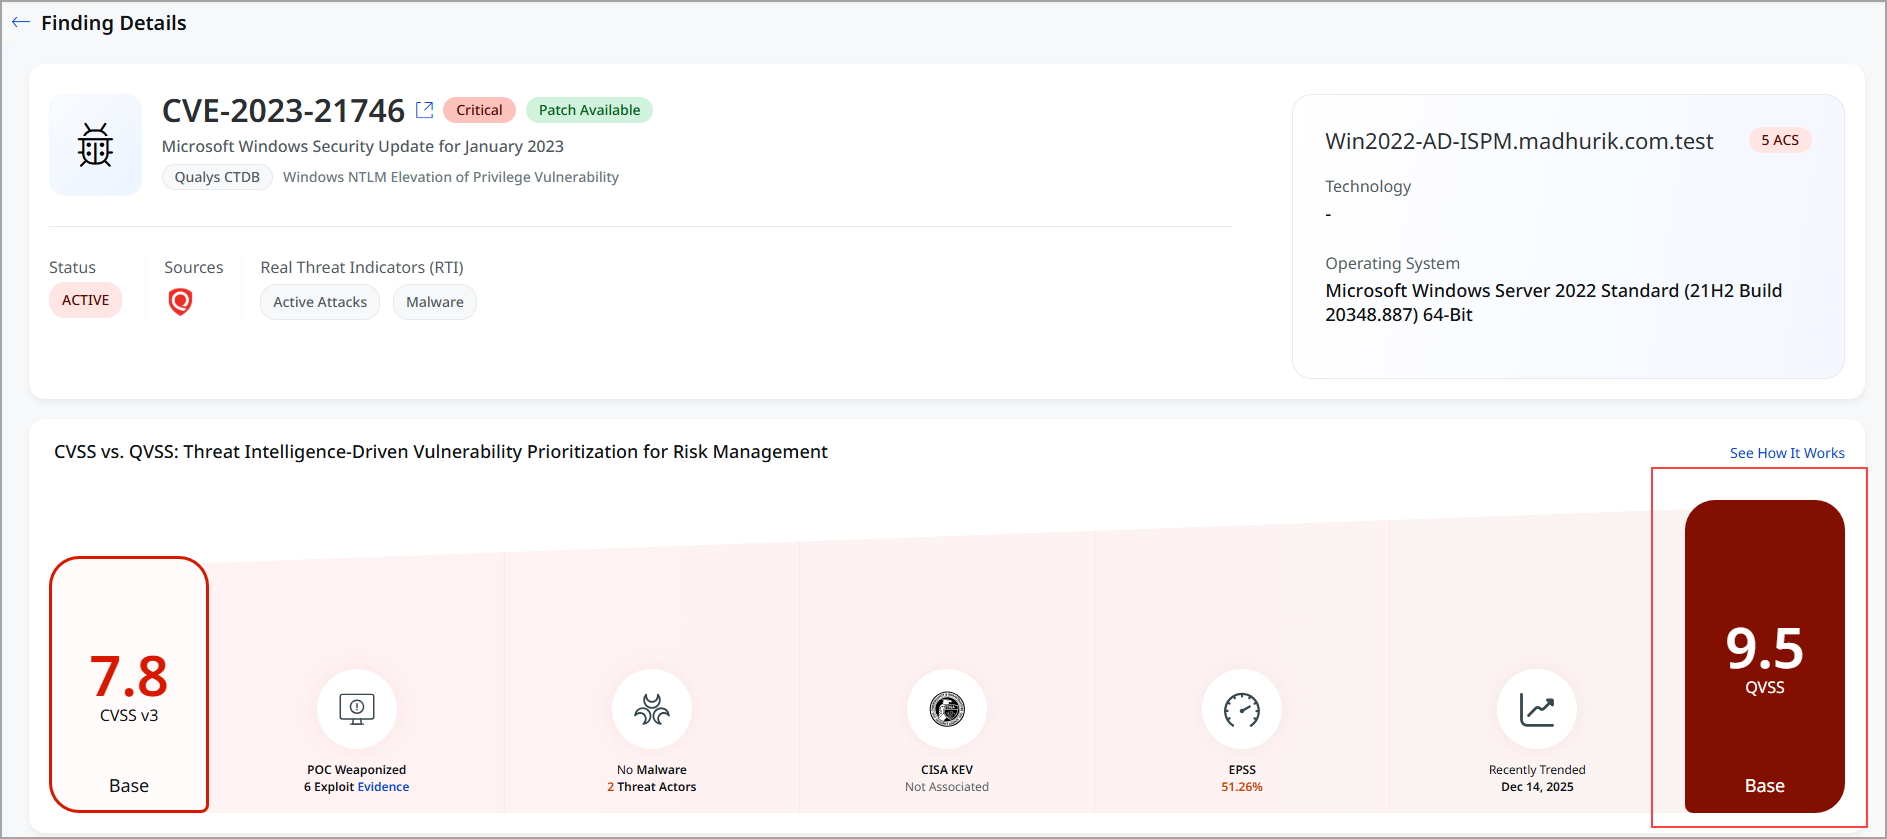
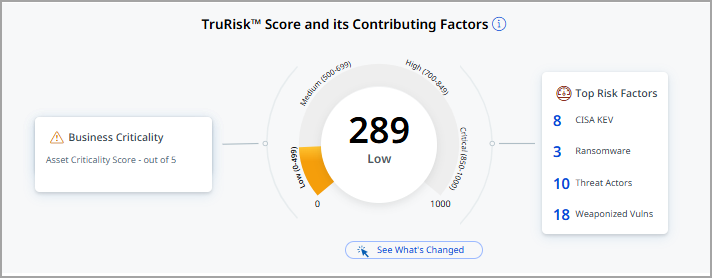
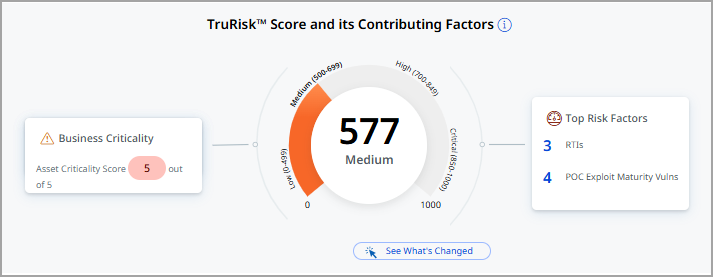
You can view the QVSS score in the findings details, as shown in the following screenshot.
Introduced TruLens Contextual Threat Intelligence and Industry Risk Visibility
TruLens is a new capability in Enterprise TruRisk Management (ETM) that delivers context-aware threat intelligence, industry benchmarking, and risk contextualization in a single, interactive experience. TruLens helps you move beyond static vulnerability data by aligning global threat intelligence with your organization’s environment and industry profile.
TruLens introduces a dedicated view within ETM that brings together real-world threat activity, industry-specific insights, and peer comparisons, enabling faster and more confident risk decisions.
TruLens helps you make informed security decisions by focusing on the following areas:
- Threat Intelligence: Stay updated with trending and actively exploited vulnerabilities to safeguard your organization against potential threats.
- Industry Benchmarking: Analyze the threat actors specifically impacting your industry, allowing for a more tailored security strategy.
- Risk Contextualization: Evaluate your organization's security performance in relation to peers, providing a clear picture of your standing in the cybersecurity landscape.
Prerequisite
TruLens is available as a separate tab within the ETM user interface. To access it, connect with your TAM or Qualys support.
TruLens Capabilities
TruLens provides the following capabilities:
| Feature | Description |
|---|---|
| Threat Intelligence Dashboard | Presents a consolidated view of trending, actively exploited, and newly added CVEs relevant to your industry. |
| Industry Insights | Highlights key threat actors, exposure areas, and impacted assets associated with emerging threats. |
| Peer Benchmarking | Evaluates your Mean Time to Remediate (MTTR), ransomware exposure, and overall risk posture against industry peers. |
| Map Visualization | Displays geographically distributed assets along with their exposure to top trending CVEs. |
| CVE Search | Allows to locate and view details for any specific CVE ID quickly. |
| Interactive Cards and Drilldowns | Supports click-through navigation to detailed vulnerability, threat intel, and asset-specific information. |
With this new feature, you have a TruLens tab that includes the TruLens Home page and CVEs.
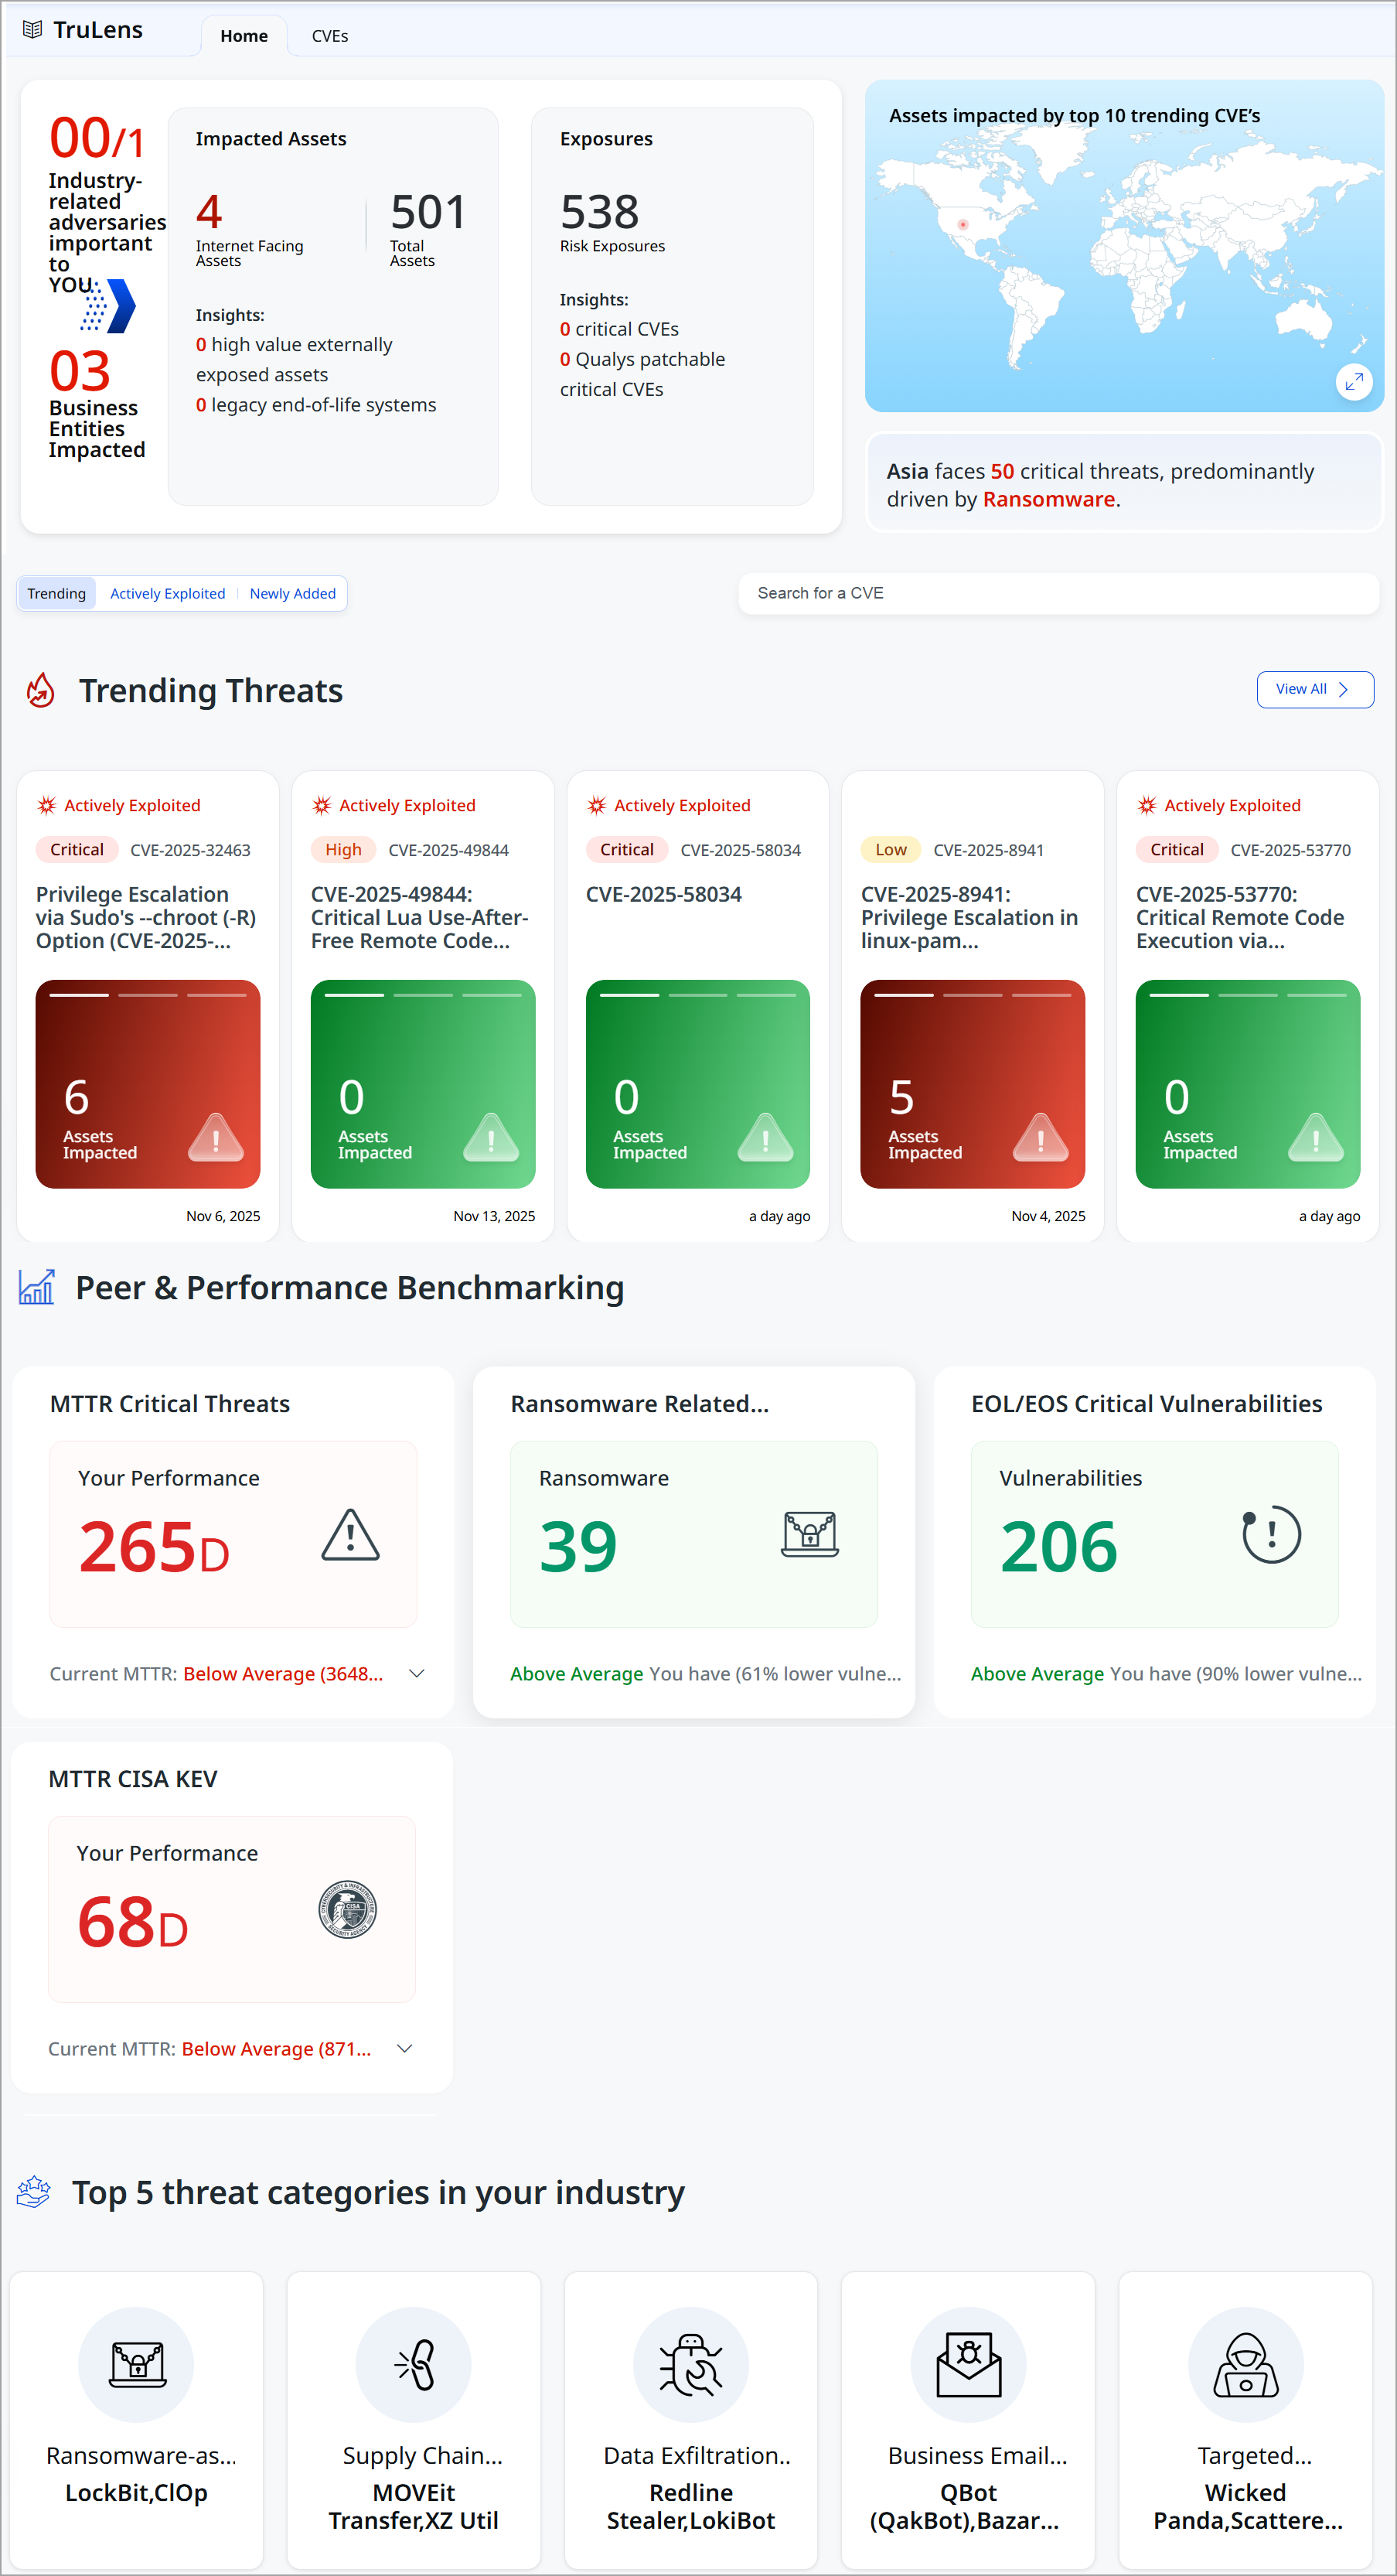
TruLens Home Page – Unified Threat Snapshot
The TruLens landing page provides an industry-tailored snapshot of the threat landscape, organized into intuitive sections designed to answer critical security questions.
Key sections include:
- Industry-Related Adversaries Important to You
Highlights the threat actors, exposures, and impacted assets most relevant to your industry and environment.
- Trending Threats
Surfaces are actively exploited, and high-urgency vulnerabilities are observed across the global threat landscape.
- Peer & Performance Benchmarking
Compares your organization’s security posture and remediation performance against industry peers and top performers.
- Top Threat Categories in Your Industry
Identifies the dominant threat themes driving risk for organizations within your industry.
CVE Intelligence and Prioritization
TruLens introduces an enhanced CVE view that categorizes vulnerabilities by urgency and real-world relevance.
- Newly Added: Recently published CVEs
- Trending: CVEs gaining rapid traction across the threat landscape
- Actively Exploited: CVEs currently exploited in the wild
Manage Lifecycle State of Important Vulnerabilities Ingested via CSV
With this release, we have introduced a new feature that allows you to manage the lifecycle state manually (Open/Closed) of urgent vulnerabilities and misconfigurations ingested through Generic CSV imports. This update brings speed, control, and governance to how you act on high-priority findings.
These capabilities address the need to act on high-priority vulnerabilities while ensuring accuracy, accountability, and compliance.
Key Features
The following are important key features:
- Faster remediation lifecycle
No dependency on connector sync for closure - Better operational efficiency
Reduces CSV upload overhead - Improved accuracy
Findings are marked closed immediately at the user's intention - Flexible bulk actions
Close dozens or hundreds of issues with a few clicks
Direct Lifecycle Management from the User Interface
This feature enables you to directly close vulnerabilities or misconfigurations from the User Interface, eliminating the need to upload updated CSV files or coordinate lifecycle changes through connectors. This speeds up and improves the remediation lifecycle for findings sourced from Generic CSV imports.
Earlier, closing a vulnerability required updating data through connectors or uploading a CSV file. With this enhancement, you can select findings on the User Interface and request closure instantly.
Availability
This feature is available on the following tabs:
- All Findings
- Vulnerabilities
- Misconfigurations
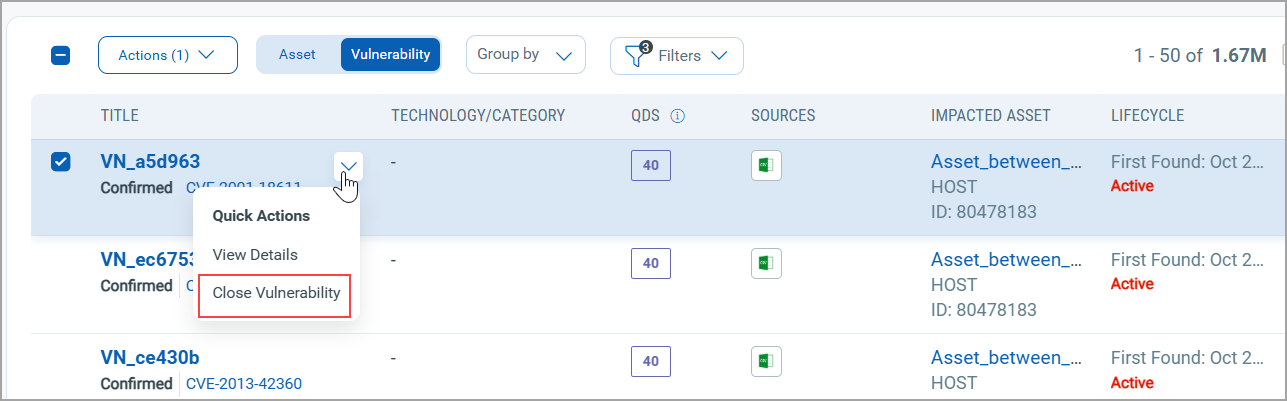
To access this feature, navigate to Risk Management tab > Findings tab > Vulnerabilities tab.
Select one of the Findings from the listing page.
From the Quick Actions menu, select Close Vulnerability.
Enhanced Internet-Facing Tag Behavior and Risk Impact
This enhancement clarifies how Internet-Facing tags are applied and used in Enterprise TruRisk Management (ETM). With this release, risk scoring and prioritization are now supported on Internet-Facing child tags.
With this support, you have
- Clear visibility into Internet-facing exposure
Assets exposed to the internet are automatically identified and consistently tagged, removing guesswork and manual effort.
- More accurate risk prioritization
Internet-facing assets receive an automatic TruRisk uplift, ensuring high-exposure assets are prioritized correctly for remediation.
- Flexible organization without risk distortion
Child tags let you group internet-facing assets by department, business unit, or function—without altering the system-defined risk logic.
Let us see what those tags are:
- System-Generated Internet-facing Tag is
- The Internet-Facing tag is automatically generated by the system when an asset is detected as exposed to the Internet.
- Tag application is driven by system detection logic.
- User-Defined Child Tags
- Users can create custom child tags under the system-generated Internet-Facing parent tag.
- Child tags can be used to organize assets by: Department, Business unit, Functional, or operational grouping
- Child tags provide classification flexibility without altering the system-defined Internet-Facing properties.
With this release, we have started supporting risk scoring and prioritization impact on child tags as well.
- Assets identified as Internet-Facing receive an increased TruRisk impact.
- The presence of the Internet-Facing parent tag results in an automatic risk score uplift (for example, a 1.2 multiplier).
Enhanced User Interface for ETM
With this release, we have introduced an improved user experience across all ETM pages. You can see updates across fonts, colors, typography, and buttons, making the interface more intuitive and easier to use. This release features User Interface and design system enhancements that improve visual consistency, readability, and usability across the application, resulting in a cleaner, more intuitive user experience.
In this release, we have enhanced the user experience on all ETM pages. You can notice updates to fonts, colors, typography, and buttons that make the interface more intuitive and user-friendly. This release features improvements to the User Interface and design system that enhance visual consistency, readability, and usability throughout the application, resulting in a cleaner and more intuitive User experience.
Key benefits are:
- Cleaner, more consistent screens
- Easier-to-read and understandable text
- Important information stands out better, with less clutter
- Faster comprehension of risk, status, and numbers
User Interface Consistency and Clarity
Introducing the new and improved User Interface with the following key upgrades:
- Easier-to-read labels and text, with ALL CAPS replaced by sentence-style text
- Consistent text style for status and source names across the application
- Uniform text colors in tables, filters, page numbers, and tabs
- Aligned colors and text styles for tabs and page navigation throughout the application
- Clear visual indicators for buttons and options, showing active, inactive, or secondary states
- Better emphasis on important information, with subtle styling for less critical details to help users focus
Charts, Metrics, and Data Presentation
You can view the following updates:
- Updated chart color schemes for improved clarity and accessibility
- Compact, more readable numeric formats for better visibility
- Refined color gradients for risk scores and meters to enhance interpretation
Introduced New Color Code for QDS, QVS, and TruRisk™ Score
In this release, we have introduced a new color scheme to indicate and highlight the criticality of the TruRisk™ Score, Qualys Detection Score (QDS), Qualys Vulnerability Score (QVS), and Asset Criticality Score (ACS).
Previously, a different color scheme was used to indicate different ranges of values based to various levels of criticality.
Now, we have added new color shades from a similar color theme to indicate score ranges and corresponding criticality levels. Darker shades represent higher scores that require more attention, helping you quickly identify and prioritize the most critical vulnerabilities. For example: 
The following is an example of the new color codes representing different levels of criticality and TruRisk™ Score:
The following table displays Low and Medium TruRisk™ Scores, along with the corresponding color code changes.
| Score, Medium | |
|---|---|
 |
 |
Revamped Findings Details and In-Product CVE Details Page
This release enhances the Finding Details experience and introduces a new built-in CVE Details page within ETM, eliminating the need for third-party redirection and consolidating all CVE intelligence into a single, consistent workflow.
With this enhancement, you can view:
- A dedicated CVE Details view embedded within ETM (no third-party redirection).
- Clear navigation between CVE details, detection details, and impacted assets.
- Improved context for vulnerability analysis by keeping all relevant information in one place.
- Consistent layout and navigation for easier review of CVE-related findings.
You can now seamlessly navigate between CVE details, detection insights, impacted assets, and remediation guidance, with a unified layout designed for faster review and decision-making.
The following screenshot displays the Finding Details page.
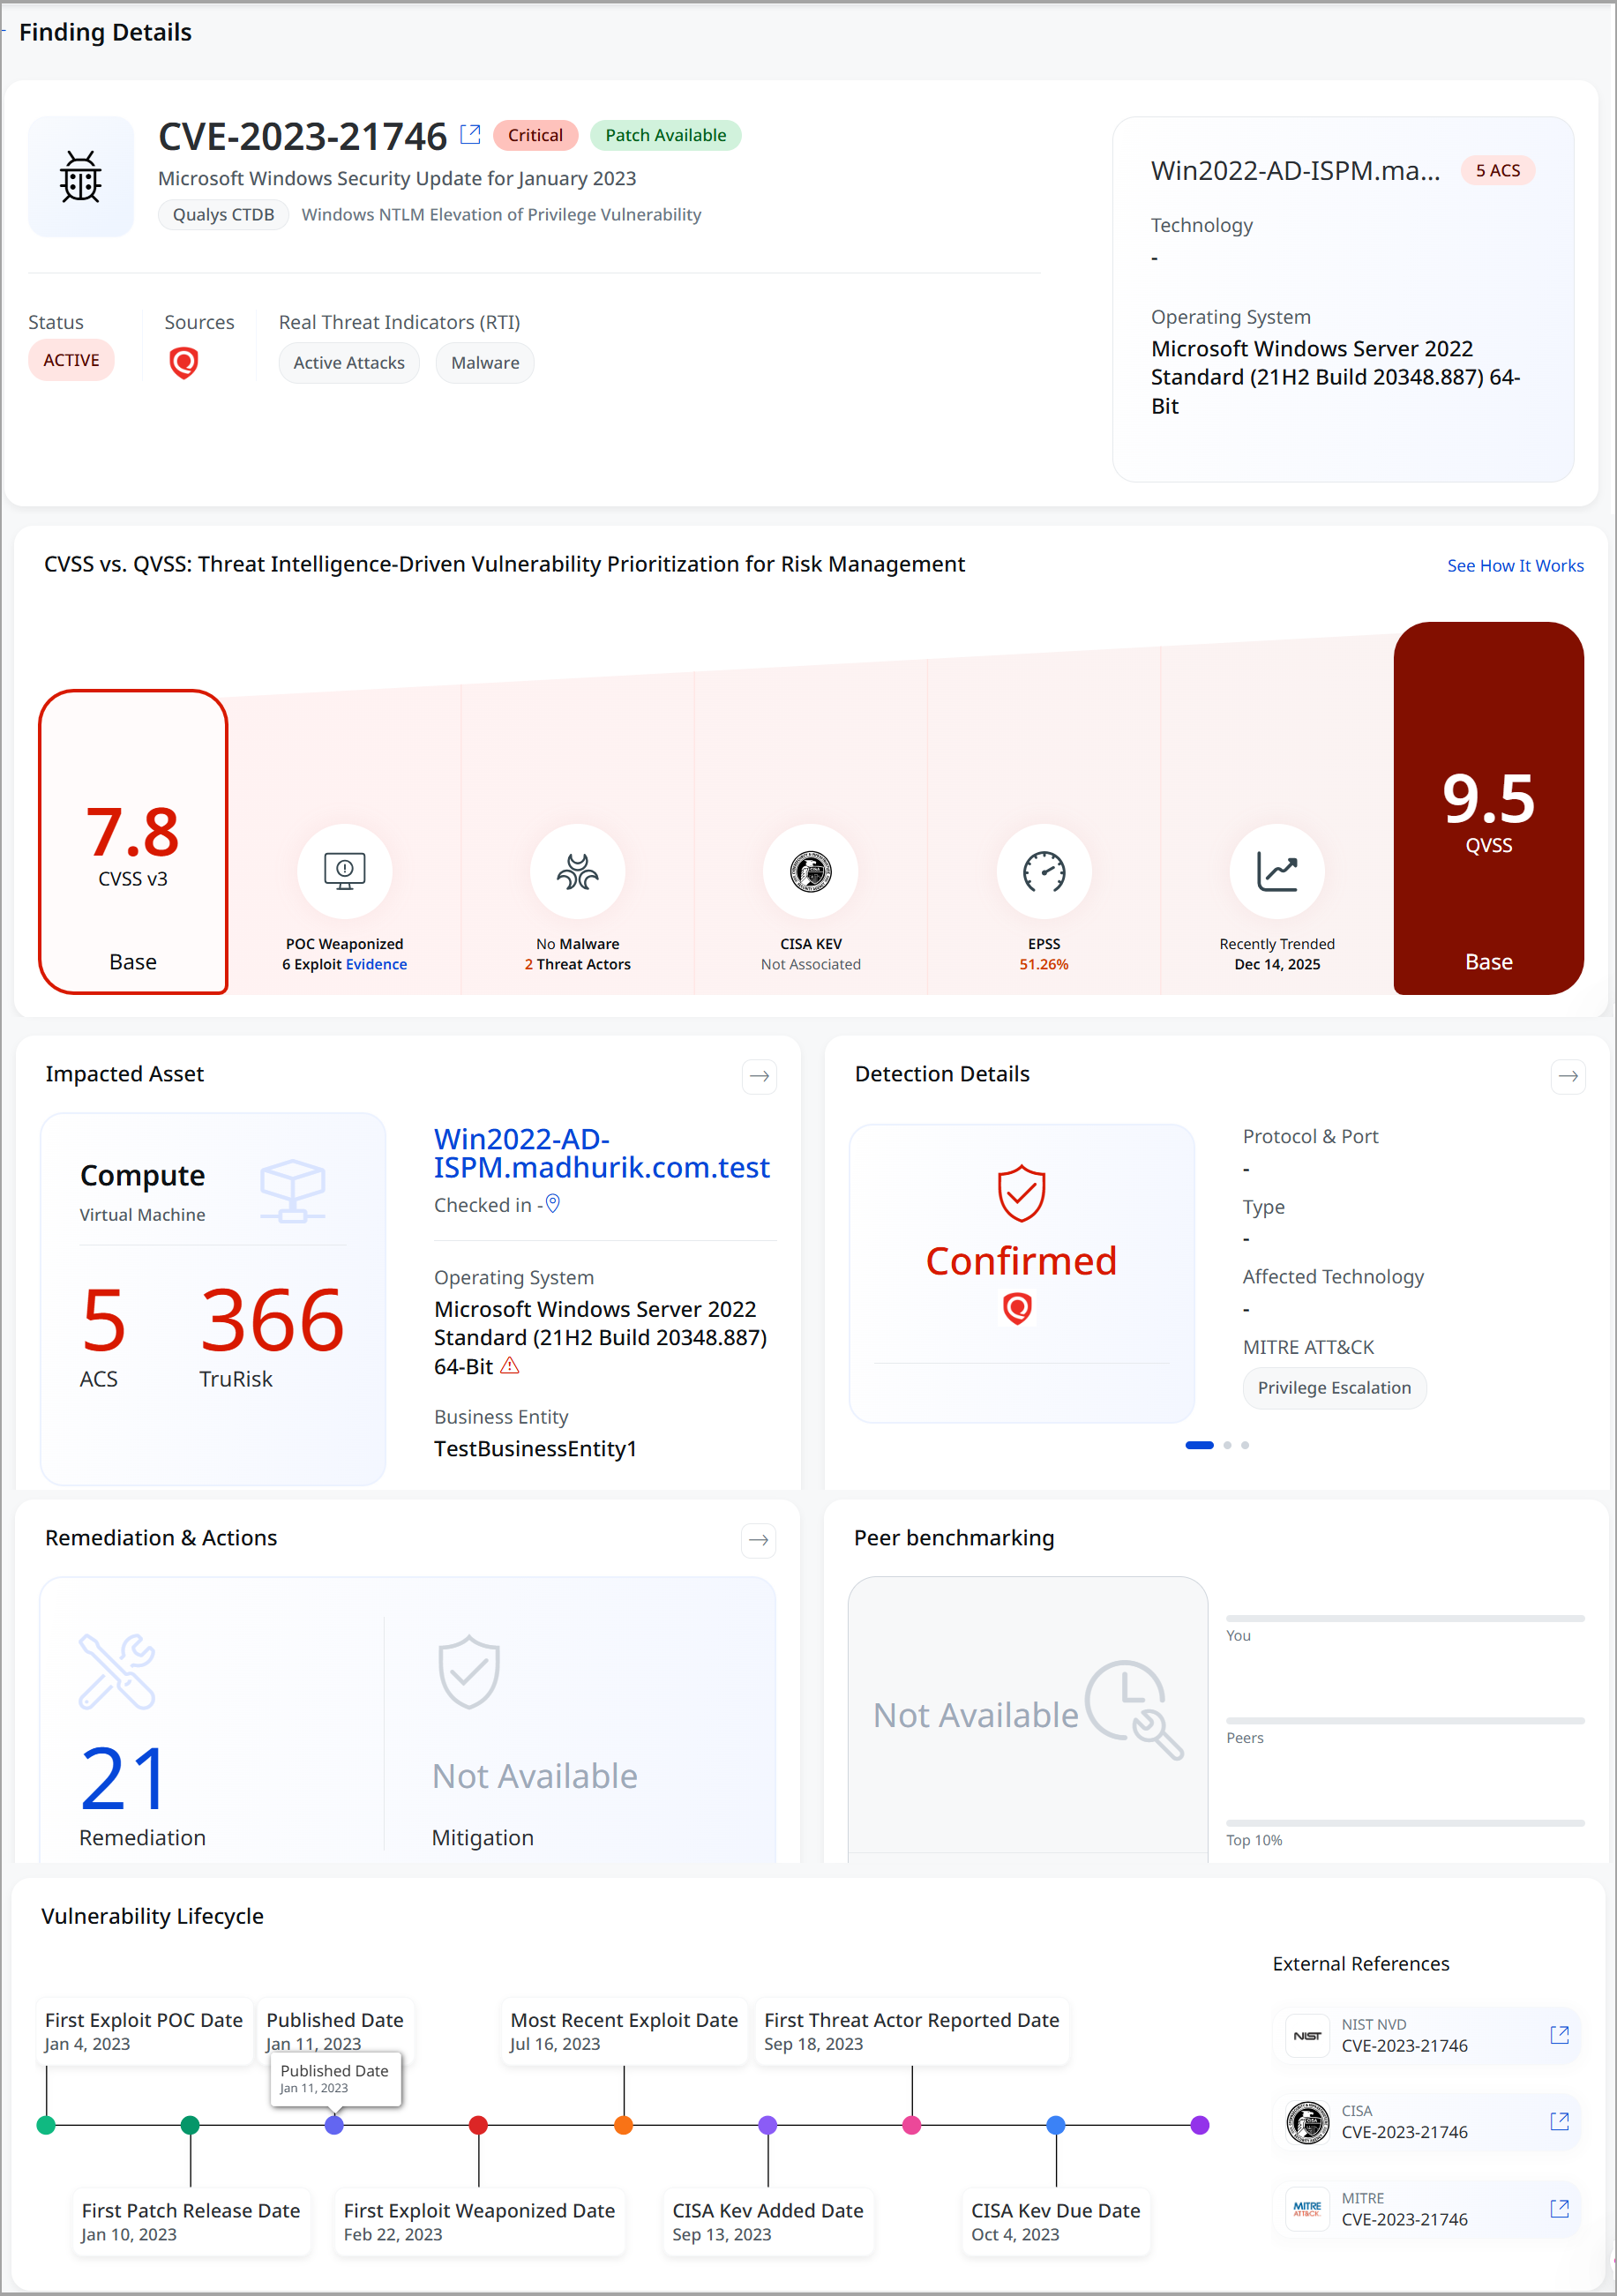
The enhanced view combines CVE overview, threat status, Real Threat Indicators (RTIs), CVSS v3 and QVSS scoring, asset and business impact, and confirmed detection context (including MITRE ATT&CK techniques).
Asset-level details highlight criticality using ACS and TruRisk, while the Impact Summary visualizes exposure across total and internet-facing assets, as well as affected business entities. A comprehensive vulnerability lifecycle timeline tracks exploit PoCs, patch availability, weaponization, and recent exploit activity, helping teams understand threat evolution.
Clear remediation guidance and actionable indicators enable a faster response, delivering a comprehensive, threat-informed view of vulnerabilities within a single, integrated ETM experience.
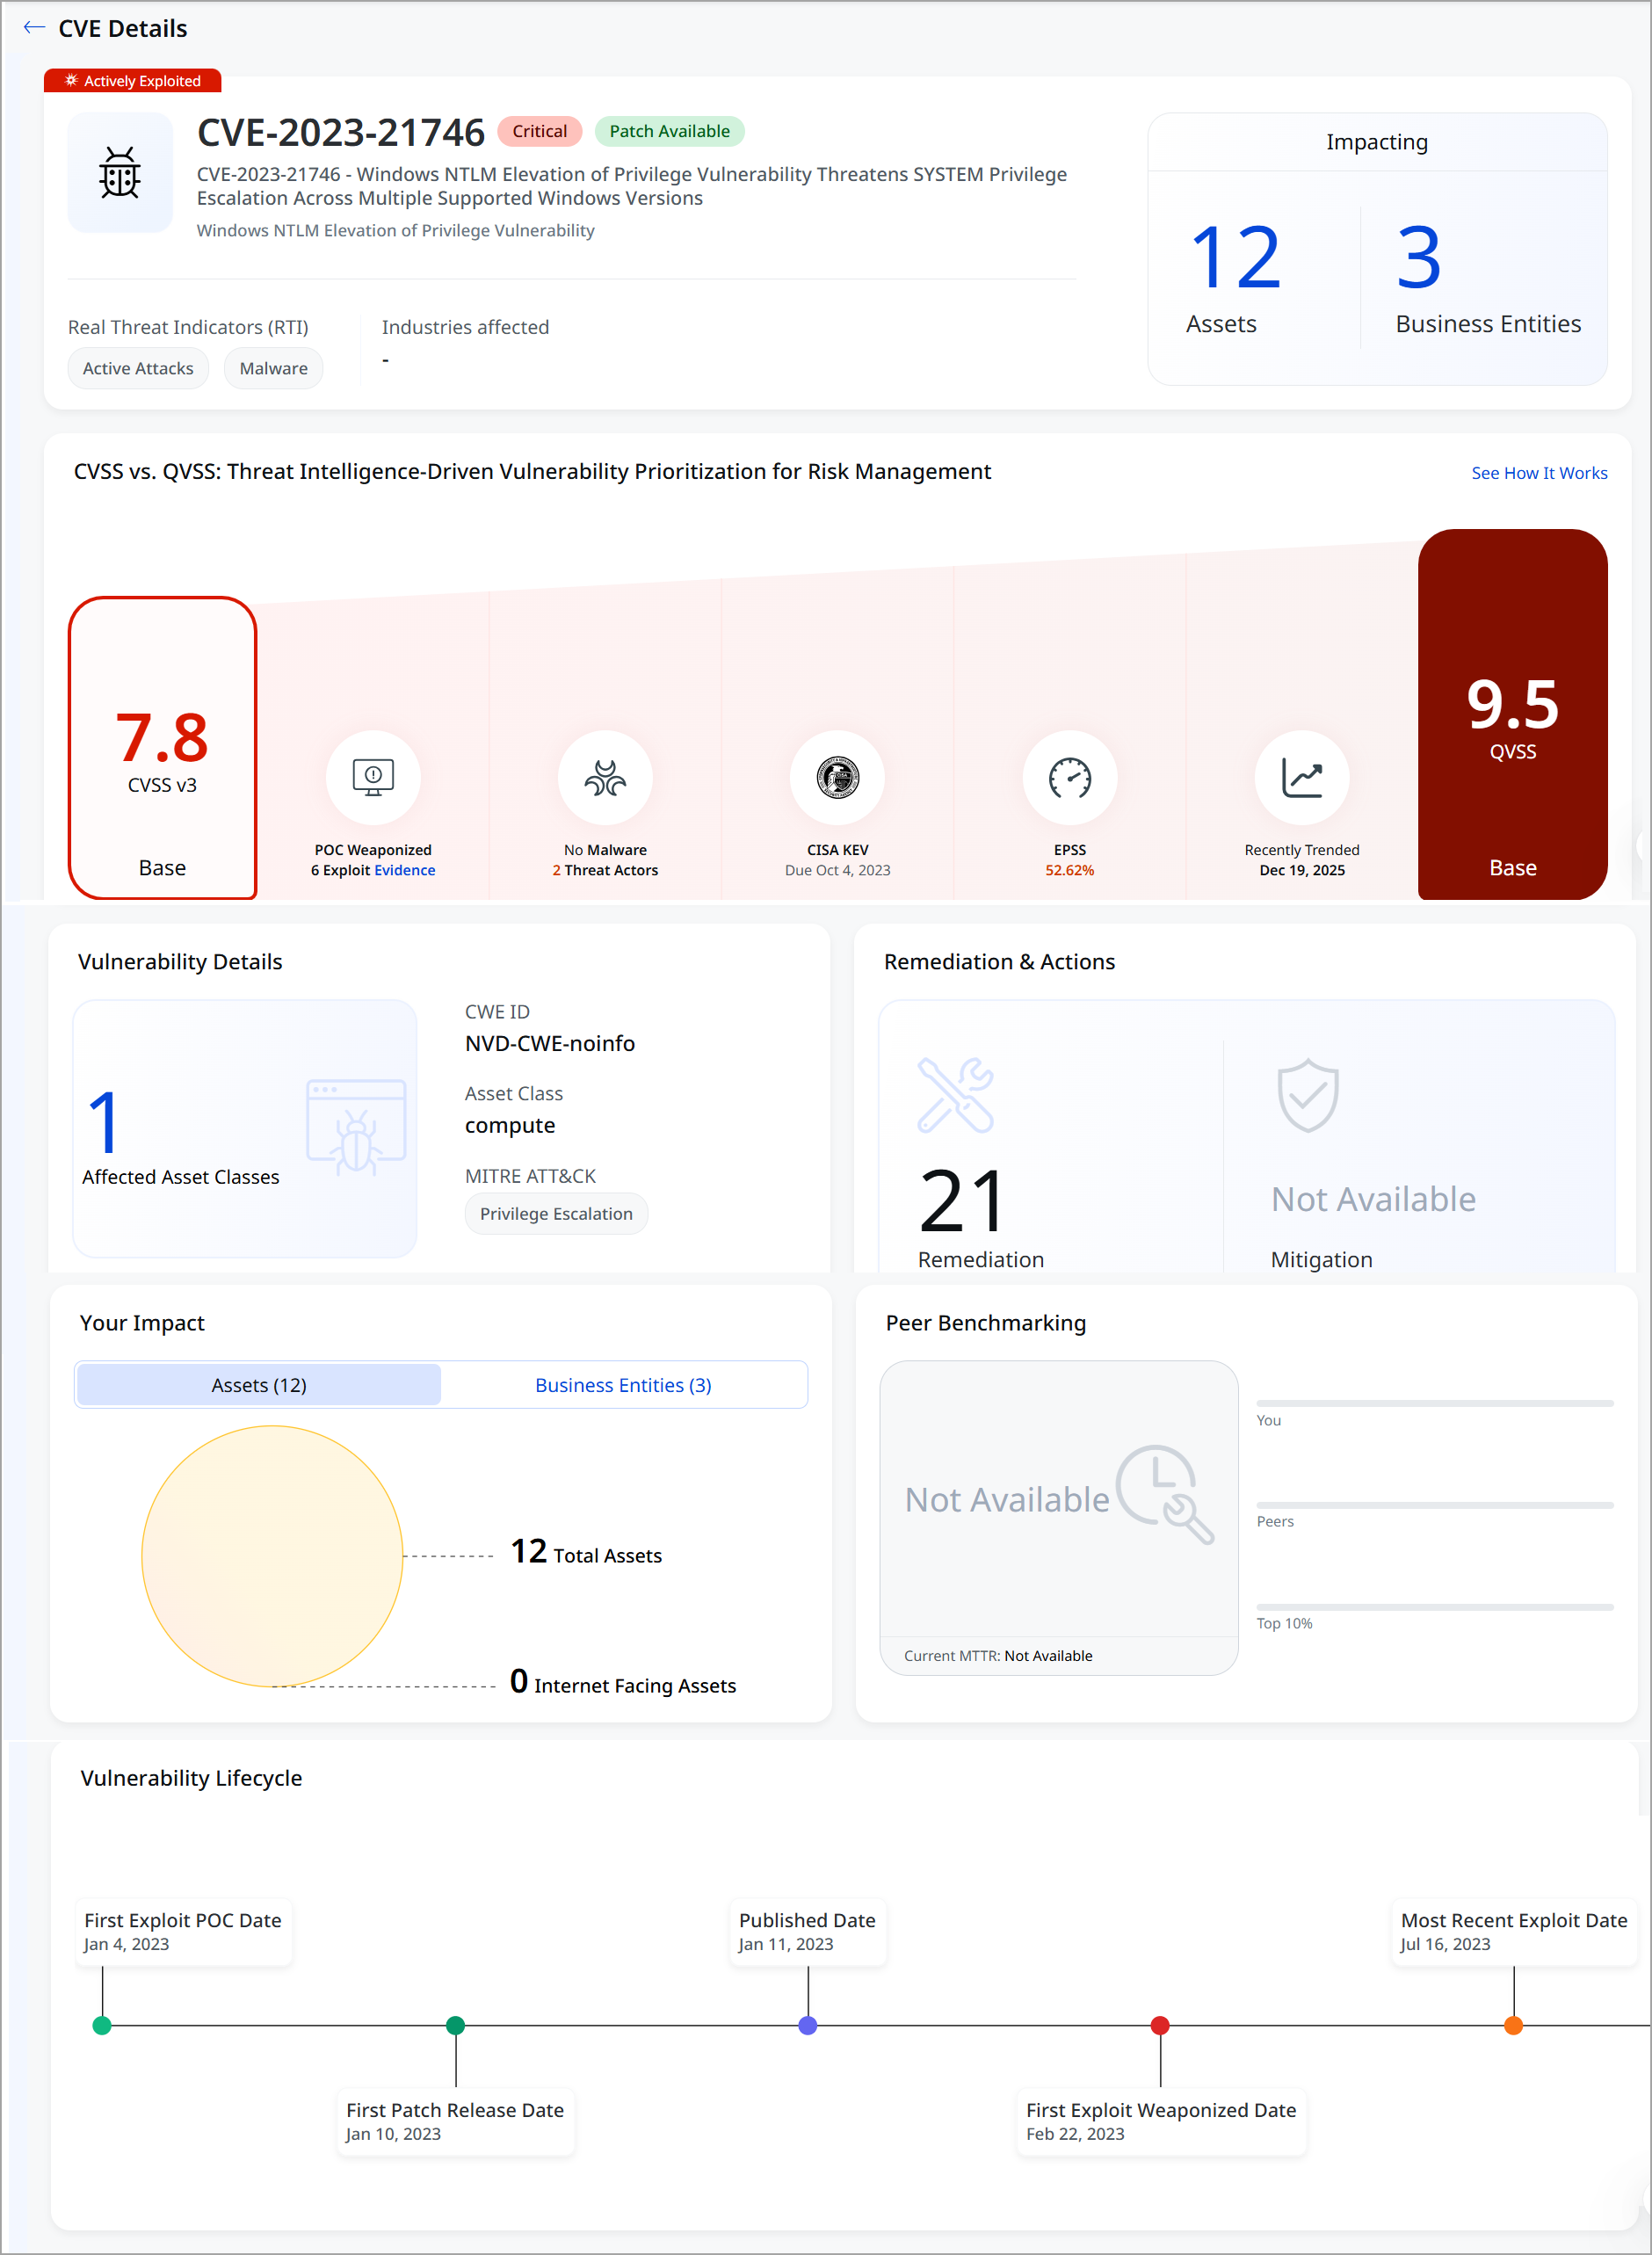
The following screenshot displays CVE details.
Enhanced Identification Rules for Expanded Asset Class and Subclass
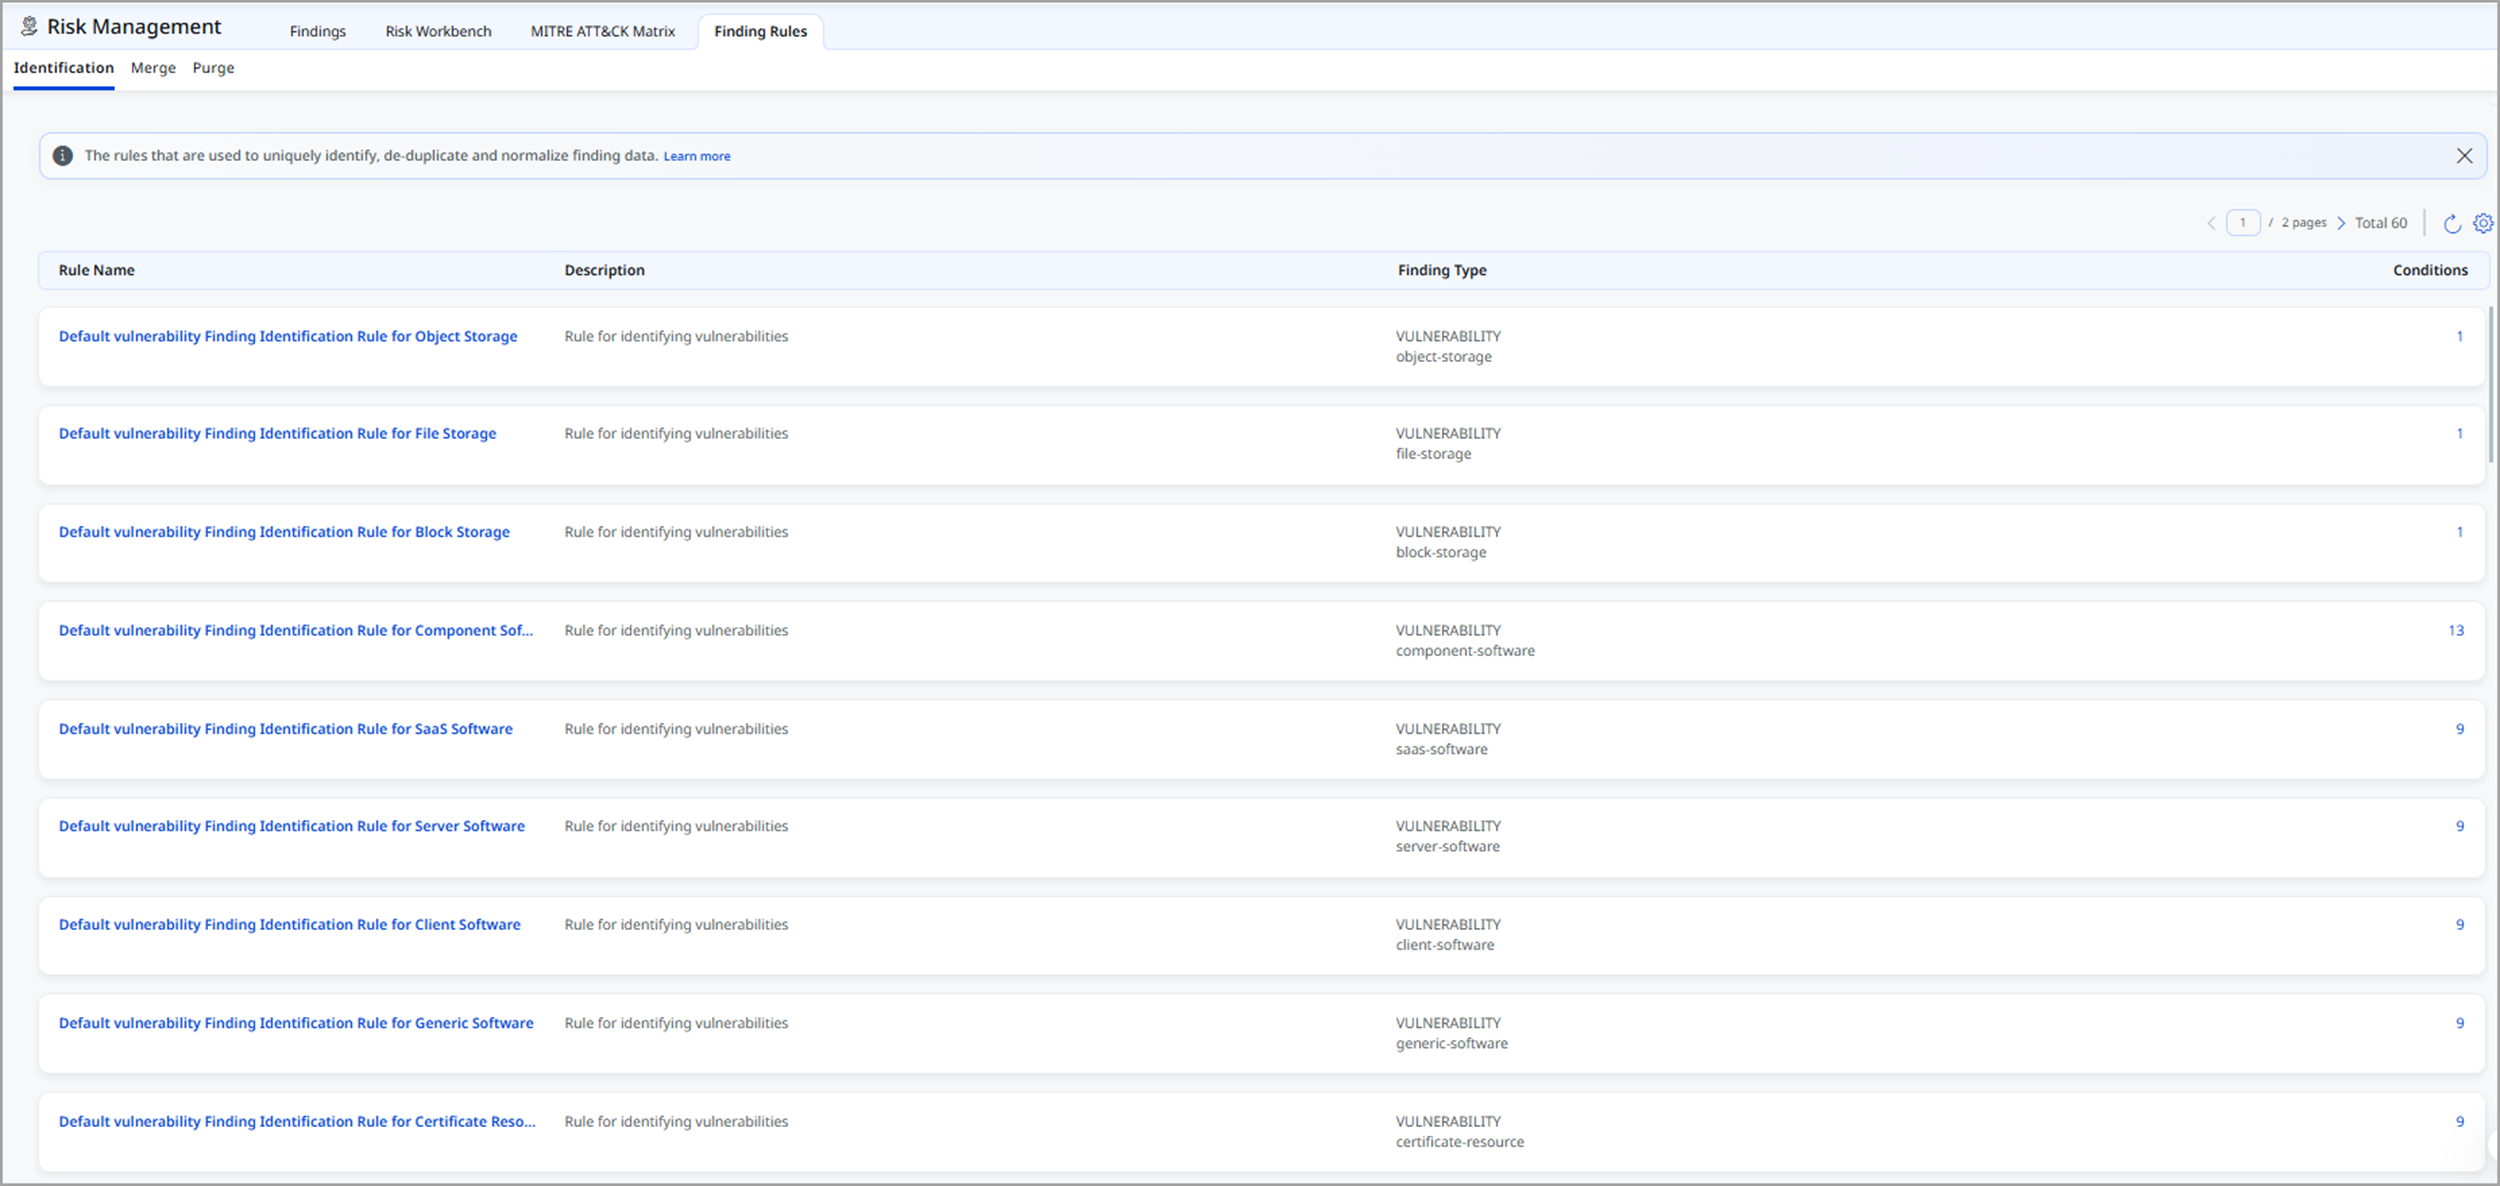
With this release, Identification Rules have been enhanced to support the expanded set of asset classes and subclasses introduced as part of recent User Interface updates.
Previously, Risk Management findings were based on a limited set of identification rules covering only a few asset types, such as vulnerabilities, misconfigurations, and web applications. As asset coverage has expanded, Identification Rules have been updated to ensure accurate and consistent classification across a much broader range of asset types.
New Identification rules apply to UAI-enabled accounts.
Reusing common identification logic improves:
- Consistency in findings classification
- Scalability as new asset subclasses are introduced
- Reliability of Risk Management results
Key benefits are:
-
Consistent and predictable Risk Management findings across all supported asset classes.
-
Expanded asset coverage does not increase the complexity of interpreting findings for users.
-
A scalable foundation for future asset growth and improved risk analysis.
New updates include:
- Added support for identification rules across multiple new asset classes and subclasses.
- Standardized identification logic using a template-based approach, where common rule logic is reused across related asset types.
- Ensured consistent identification behavior for similar assets, such as:
- Container images, container instances, and container resources
- Vulnerability and misconfiguration findings across related subclasses
To know more details about the Identification rule, refer to ETM Online Help.
Introduced Simplified Asset Class and Subclass Filtering for Risk Prioritization
This release enhances the Asset Class and Subclass filter used in risk prioritization by simplifying the user experience while maintaining existing risk calculation behavior. The updated design introduces a clearer, hierarchical selection model that makes it easier to filter and analyze assets across classes and subclasses.
The following are the key areas of improvement:
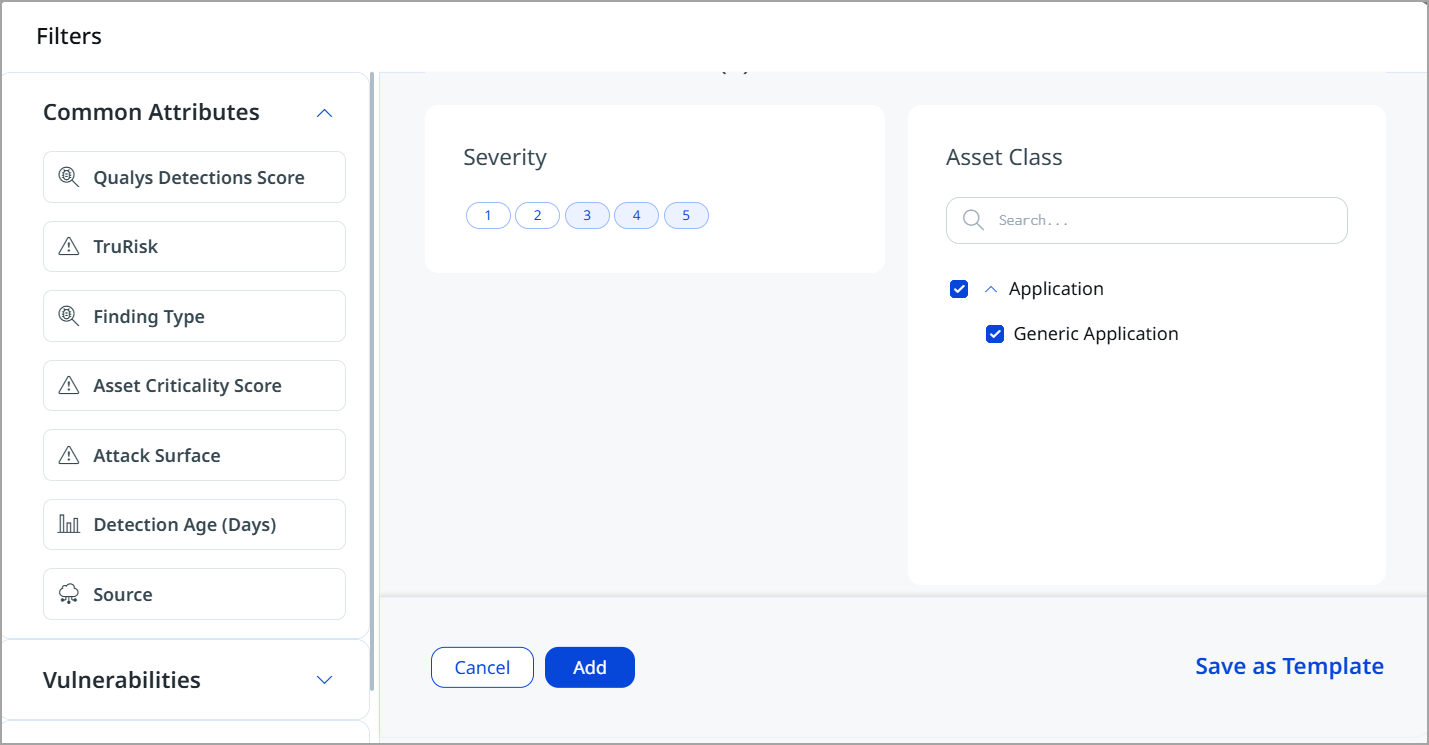
- Simplified Filter Experience
- Introduced a new Asset Class filter component with a clear, multi-level structure.
- Asset selection is now organized as: Asset Class (parent level), Asset Subclass (child level, accessible via an expandable drawer)
- The new design reduces complexity and improves usability, especially when working with large asset sets.
-
Improved Selection and Search
-
Expanding an asset class displays all associated sub-classes in a drawer view.
- You can:
- Select an entire asset class to include all its subclasses automatically
- Select individual sub-classes for more granular filtering
-
Added search functionality to the subclass drawer, enabling users to locate specific subclasses quickly.
-
The search is scoped to the active filter component for better performance and clarity.
-
- Backend and Query Enhancements
- The filter continues to use the existing multi-group API, ensuring backward compatibility.
- Filter payload structure has been enhanced from an array-based format to an object-based format for improved clarity and scalability.
- Query behavior:
- Multiple subclasses under the same class are combined using OR
- Multiple classes are also combined using OR
- Risk queries remain consistent with previous behavior
-
Saved Filters and Reusability
-
Users can save filters as templates and reuse them across sessions.
- Saved filters retain
- Selected asset classes
- Selected asset subclasses
- The same filtering behavior is supported across:
- Risk Prioritization
- Risk Reduction workflows
-
This enhancement does not impact existing risk calculation logic or projected risk score generation. Current scoring and prioritization results remain unchanged.
Introduced Asset Grouping by Class and Subclass in Risk Management and Dashboard
With this release, we have expanded the grouping and filtering capabilities on the Asset Listing page by adding support for Asset Class and Asset Subclass.
The new Group By options help teams organize and analyze assets by type, like compute, containers, applications, identities, or software. This enables teams to quickly focus on the most critical asset categories during investigations and planning for fixes.
The Asset Class and Subclass filters are available across:
- Risk Management (All, Vulnerabilities, Misconfigurations tabs)

- Prioritization (Vulnerabilities, Misconfigurations)
- Dashboard Widgets

By grouping assets by class or subclass, users can better understand exposure patterns, identify high-risk asset categories, and prioritize remediation efforts.
The Response tab does not currently support filtering or grouping by Asset Class or Asset Subclass.
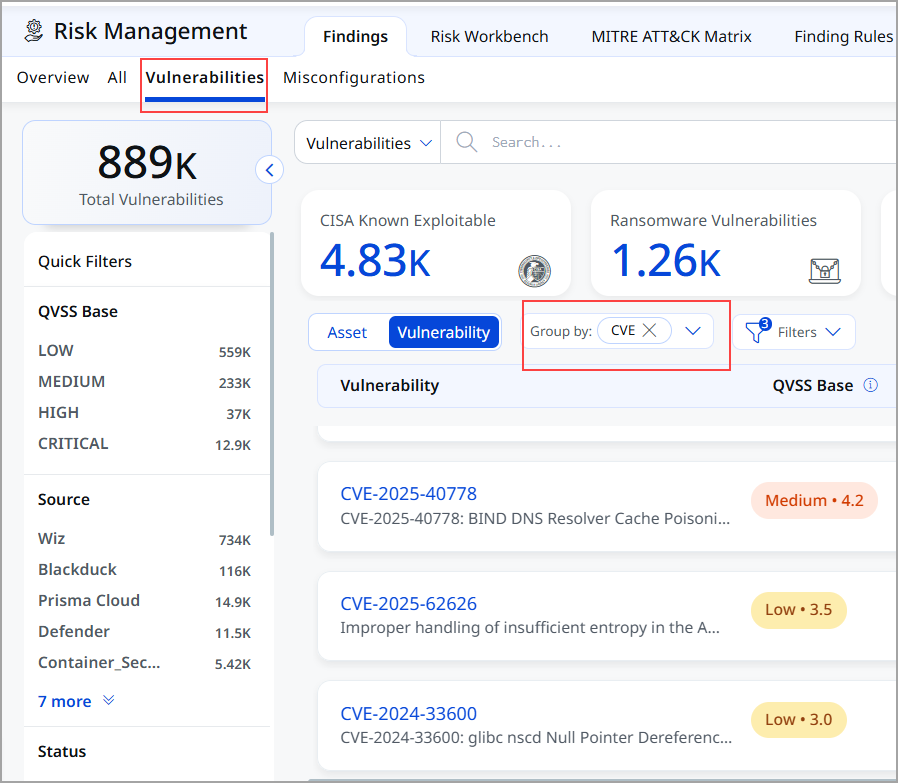
Improved Vulnerability Visibility with CVE Grouping
With this release, the Vulnerabilities tab is enhanced to improve visibility and prioritization. By default, vulnerabilities are now displayed in a CVE-grouped view, providing an instant, consolidated view of all CVEs present in your environment.
This CVE-centric view makes it easier to understand the scope and impact of each vulnerability by displaying impacted assets, exposure context, and risk indicators in a single location. Grouping by CVE helps security teams quickly identify the most critical issues, assess blast radius, prioritize remediation efforts, and track progress more effectively across the organization.
Introduced New Tokens for Findings Tab
| Token | Sub Tab | Description |
|---|---|---|
|
finding.qvss |
All Findings, Vulnerabilities, and Misconfigurations tab |
Use an integer value (0-10) to help you find vulnerabilities based on a specific detection score.
|
|
asset.class |
Assets |
Use this token to search assets by their primary class, such as Host, Application, Database, or Network Device.
|
|
asset.subclass |
Assets |
Use this token to search assets by their subclass, which provides a more granular type within the main asset class.
|
Issues Addressed
The following reported issues are fixed in this release.
| Component | Description |
|---|---|
| Unified Dashboard | Fixed an issue where ETM widgets were not populating trend lines. Trending data is now correctly displayed when queries are applied. |
| Unified Dashboard | Fixed an issue where widget count sorting was not working correctly. Code changes have been implemented to ensure accurate and consistent sorting. |
| Unified Dashboard | Fixed an issue where a Manager User encountered a dashboard crash when accessing the External Web Apps – Build dashboard. The dashboard now loads correctly, including in incognito browser sessions. |
| User Interface | Fixed an issue where users encountered an Unauthorized access error when attempting to view asset details, even though the user account had the required roles, scopes, and permissions assigned. With this fix, authorization handling has been corrected, and users with valid permissions and scoped asset access can now view asset details successfully across all affected applications. |
| Risk Management | Fixed an issue where the ETM Purge Report UI encountered an OutOfMemoryError while downloading extensive purge reports. Memory handling has been improved, allowing purge reports to be successfully generated and downloaded as a ZIP file even for large datasets. |