Once you have your search results you may want to organize them further into logical groupings.
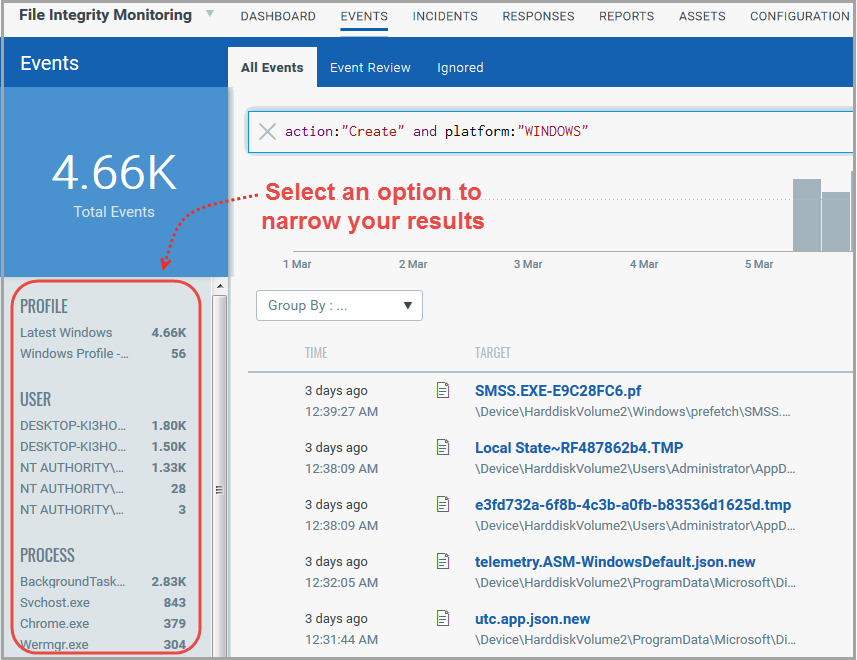
Enter a search query on the Events tab and get your results. Then choose a group by option on the left side. You'll see the number of events per grouping. Click on any grouping to update the search query and view the matching events.

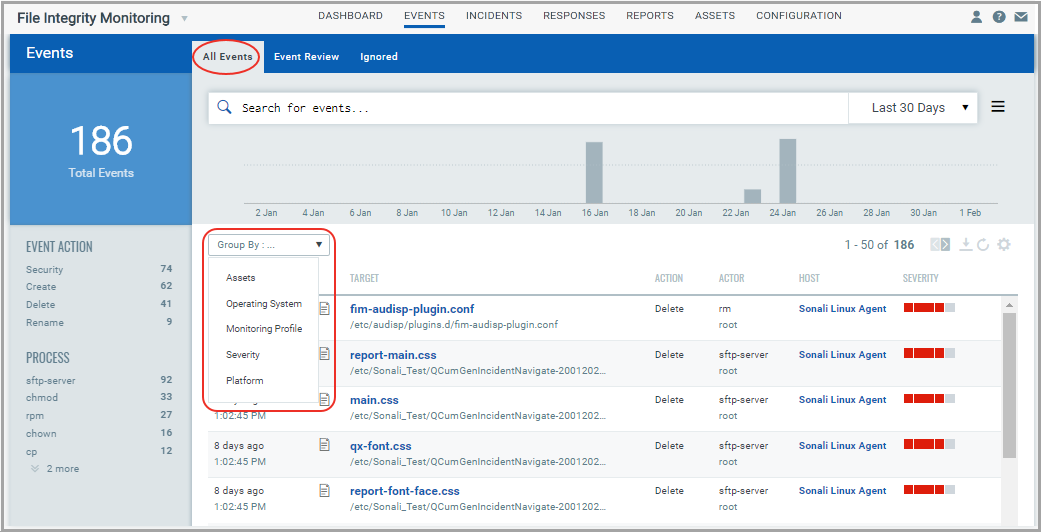
You can view the total count of events by Assets, Operating System, Monitoring Profile, Severity and Platform in the All Events tab. To view the count of FIM events by any of the filters, go to Events > All Events tab, select a date range and select a filter from Group By drop-down.
