Asset Details
This section gives you a detailed and consolidated view of an asset, including information on asset inventory, security posture, compliance posture, and sensor information for all interfaces. This detailed information includes IT and security data. It helps users understand security risks, policy, and compliance violations, and IT data such as licenses, end-of-life dates, and network connections. Users can flag issues and any such problems.
To view asset details, navigate to Inventory > Assets and then click View Details under the Quick Actions menu for an asset. You are navigated to the Asset Summary of that asset.
Expand the following sections to view more information:
Asset Inventory gives you deep visibility into the assets, granting you a detailed, multidimensional view of each one that encompasses its IT data, such as:
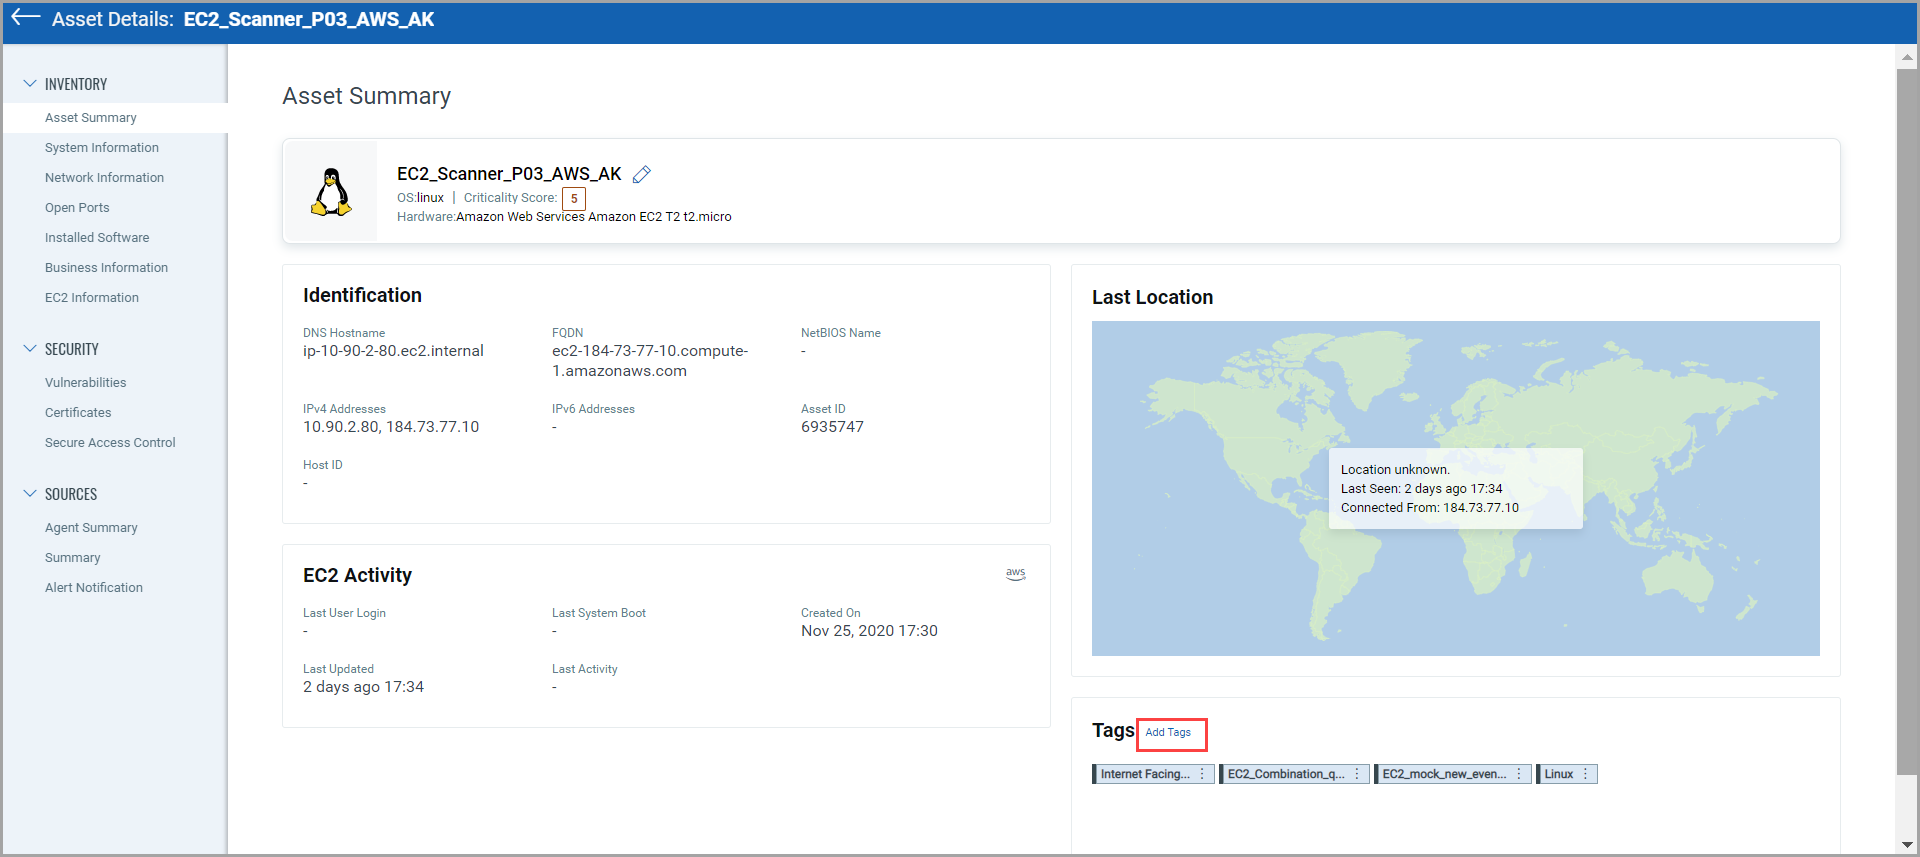
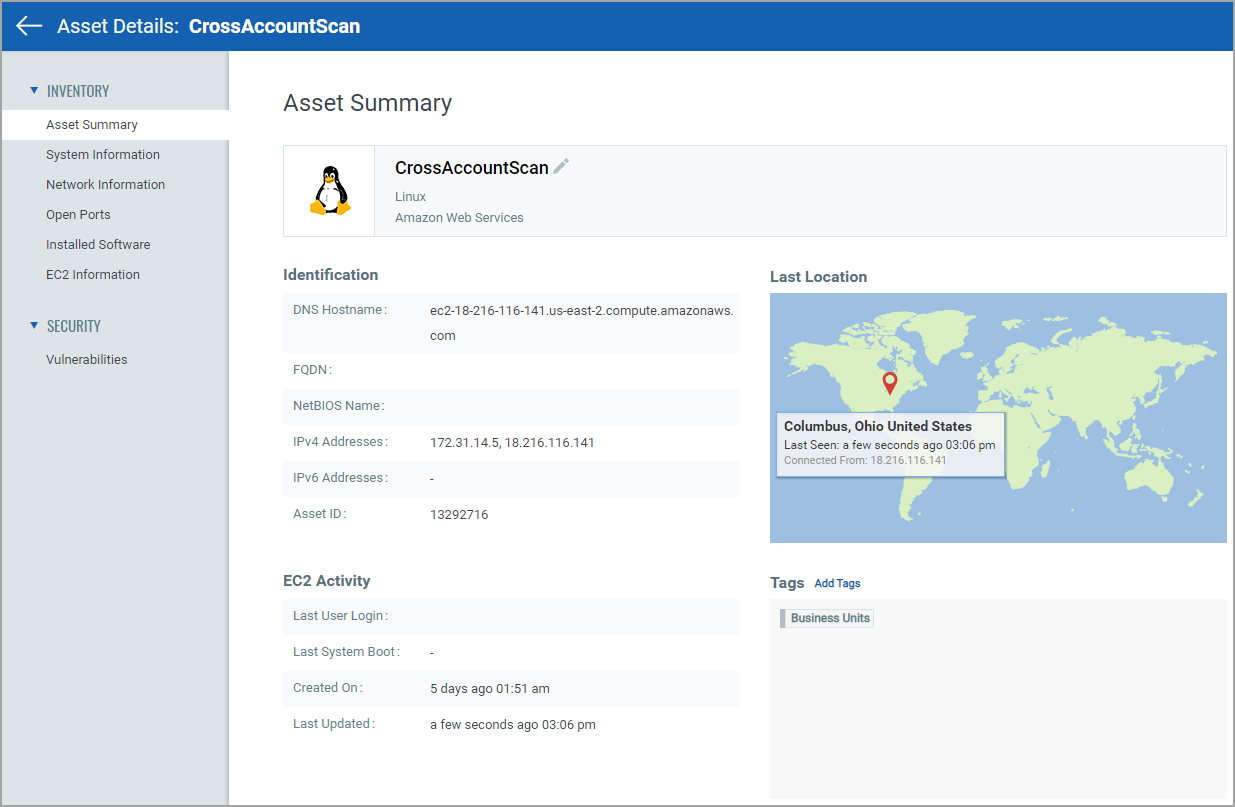
Asset Summary: Gives you detailed information to identify the asset, activity on that asset, last location from where the asset was accessed and different tags assigned to the asset. You can also add tag to the asset from this page.
You can see details, such as EC2 Activity, Identification information, and tags assigned to that asset.
Note:
- From the tags section, by clicking Add Tags, you can add static and dynamic tags to that asset. Also, by clicking Remove Tag, you can remove the static tag that is assigned to that asset. Note that you cannot remove dynamic and system-defined tags assigned to that asset. The Remove Tag option is shown only for static tags.
- You can also edit and view static and dynamic tags from the Tags section.
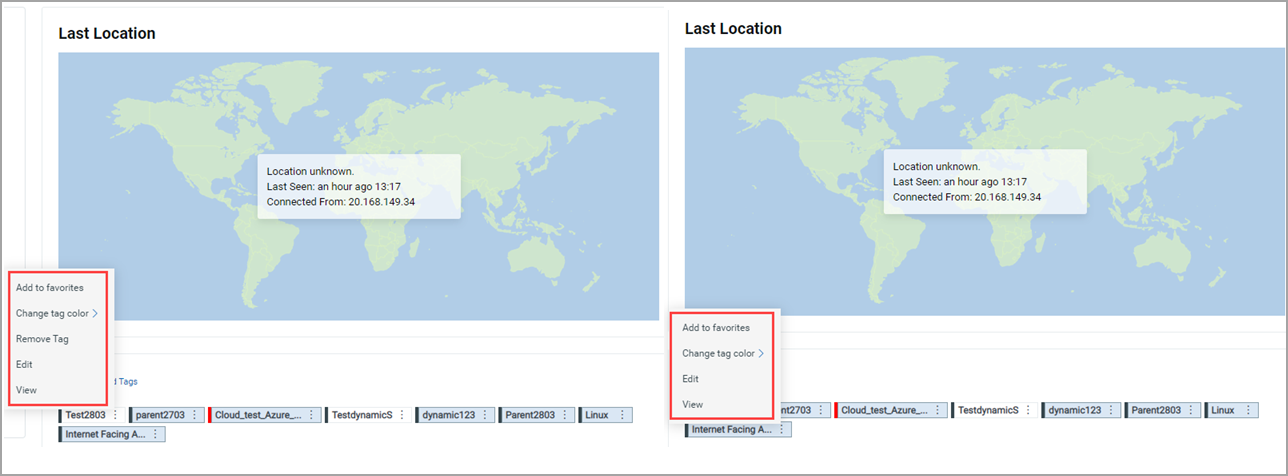
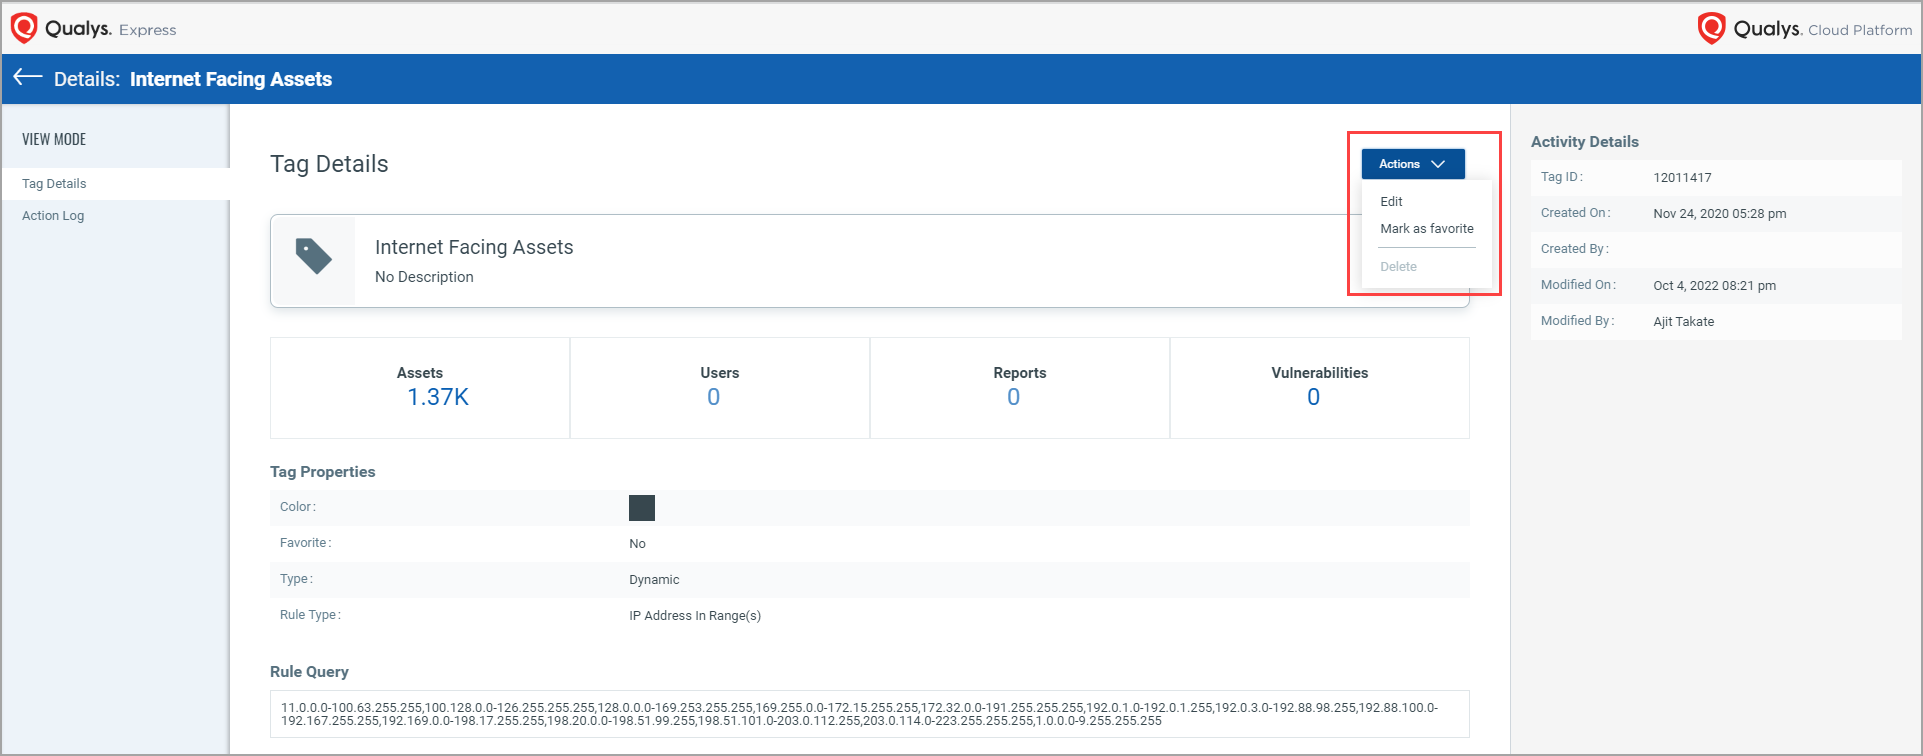
When you click View to see the tag details, a new "Tag Details" page opens, wherein you can see the tag details.
When you click ctrl + View, the “Tag Details” page opens in the next tab.
You can also edit or mark the tag as a favorite by clicking Actions from the Details page.
For Alibaba cloud instances, you can see Cloud Agent and ALIBABA icons in the Agent Activity section from the Asset Summary tab.
![]()
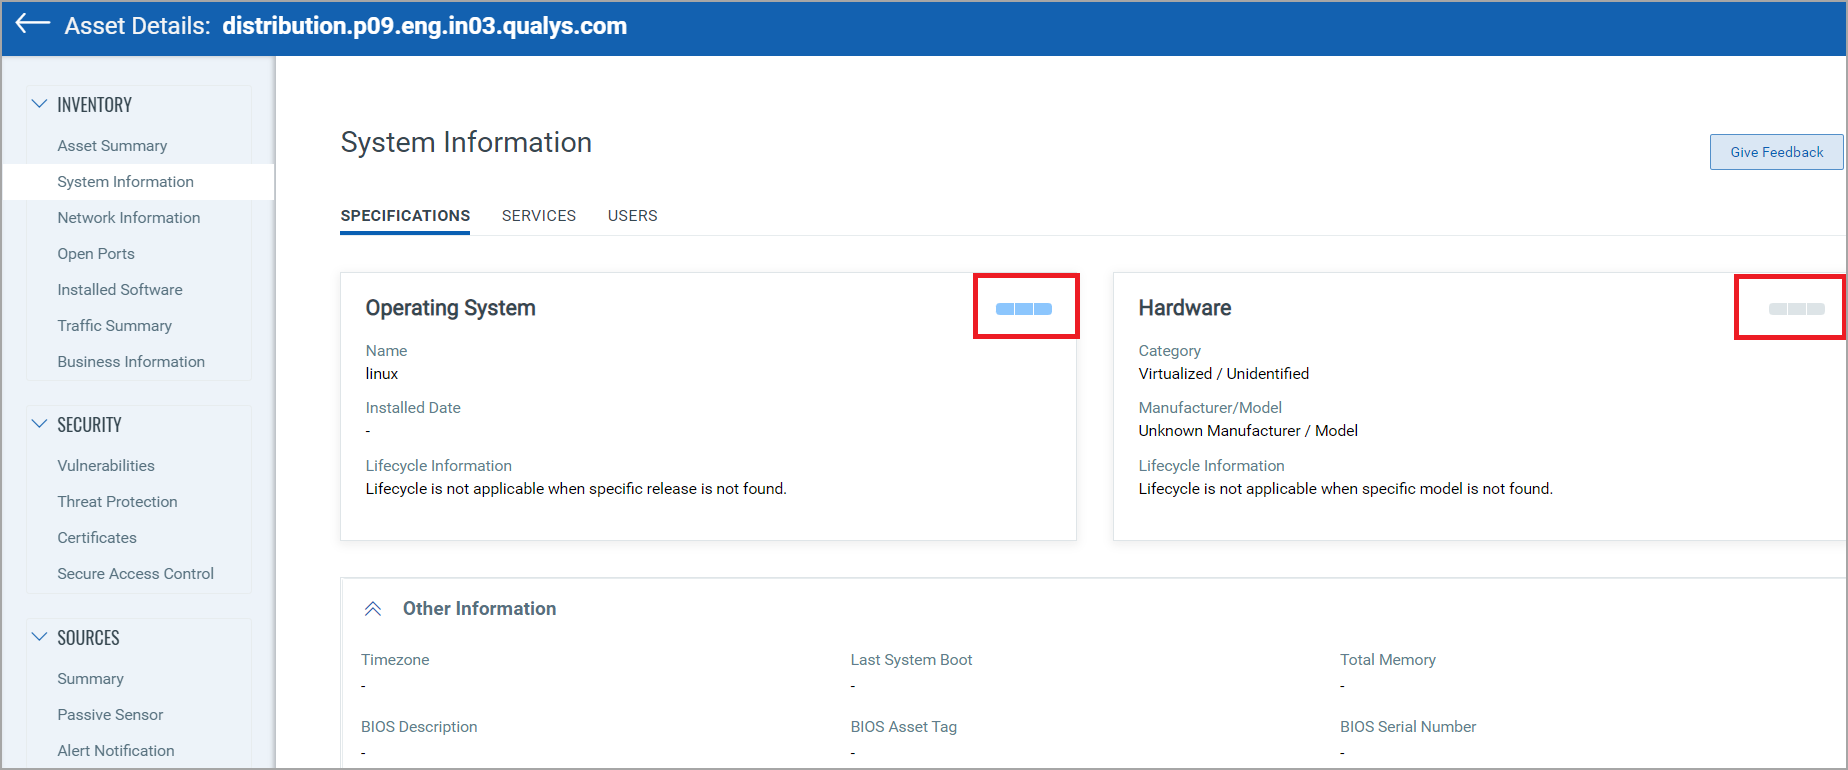
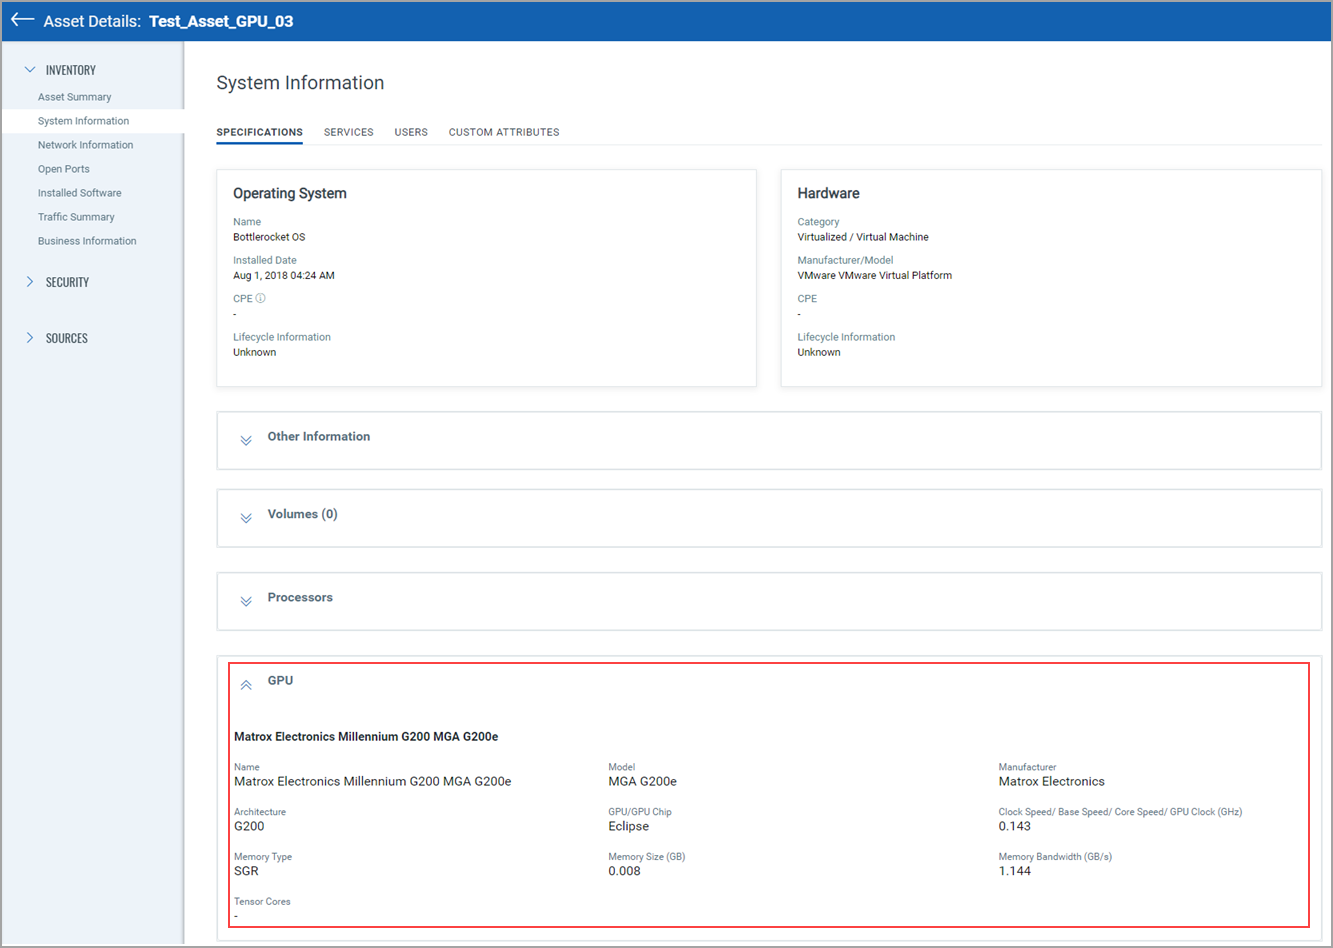
- System Information: Gives you system information such as hardware specifications (detailed information for operating system, hardware, volumes, processors, etc.), services, and users. For all assets, except the ICS_OCA tagged assets, you can submit your feedback by clicking ‘Give Feedback’. For more information about ICS_OCA tag, see Manage Asset Tags.
With the PS 1.5.0.0 release, the "Unmanaged" asset listing view is now homogenized as per the "Managed" and "All" asset listing view page. The Operating System Confidence and Hardware Confidence are no more shown in the "Operating System" and "Hardware" columns on the asset listing view page. The OS Confidence as was seen under the "Passive Sensor Assets" dropdown prior to PS 1.5.0.0 is no longer shown in the left side pane. Instead, confidence is shown on the “System Information” page of the asset details in the "Operating System" and "Hardware" tiles".
You can now view the CPE details for the Operating System, Hardware, and Software from the System Information tab.
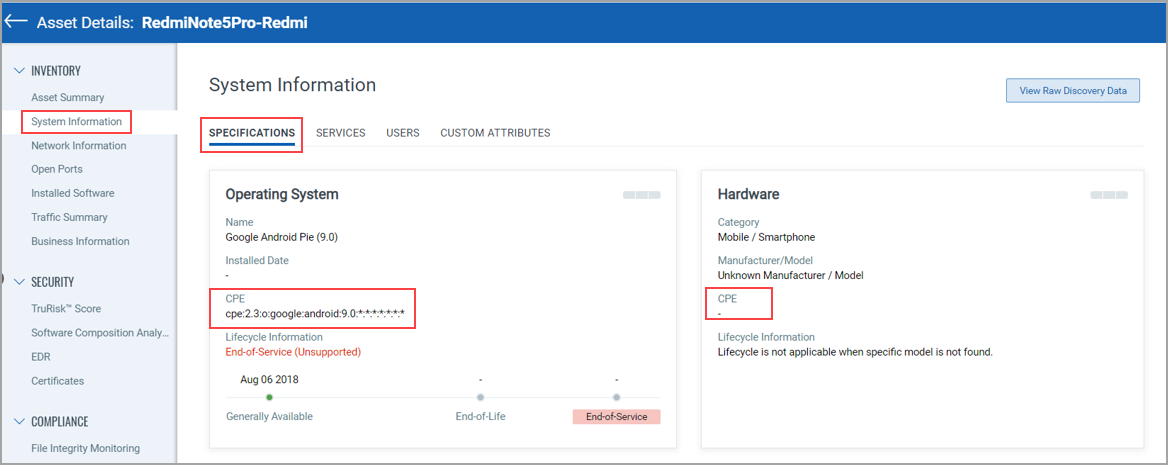
If the CPE values for the matching Operating Systems, Hardware, and Software are available in our catalog, the CPE details are shown. Otherwise, they are not shown.
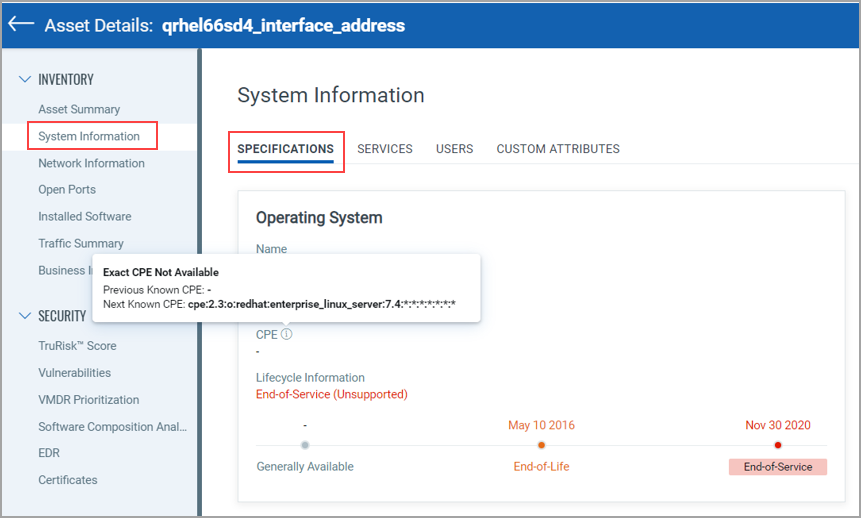
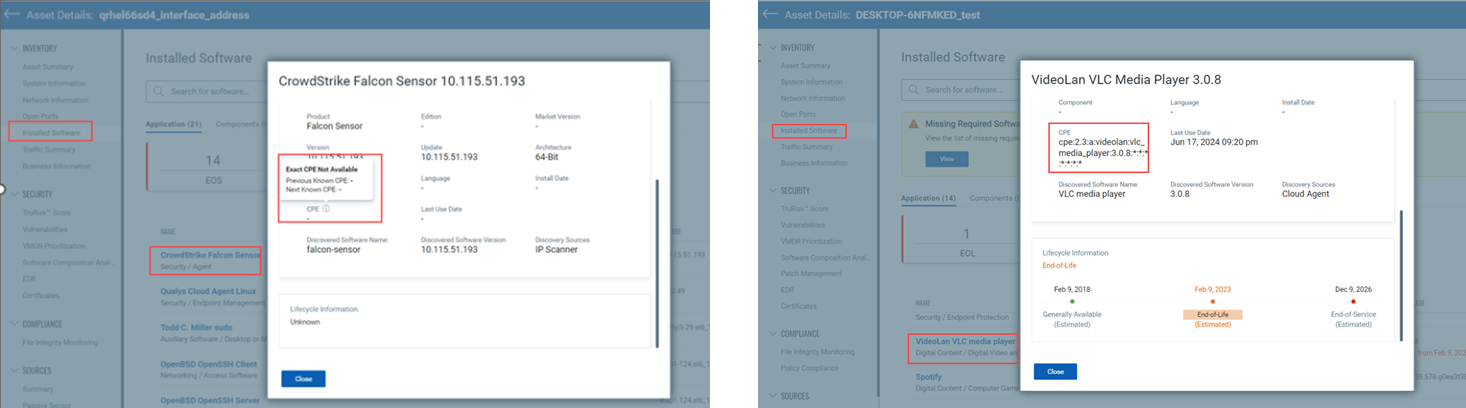
If the current CPE value is not available, only for the Operating Systems and Software, the previous and next CPE information is visible after hovering over the info text icon.
You can view the assets with the Graphical Processing Units (GPU) required for AI processing. If the GPU data is not detected for an asset, the values are shown as (-), and no details are shown in the GPU section if the GPU is not mapped.
- Network Information: Gives you information for the network connection to the asset.
- Open Ports: Gives you list of open ports and services running on those ports.
- Installed Software:
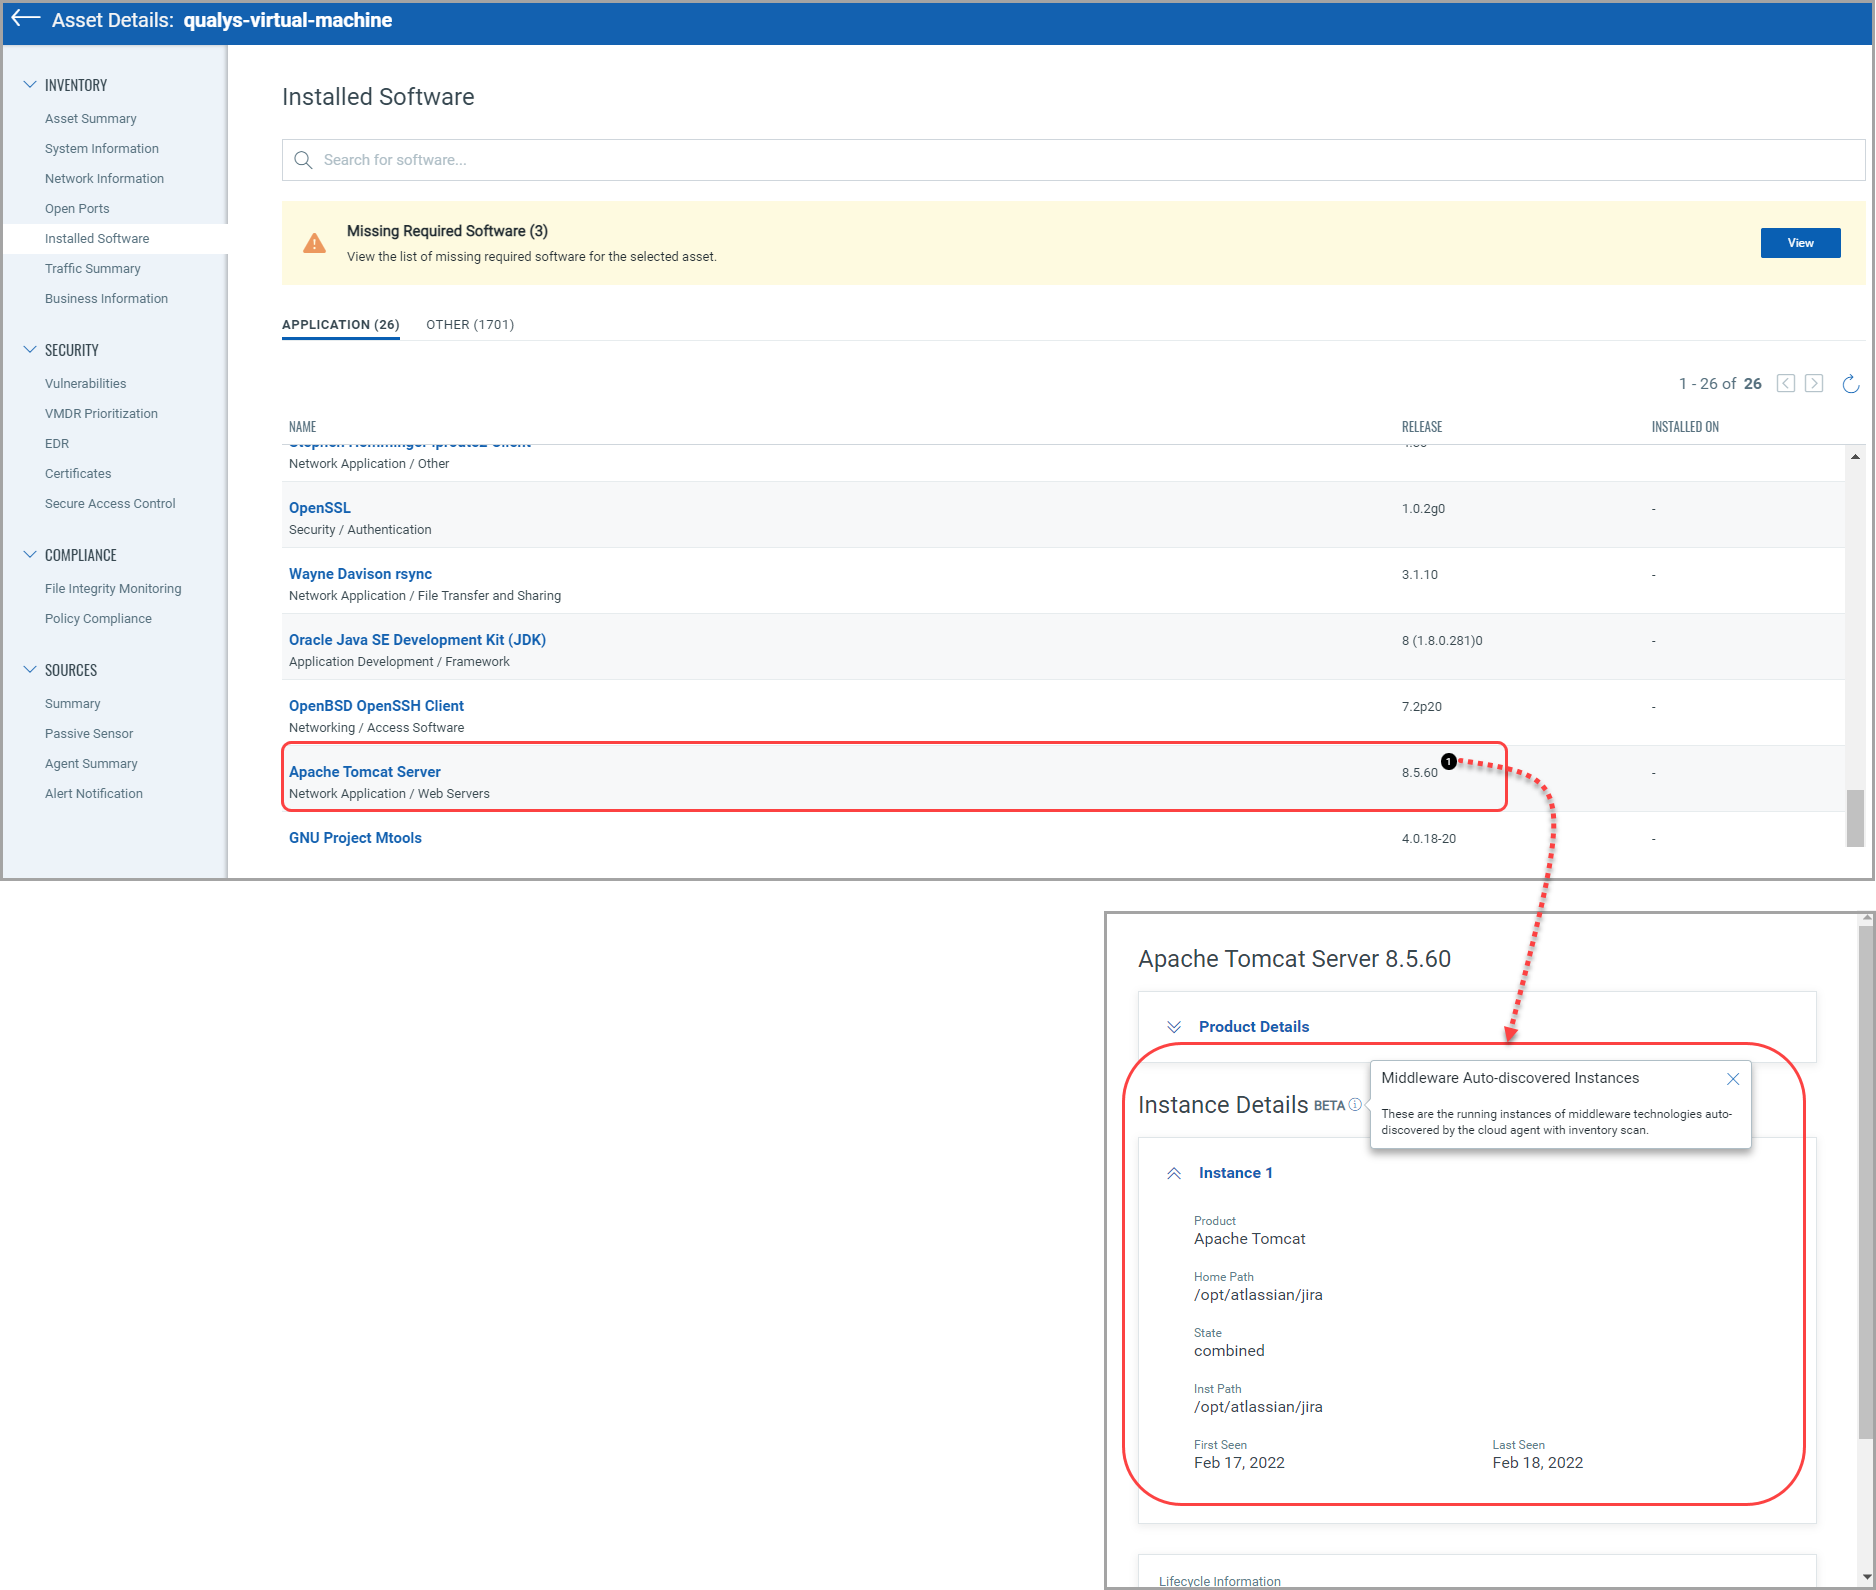
(1) Gives you list of software installed on the asset. This helps you identify the software version, end of license date, etc. For PC-enabled subscriptions, you can see the running instances of middleware technologies auto-discovered by the cloud agent (only Windows and Linux platforms) with inventory scan. Refer to the article which lists the middleware technologies that are auto-discovered by Cloud Agents for Policy Audit (PA).
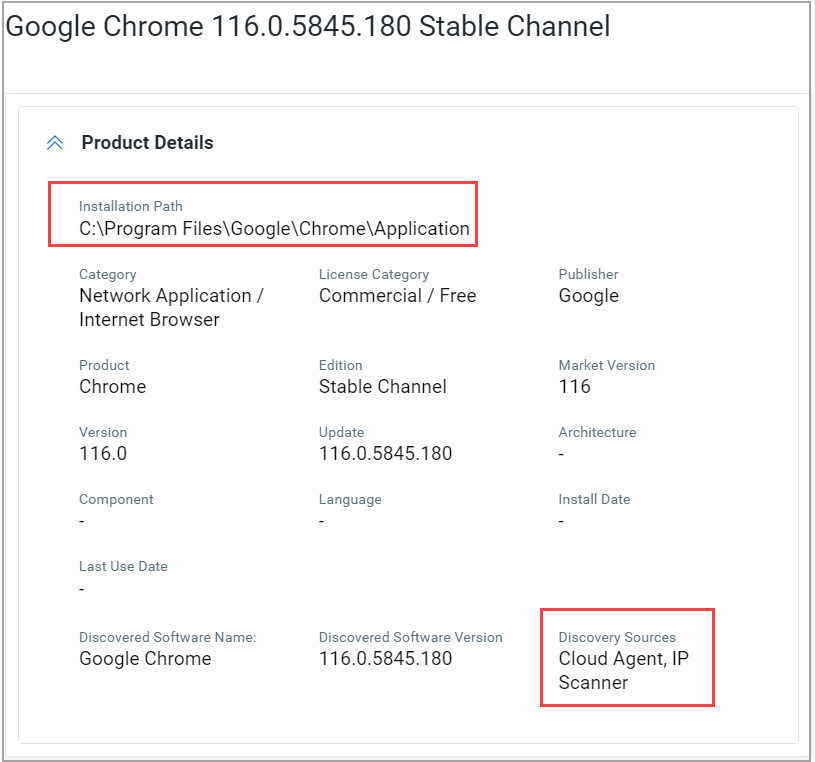
(2) For almost all Windows Cloud Agent assets, you can now see the software's Installation Path and Last Use Date details.
Prerequisites:
- Windows Cloud Agent version 5.5
- The Windows prefetch file from the Cloud Agent
The coverage or the number of software detected is now substantially increased with the help of the Windows prefetch file. If the product name and software version details from the prefetch file match the corresponding software name and version identified during the Cloud Agent scan, then the software's Installation Path and the Last Use Date details are shown.
(3) You can also download a list of software in the Application/Others category installed on the asset by clicking on the download icon, as shown in the following screenshot.
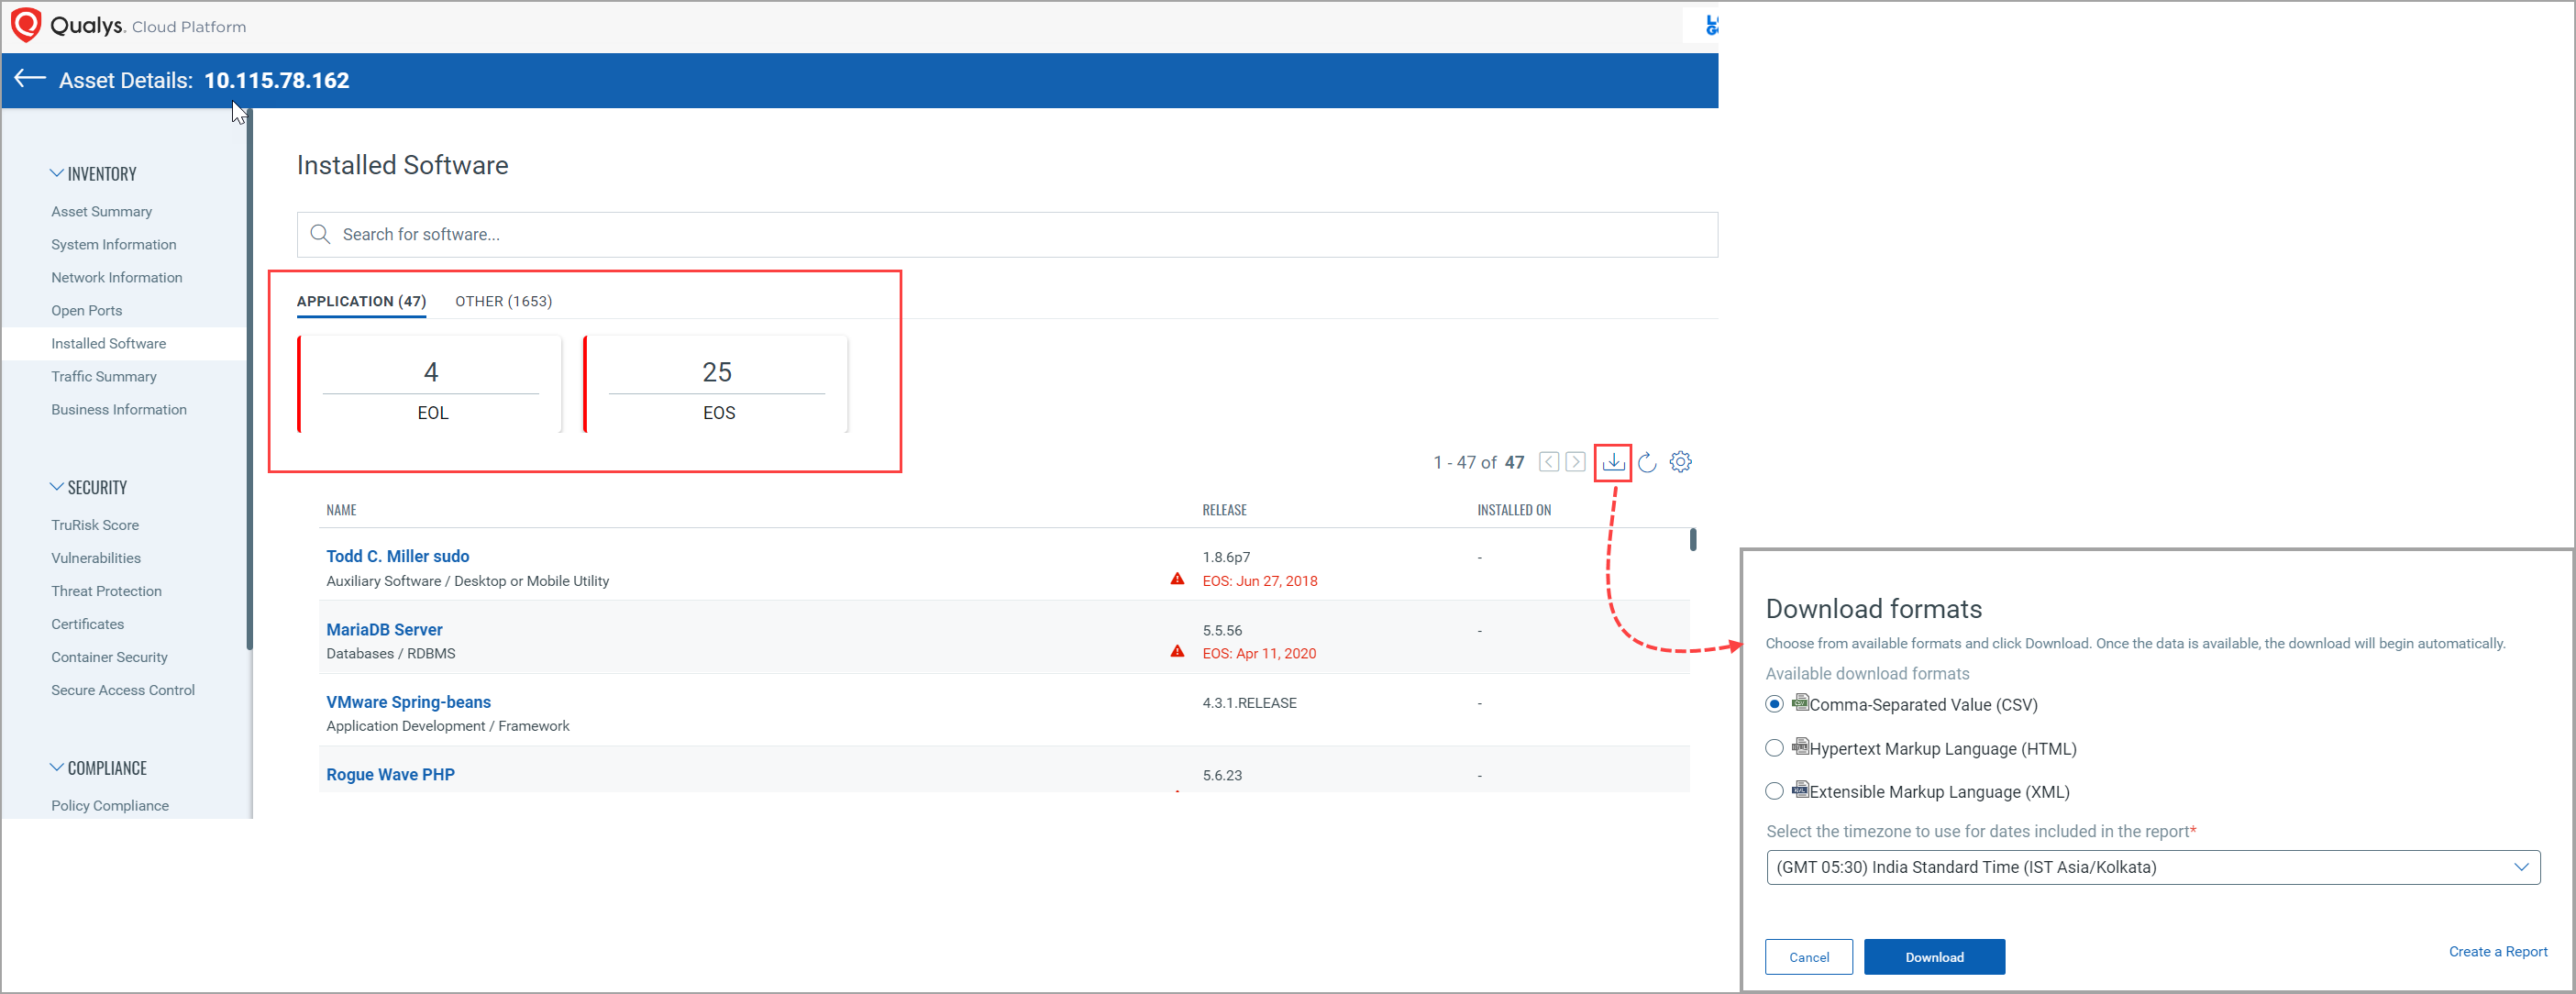
Select the timezone from the drop-down list to use it in the report for the dates and choose available download formats (CSV, HTML, XML). Click Download.
In the following example shown, for the “qualys-virtual-machine” asset, you can see “Apache Tomcat Server” middleware technology has 1 running instance.
- Alibaba Instance Information: You can see the Alibaba Instance Information tab in the Inventory section for Alibaba instances. You can find the details about the Alibaba instance, such as Hostname, FQDN, Host ID, and so on. 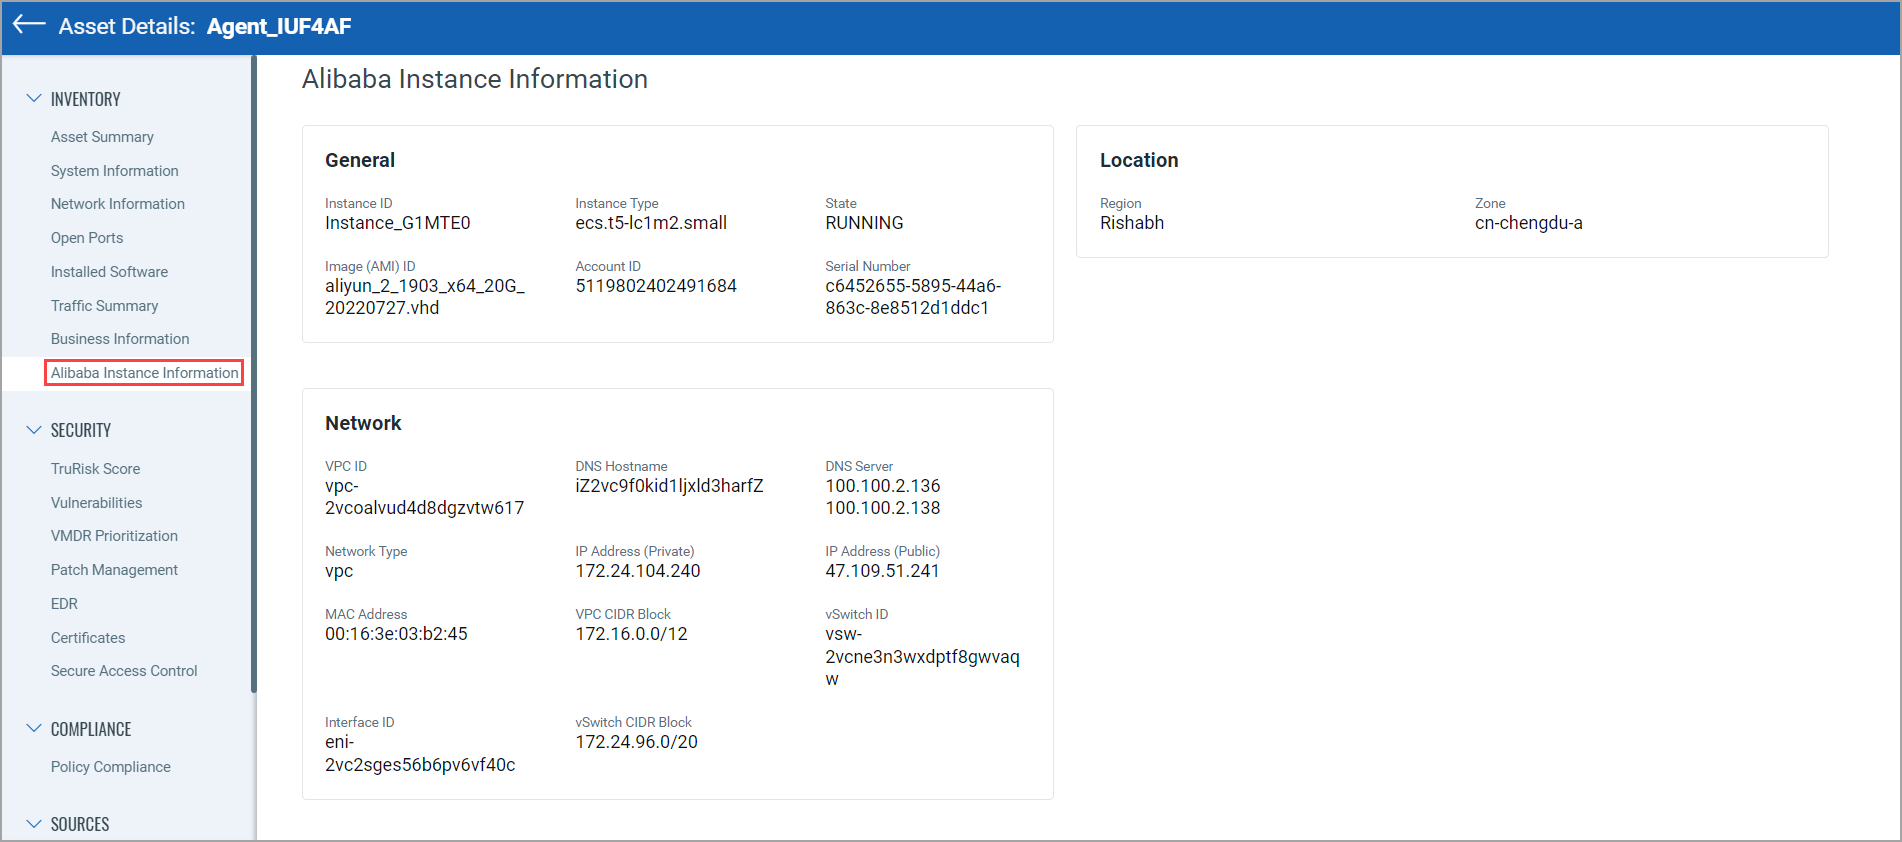
Find where your assets are located!
We’re now tracking geolocation of your assets using public IPs. Asset Geolocation is enabled by default for US based customers. For an asset that has an associated public IP, you’ll see its last location on a world map in Asset Details > Asset Summary.
How it works
- We’ll check the asset’s network interfaces for a public IP
- Asset that has an agent installed - we’ll check the IP reported by the agent
- AWS/EC2 asset - we’ll use the EC2 instance public IP
- Asset associated with a network - we will look for a public IP associated with the scanner used
If no public IP is found, we’ll show the location as unknown.
Want to enable (or disable) Asset Geolocation? Sure no problem. Just contact Qualys Support or your Qualys Account Manager and we’ll help you out.
This asset was last seen in Columbus, Ohio at 3:06 pm.
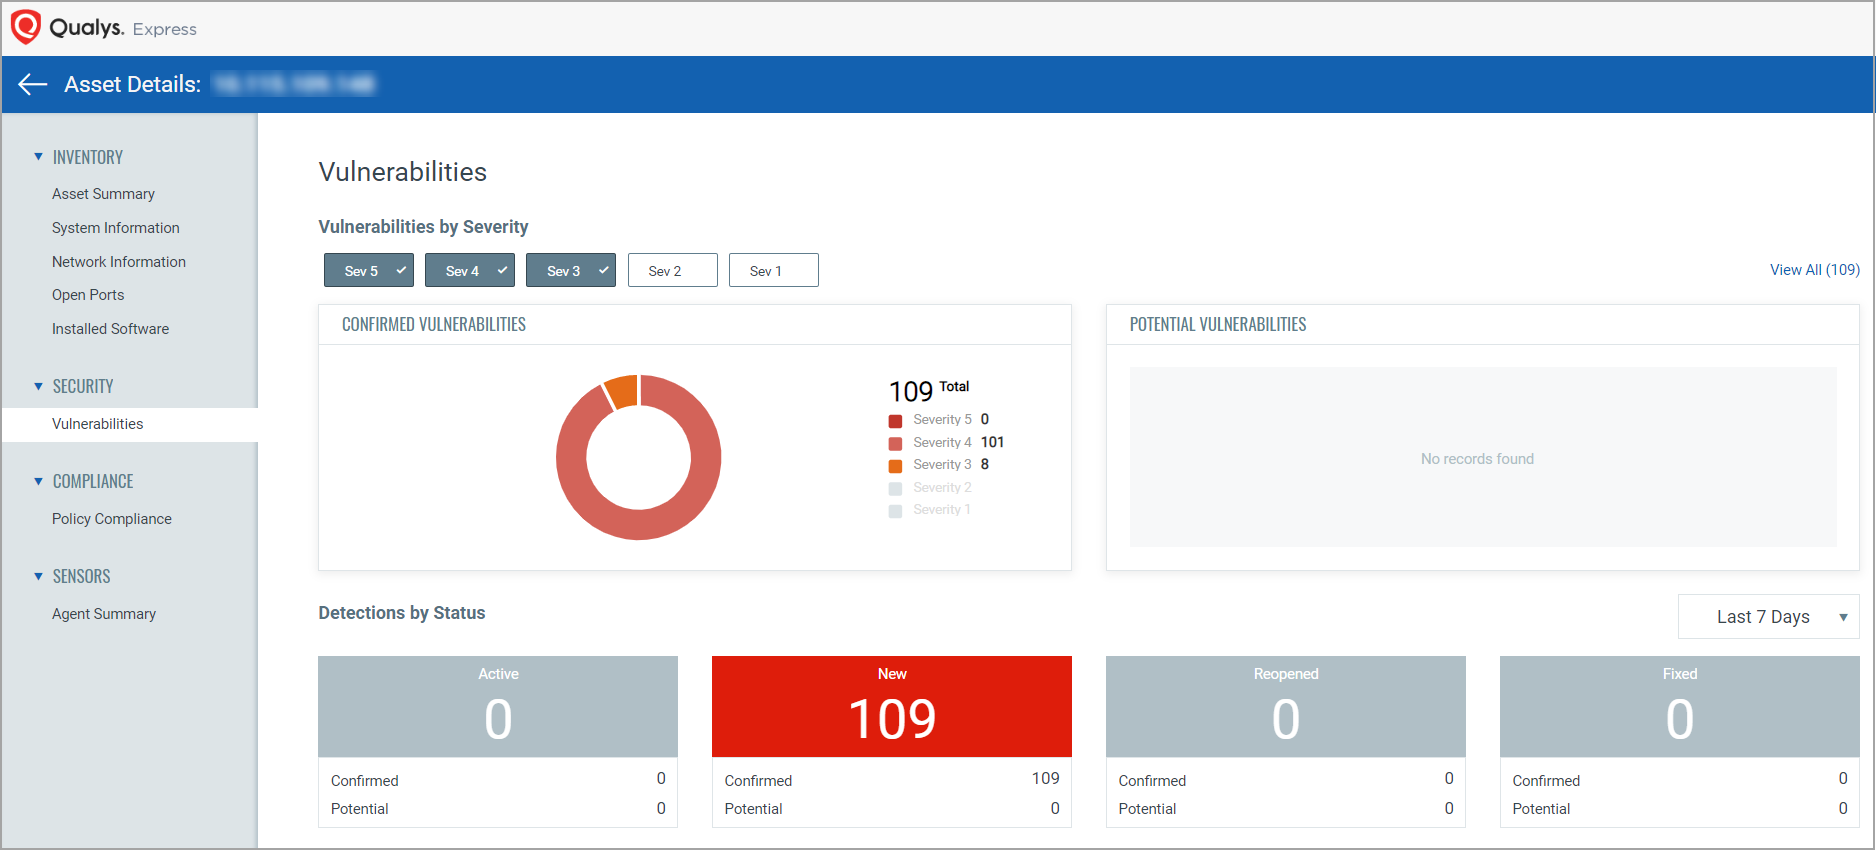
This section lists security posture for the asset. It gives summarized view for potential and confirmed vulnerabilities on the asset. You can view vulnerability details, apply patches and monitor possible malware.
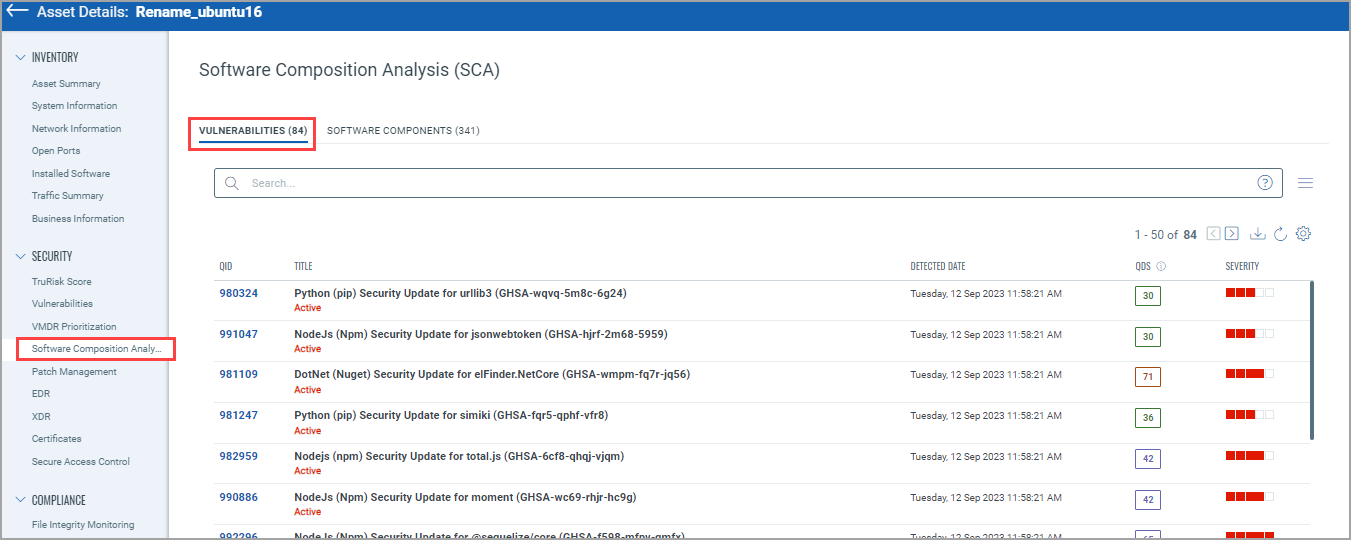
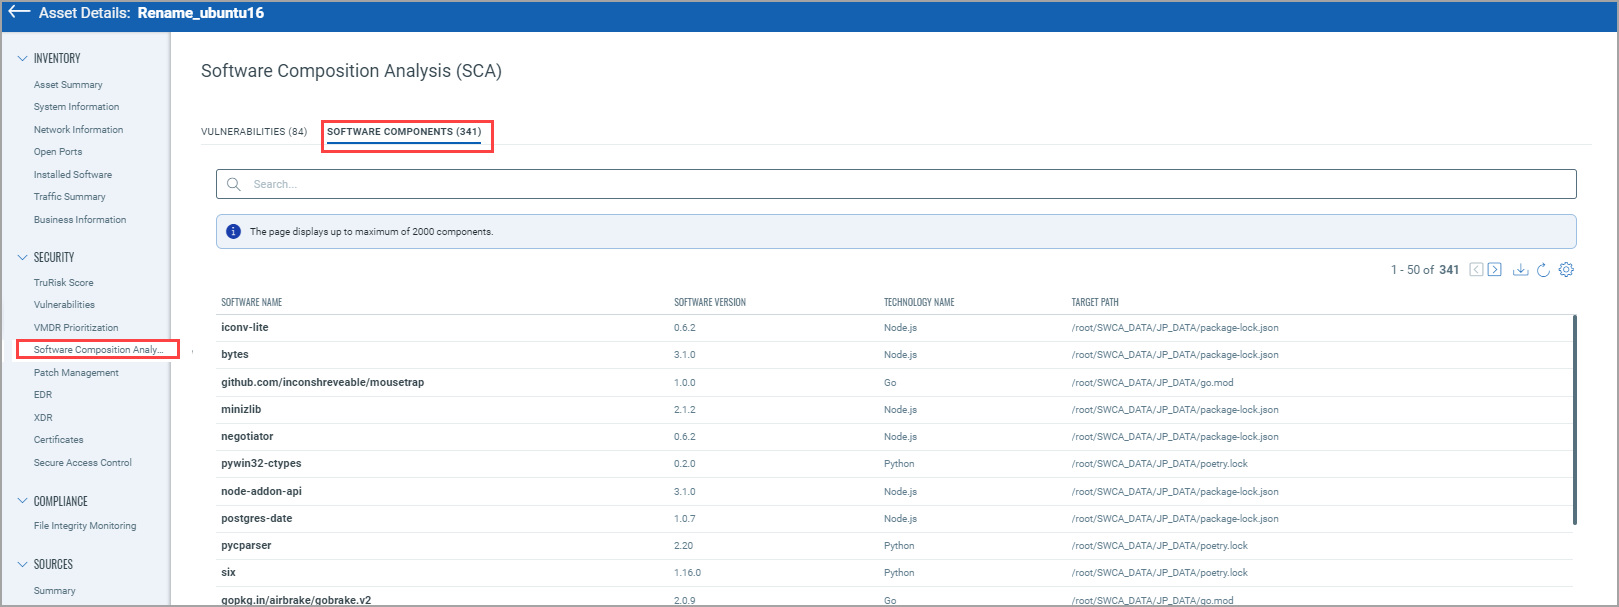
Software Composition Analysis (SCA): With the software composition analysis (SwCA) feature, cloud agents discover and report software components and vulnerabilities associated with third-party or open-source dependent software used by Qualys applications. From the Software Component Analysis tab, you can see the Software Components and Vulnerabilities identified. Currently, the following software technologies are supported to detect software component data: Ruby, Node.js, Go, Rust, PHP, Python, Java Platform, and Standard Edition (Java SE).
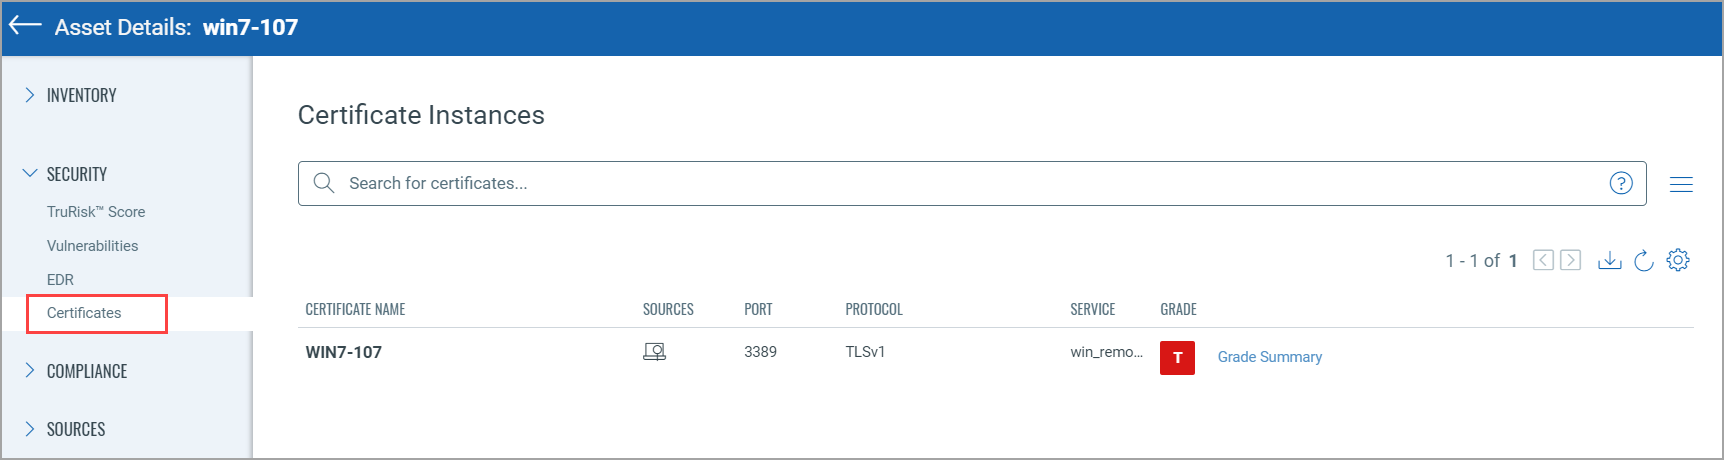
From the Certificates tab, you can see Certificate instance details, such as certificate name, protocol, and service.
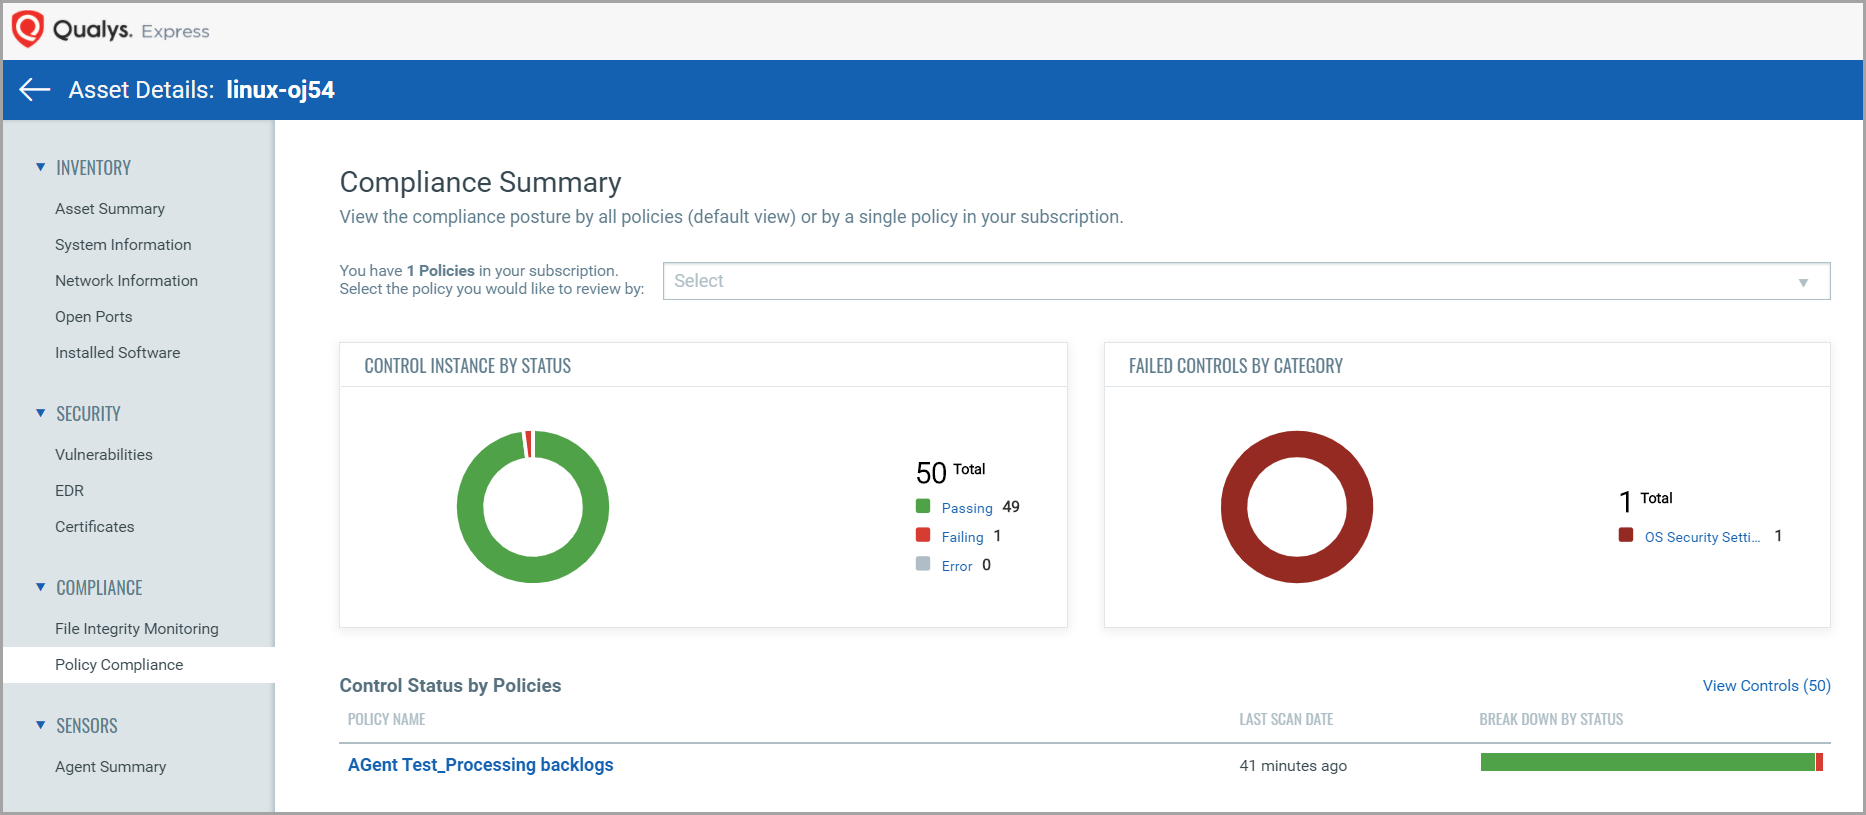
This section shows compliance posture by a policy or all policies in your subscription.
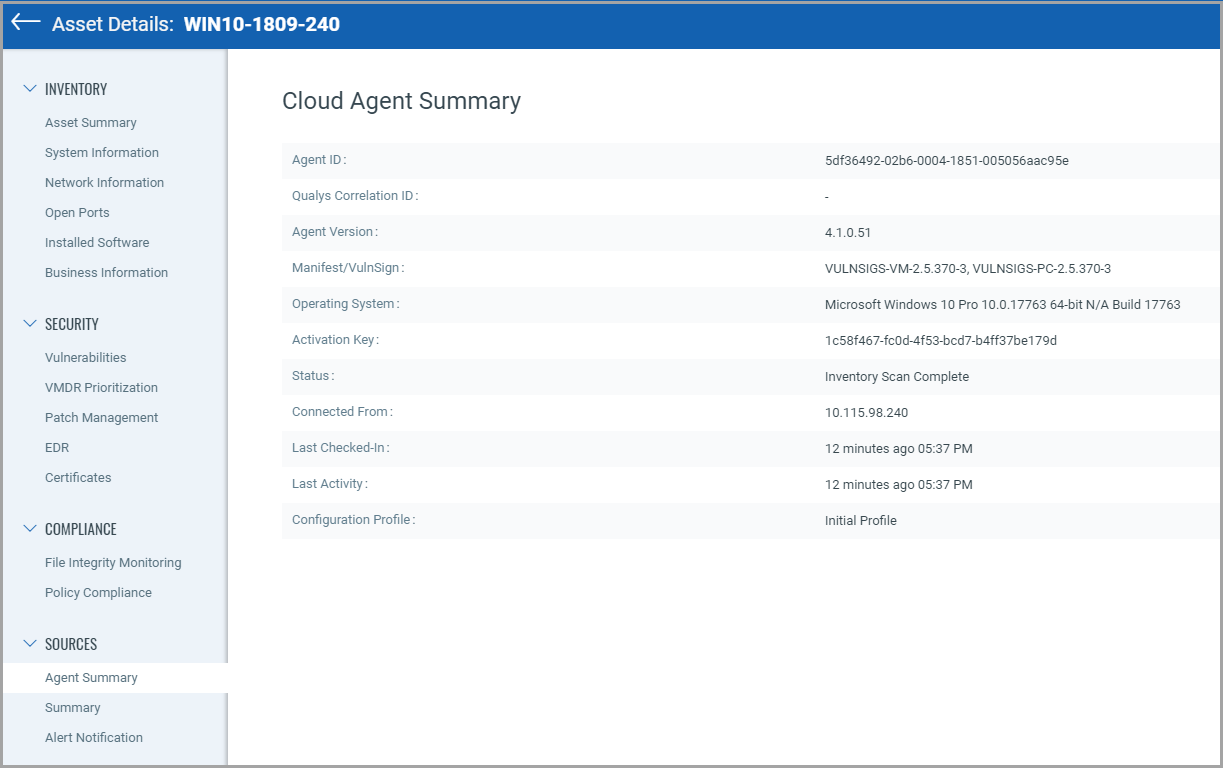
Agent Summary gives information of the agent from where the asset is collected.
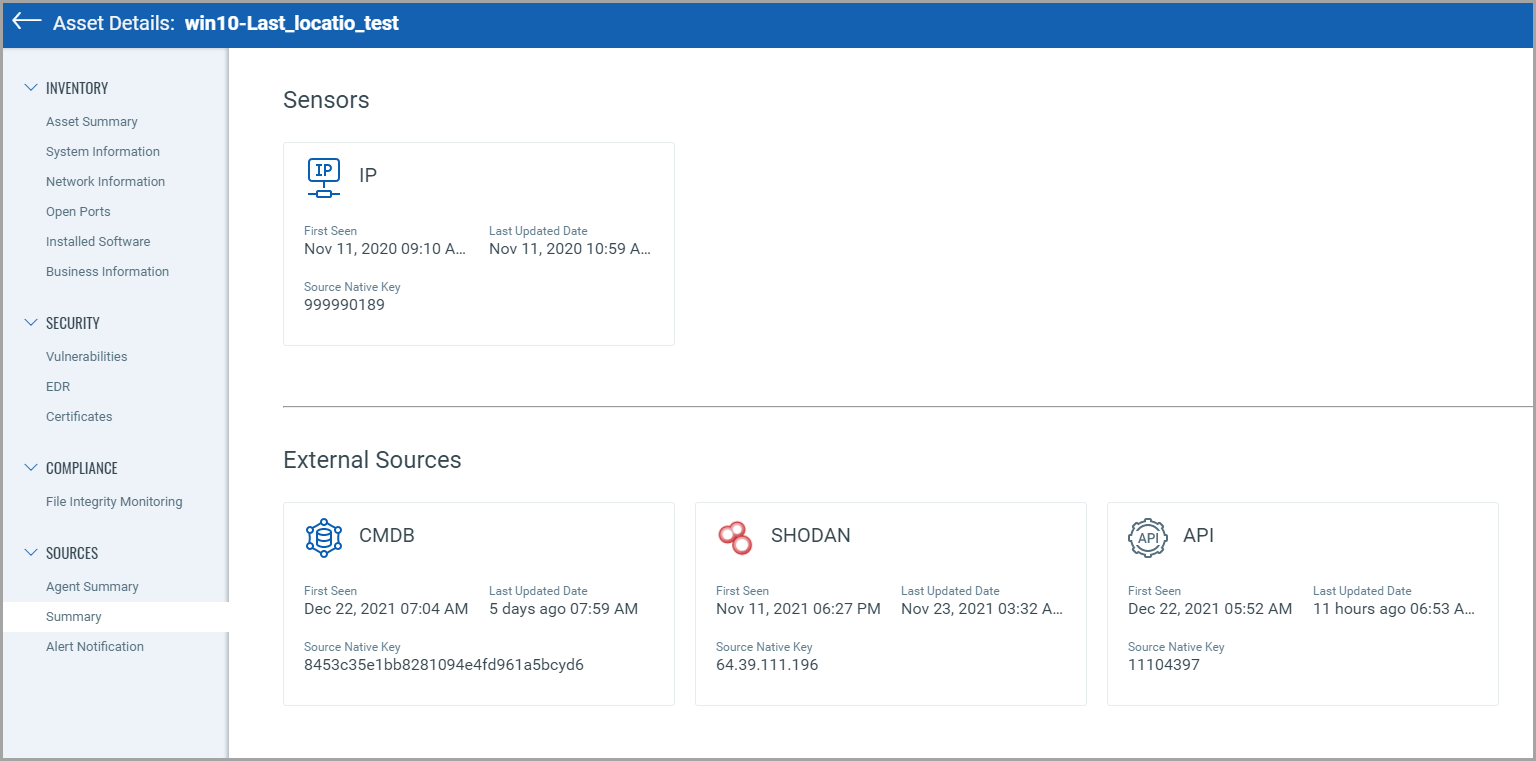
Summary gives information of different sensors and external sources.
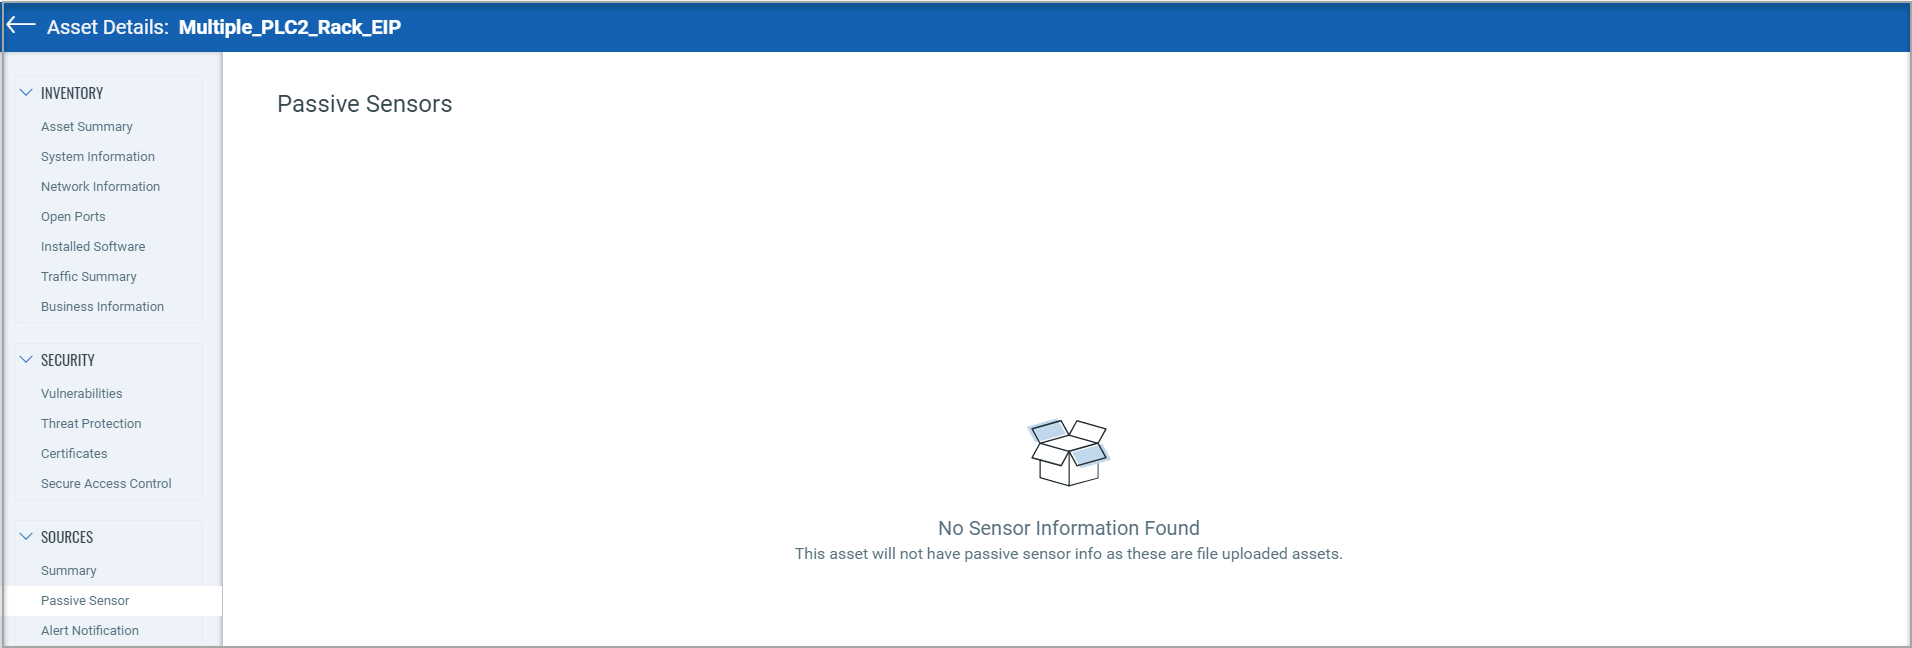
The "Passive Sensor" page provides the details of the sensor that reported the asset. However, ICS_OCA tagged assets are created from the project file that is uploaded by the user in the "ICS module". Hence, the passive sensor information is not applicable for such assets and therefore not shown on the 'Passive Sensor' page.
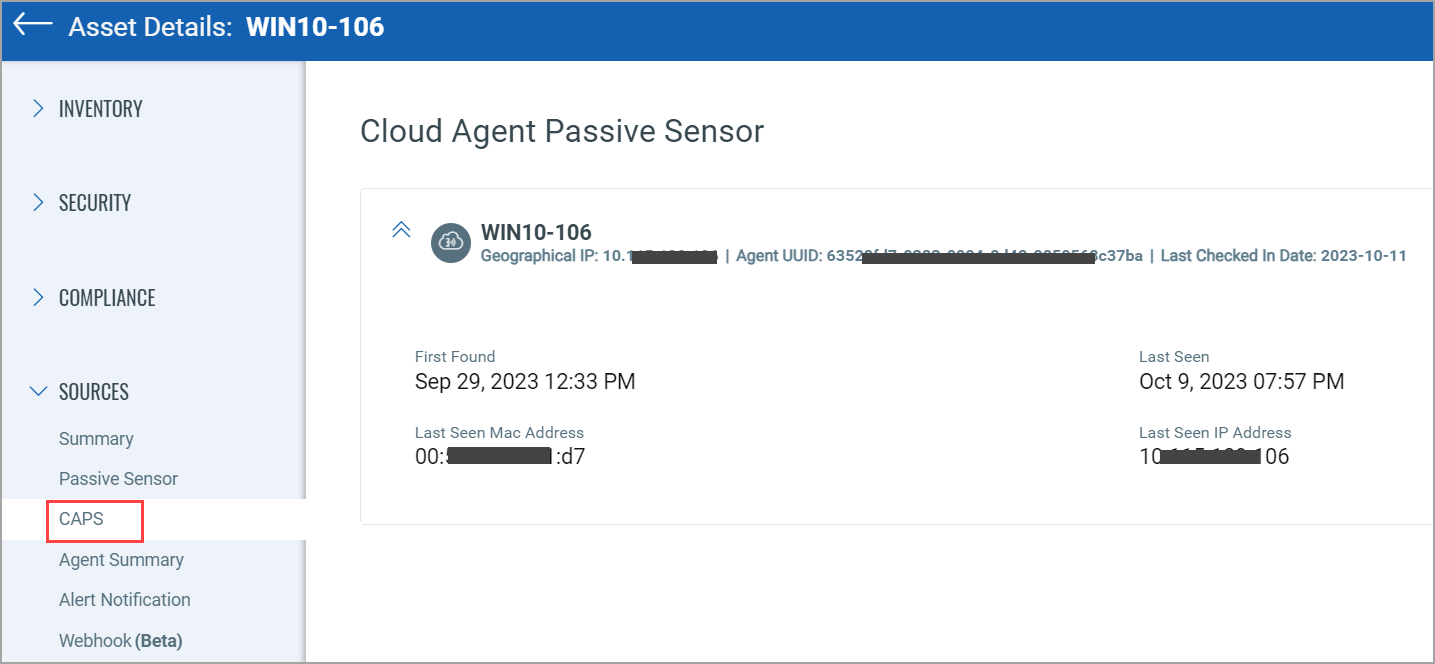
CAPS:
You can see detailed information about the asset discovered by CAPS from the Inventory > Sources > CAPS tab, such as Agent UUID, First Found, Last Seen, and so on.