Overview
To overview all the reports, the go to Qualys CMDB Bi-directional Sync App > Overview. The Overview page displays a consolidated view of all the reports. If you view this page before syncing the assets, it may display all values as zero.
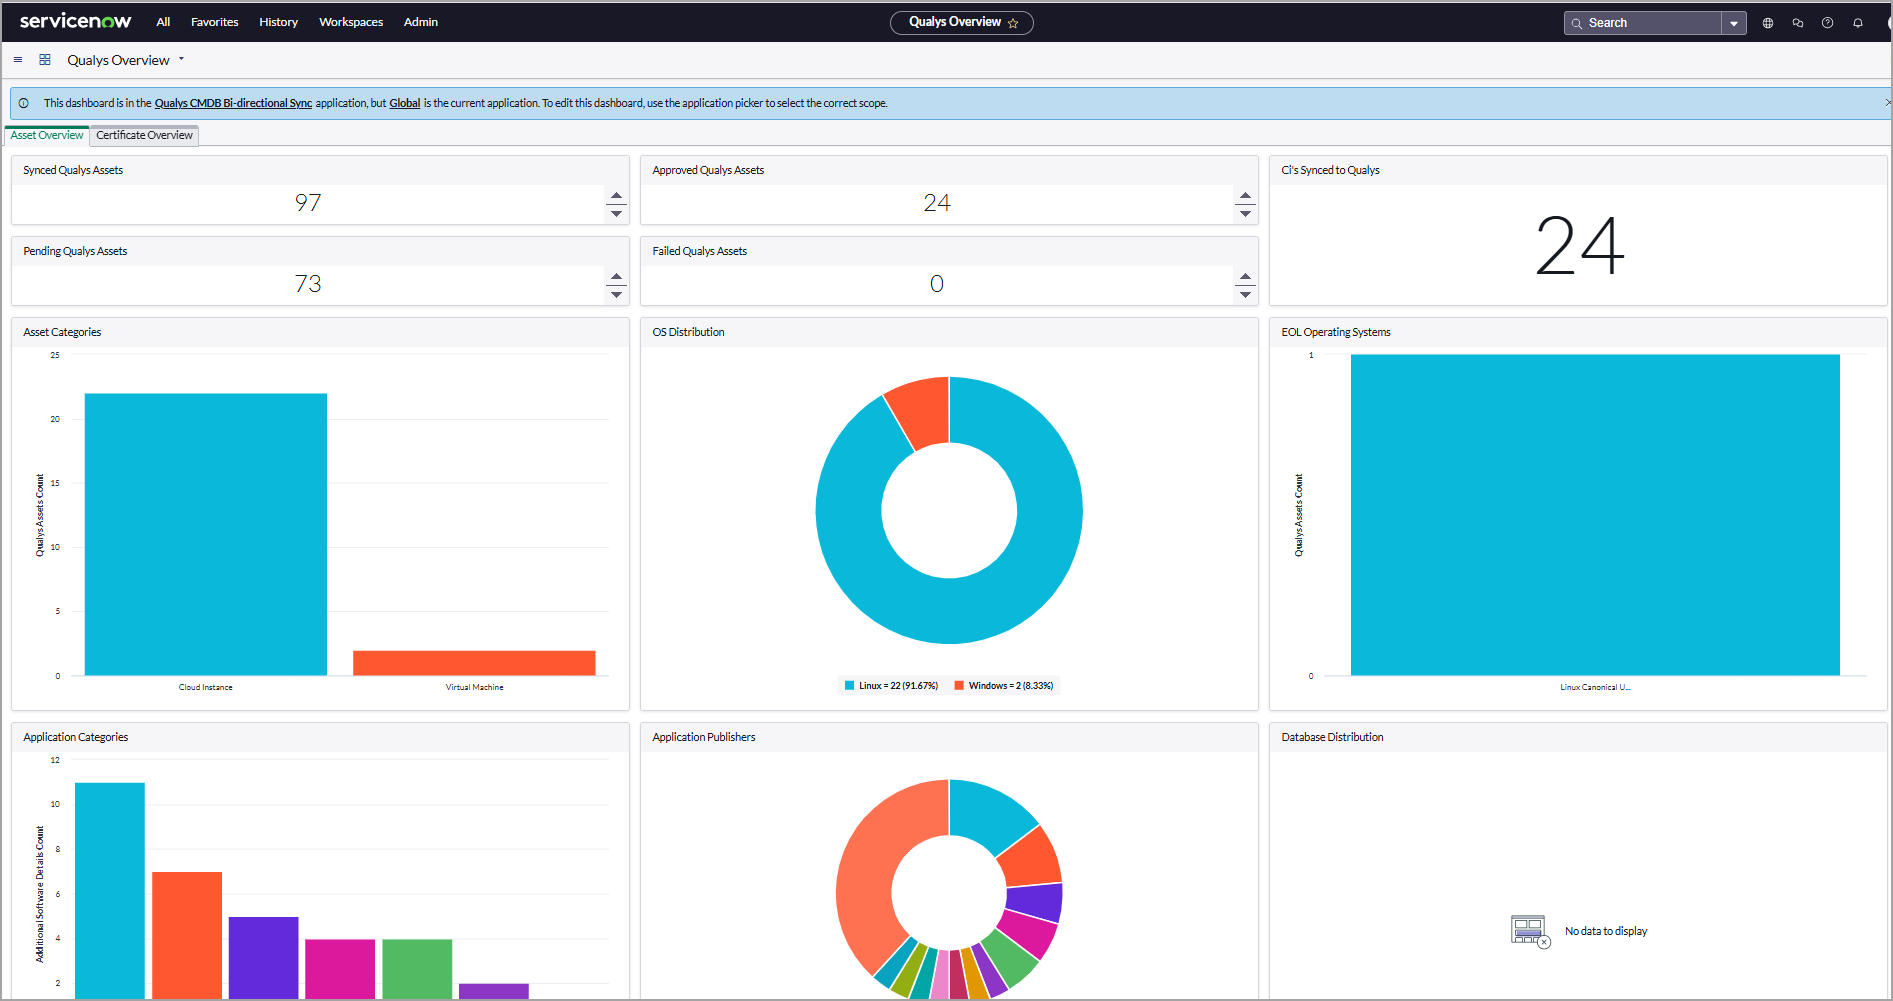
From v1.3.1, to populate the data in the Application Categories, Application Publishers, Database Distributors, Software Lifecycle Stage, Software Distribution, EOL Applications widgets, and Additional Software Details table is being used. If you have not enabled Software Catalog Syncing to CMDB tables, then data in these widgets does not populate.
When the Overview page is launched for the first time, you see a list of 10 default reports. However, the reports can be customized based on your preference. For more information, refer to, Customize Overview Page.
The following table includes the types of reports that you can configure:
|
Report Name |
Description |
|---|---|
|
Qualys Assets Reports |
|
|
Approved Qualys Assets |
The Approved Qualys Assets report lists the assets auto/manually approved. This number is listed on the production table. |
|
Asset Categories |
The Asset Categories report gives a clear picture of the various types of assets across your organization. The chart is a diagrammatic representation of the asset categories. Click the bar to view additional details about the respective asset category. |
|
End of Life Operating Systems |
The End of Life (EOL) Operating Systems report gives a clear picture of the various types of operating systems with the end of life across your organization. The chart is a diagrammatic representation of the operating systems. Click the bar to view additional details about the respective operating system. |
|
Failed Qualys Assets |
The Failed Qualys Assets lists the number of assets that are not transformed into the CMDB table. |
|
Hardware Manufacturers |
The Hardware Manufacturers report gives a clear picture of the various manufacturers of hardware across your organization. The chart is a diagrammatic representation of the hardware manufacturers. Click the slice to view additional details about the respective manufacturer. |
|
OS Distribution |
The OS Distribution report gives a clear picture of the operating systems installed on the assets across your organization. The chart is a diagrammatic representation of the operating systems. Click the slice to view additional details about the respective operative system. |
|
Pending Qualys Assets |
The Pending Qualys Assets report lists the assets which are not approved. |
|
Synced Qualys Assets |
The Synced Qualys Assets report lists the assets synced from Qualys to ServiceNow. |
| Ci's sync to Qualys | The Ci's Synced to Qualys report lists the number of assets synced from ServiceNow to Qualys. |
|
Software Report |
|
|
Application Categories |
The Application Categories report gives a clear picture of the various types of applications installed on the assets across your organization. The chart is a diagrammatic representation of the various applications. Click the bar to view additional details about the respective application category. |
|
Application Publishers |
The Application Publishers report gives a clear picture of the various publishers of the application installed on assets across your organization. The chart is a diagrammatic representation of the publishers. Click the bar to view additional details about the respective publisher. |
|
Database Distribution |
The Database Distribution report gives a clear picture of the various types of the database used across your organization. The chart is a diagrammatic representation of the database distribution. Click the bar to view additional details about the respective database type. |
|
End of Life Application |
The End of Life (EOL) Application report gives a clear picture of the various types of applications with end of life across your organization. The chart is a diagrammatic representation of the Application. Click the bar to view additional details about the respective operating system. |
|
Software Distribution |
The Software Distribution report gives a clear picture of the various types of software used across your organization. The chart is a diagrammatic representation of the software distribution. Click the bar to view additional details about the respective database type. |
|
Software Lifecycle Stage |
The Software Lifecycle Stage report lists the lifecycle stages of applications. Example: GA, EOL/EOS. |
Certificate Overview
The certificate overview dashboard contains the following report:
- Synced Qualys Certificate: The Synced Qualys Certificates report lists, the certificates synced from Qualys to ServiceNow.
- Approved Qualys Certificate: The Approved Qualys Certificates report lists, the certificates transformed successfully into the CMDB tables.
- Pending Qualys Certificate: The Pending Qualys Certificate report lists, the assets which are not transformed.
- Failed Qualys Certificate: The Failed Qualys Certificate lists, the number of certificates that are not successfully transformed into the CMDB table.
- Expired Certificates: The count of certificates that are expired and not valid.
- Certificates Expiring in 30 Days: The count of certificates that are expiring between 0 to 30 days.
- Certificates Expiring in 60 Days: The count of certificates that are expiring between 30 to 60 days.
- Certificates Expiring in 90 Days: The count of certificates that are expiring between 60 to 90 days.
- Qualys Certificate By Issuer Authority: A chart that shows certificates by issuing authority.
- Qualys Certificates By Key Length: A Pie chart that shows certificates by key length.
- Qualys Certificate Sync Queue: This shows the list of Sync Queues for certificate download from Qualys.
- Sync Certificate Log: This lists the logs of the Sync Certificate schedule.
Next Step