View Dashboard
The Container Security Overview is displayed in the dashboard, which contains counts and graphs of reports and data tables generated in CVR.
To view the dashboard, perform the following steps:
- Navigate to Qualys CVR Integration
- Select Dashboard.
You can see the following components in the CVR Integration dashboard:
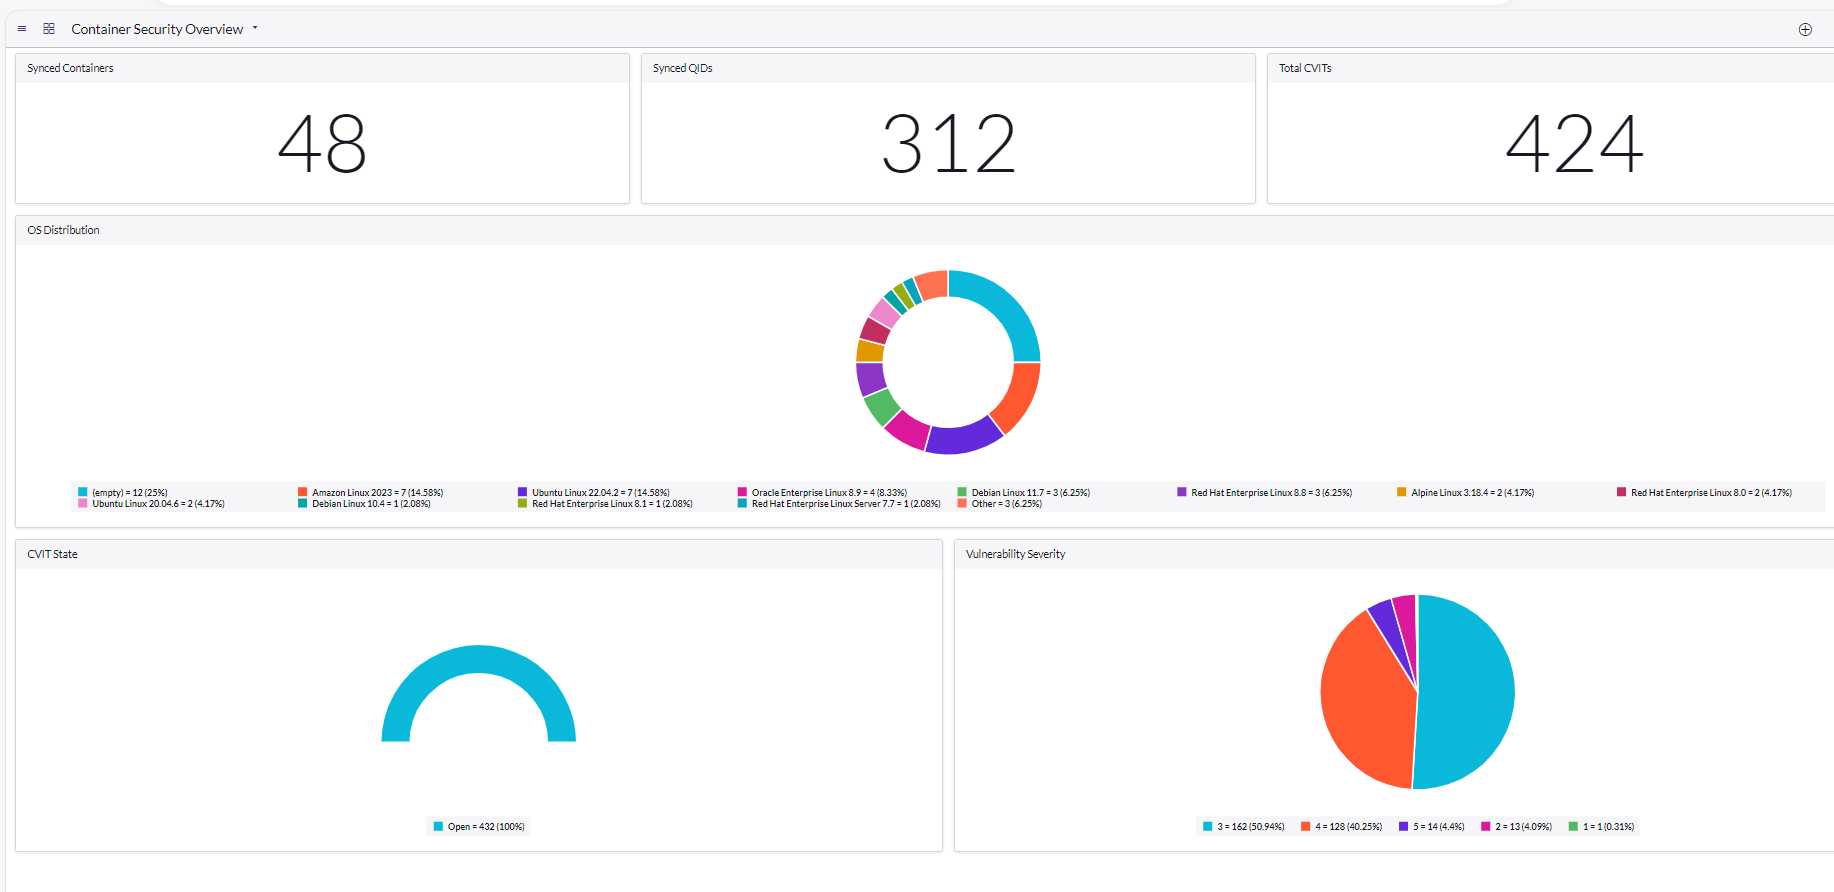
- Synced Containers: Shows the counts of the Discovered Qualys Container images.
- Synced QIDs: Shows the count of Third-party Vulnerability Entries of Qualys KnowledgeBase.
- Total CVITs: Shows the count of Qualys Container vulnerability Items.
- OS Distribution: This graphical representation shows the count and percentage distributed according to the operating system used for the container in CVR instances.
- CVIT State: This graphical representation shows the count and percentage segregation according to the vulnerability's state. A vulnerability can be Open, Under Investigation, Awaiting Implementation, or resolved.
- Vulnerability Severity: This graphical representation shows the count and percentage segregation according to the source severity of the detected vulnerabilities.
Here, the 'source severity' means severity stated by the Qualys.
To navigate data tables, click the counts and graphs.