Troubleshooting
Here are some tips for troubleshooting
Looking for Logs?
Qualys logs are populated in Splunk’s index “_internal”.
Use the following Search Processing Language (SPL) to find app-specific logs:
index=_internal source=" $SPLUNK_HOME/var/log/splunk/TA-QualysCloudPlatform/edr_events/edr_events.log"

index=_internal source=" $SPLUNK_HOME/var/log/splunk/TA-QualysCloudPlatform/cyber_security_asset_management/cyber_security_asset_management.log"

index=_internal source=" $SPLUNK_HOME/var/log/splunk/TA-QualysCloudPlatform/Knowledge_base/knowledge_base.log"

index=_internal source=" $SPLUNK_HOME/var/log/splunk/TA-QualysCloudPlatform/host_detection/host_detection.log"

index=_internal source=" $SPLUNK_HOME/var/log/splunk/TA-QualysCloudPlatform/was_findings/was_findings.log"

index=_internal source=" $SPLUNK_HOME/var/log/splunk/TA-QualysCloudPlatform/CS/cs_image_vulns.log"

index=_internal source=" $SPLUNK_HOME/var/log/splunk/TA-QualysCloudPlatform/CS/cs_container_vulns.log"

index=_internal source=" $SPLUNK_HOME/var/log/splunk/TA-QualysCloudPlatform/sem_detection/sem_detection.log"

index=_internal source=" $SPLUNK_HOME/var/log/splunk/TA-QualysCloudPlatform/Posture/pcrs_posture_info.log"

index=_internal source=" $SPLUNK_HOME/var/log/splunk/TA-QualysCloudPlatform/Posture/policy_posture_info.log"

index=_internal source=" $SPLUNK_HOME/var/log/splunk/TA-QualysCloudPlatform/certview_certificates/certview_certificates.log"

index=_internal source=" $SPLUNK_HOME/var/log/splunk/TA-QualysCloudPlatform/CSPM/aws_cspm_events.log"

index=_internal source=" $SPLUNK_HOME/var/log/splunk/TA-QualysCloudPlatform/CSPM/azure_cspm_events.log"

index=_internal source=" $SPLUNK_HOME/var/log/splunk/TA-QualysCloudPlatform/CSPM/gcp_cspm_events.log"

index=_internal source=" $SPLUNK_HOME/var/log/splunk/TA-QualysCloudPlatform/activity_log/activity_log.log"

index=_internal source=" $SPLUNK_HOME/var/log/splunk/TA-QualysCloudPlatform/FIM/fim_events.log"

index=_internal source=" $SPLUNK_HOME/var/log/splunk/TA-QualysCloudPlatform/FIM/fim_ignored_events.log"

index=_internal source=" $SPLUNK_HOME/var/log/splunk/TA-QualysCloudPlatform/FIM/fim_incidents.log"
Troubleshooting the Setup
- Be sure to enter the proper API Server URL for the configuration.
- Verify that you can reach the API from the Splunk Search Head where you have installed the Qualys App for Splunk Enterprise (no firewall or other infrastructure).
- Be sure the Qualys user account you use to connect has API access. Edit the user account in the Qualys UI and select the API access check box in the user settings. If you are not able to see this option, contact Qualys Support or your Technical Account Manager.
Updated TA setup page does not reflect
If you are not able to see the updated TA Setup page, clear the cache and perform a hard reload to view changes.
Check if any API requests are initiated
In the Splunk setup where the failing account is used, run the following search to see if API requests are being made to Qualys APIs:
For example, for (Web App Scanning) WAS app-specific logs, run the following search:
index=_internal source=" $SPLUNK_HOME/var/log/splunk/TA-QualysCloudPlatform/was_findings/was_findings.log" ("/qps/rest/3.0/search/was/finding")
No entries for API call; check if the data feed is enabled
If you do not see any entry for the API call, then check that the data input was added and enabled.
- Enable it if already not enabled.
- If you still cannot see any records for the API call, even if it is enabled, check the TA installation directory. If you come across the file named "host_detection.pid" in the installation directory, remove it.
You should be able to find entries for the /api/2.0/fo/knowledge_base/vuln/ API call.
If you can not see data, check the error logs
- If all inputs are added and enabled, and API calls are initiated, but you are still not able to view the data, check the internal index for errors logged for specific Qualys app.
- Run the following search and provide error logs to Qualys Support:
For example :
index=_internal source="$SPLUNK_HOME/var/log/splunk/TA-QualysCloudPlatform/cyber_security_asset_management/cyber_security_asset_management.log"ERROR:
To check the internal index for errors logged for the specific app, refer to the SPL list.
Not able to view the data, delete the checkpoint file and pull the data again for a Qualys module
- Navigate to $SPLUNK_HOME/var/lib/splunk/modinputs/qualys/.
- Delete the checkpoint file of the desired module.
For example, Delete 'host_detection' file for module Host Detection and initiate the pull once again. TA now pulls the data from the date configured in Data Input Settings for the respective Qualys module.
qualys.py is running even after the data input is disabled or Splunk is restarted
This issue is mainly seen on Ubuntu OS, which has the default shell set to 'dash'. To fix this issue, change the default shell from 'dash' to 'bash'.
Follow these steps to change the Ubuntu configuration:
- ~# debconf-show dash
* dash/sh: true
- ~# debconf-set-selections <<< "dash dash/sh string false"
-
~# debconf-show dash
* dash/sh: false
-
~# dpkg-reconfigure -f noninteractive dash
Removing 'diversion of /bin/sh to /bin/sh.distrib by dash'
Adding 'diversion of /bin/sh to /bin/sh.distrib by bash'
Removing 'diversion of /usr/share/man/man1/sh.1.gz to /usr/share/man/man1/sh.distrib.1.gz by dash'
Adding 'diversion of /usr/share/man/man1/sh.1.gz to /usr/share/man/man1/sh.distrib.1.gz by bash'
-
~# debconf-show dash
* dash/sh: false
How to switch the Python interpreter for Python3?
- Go to the path - $SPLUNK_HOME/etc/system/local/server.conf
- Add the python.version=python3 under [general].
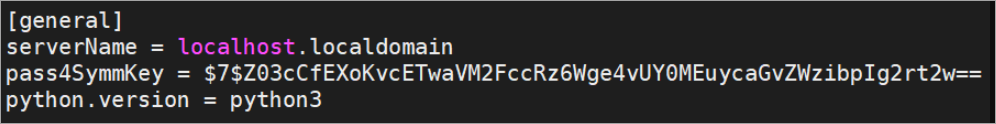
- Restart the Splunk.
Blank dashboard for the KnowledgeBase data
Perform these steps to identify and troubleshoot the issue:
- Check whether the correct index is used in the SPL added for the scheduled saved search.
- In case you disabled indexing after enabling it earlier, then check whether the scheduled saved search is also disabled as it is running for the index in which data is not updated.
- Go to the Settings > Lookups > Lookup table files and on the Lookup table files page select All from the App drop-down field.
- Check qualys_kb.csv is generated for which app.
- On enabling the indexing, the file should be present for search app, and on disabling the indexing, the file should be present for the TA-QualysCloudPlatform application.
- If qualys_kb.csv exists for another app, delete it to avoid a blank KnowledgeBase dashboard.
Working logic of VM And PCRS Maximum API retry count in VM Detection Settings and Policy Compliance Reporting Service settings
VM Detection Settings
- If TA receives the expected 429 Client Error: Too Many Requests while running host_detection data input, the retry count increases, regardless of the maximum retry limit set in the TA setup page under VM Detection settings.
- If the TA encounters an error other than 429 Client Error: Too Many Requests, the configured maximum retry limit is considered, and the number of retry counts matches the configured value of Host List Detection maximum API retry count on the TA setup page, the Host Ids or Host Id range for that specific API request is skipped, and it proceeds further.
Policy Compliance Reporting Service Settings
- If TA receives a 429 Client Error: Too Many Requests while running pcrs_posture_info data input, the retry count increases, regardless of the maximum retry limit configured in the TA setup page under PCRS settings.
- If TA encounters an error other than 429 Client Error: Too Many Requests, the configured maximum retry limit is considered, and the number of retry counts matches the configured value of PCRS maximum API retry count on the TA setup page, the batch size for that specific API request is skipped, and it proceeds further.
How to know if Data input is enabled or disabled
To check if the data input is enabled or disabled, use the tail command or SPL as follows.
This feature has been added in the latest version.
Example:
- Tail command: tail -
f /opt/splunk/var/log/splunk/TA-QualysCloudPlatform/cyber_security_asset_management/cyber_security_asset_management.log"Last enable details|Last disable details."

- Run the following SPL Into the Splunk :
index="_internal" source="/opt/splunk/var/log/splunk/TA-QualysCloudPlatform/cyber_security_asset_management/cyber_security_asset_management.log"("last enable details" OR "last disable details")
This case is only supported for Splunk versions 9.x.x or above
URL to the Qualys API Server
The Qualys API URL you should use for API requests depends on the Qualys platform where your account is located.
Click here to identify your Qualys platform and get the API URL.
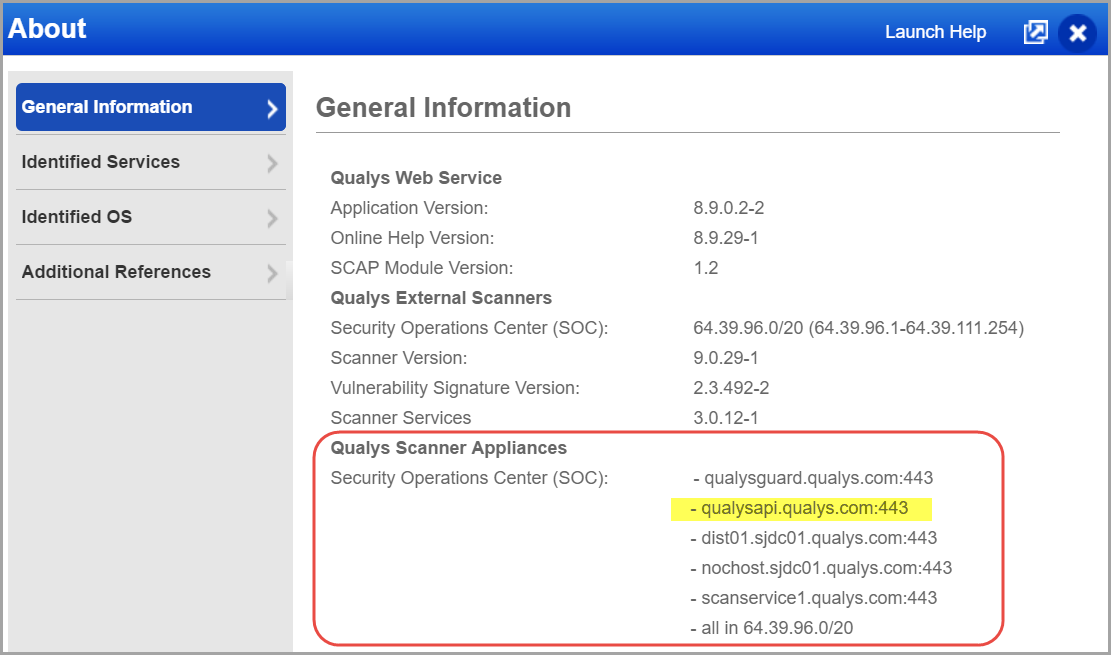
- You can find the API server URL for your account.
- Log in to your Qualys account and go to Help > About.
You can view this information under Security Operations Center (SOC).
Why does the Splunk TA integration stop working after updating the API account password?
Issue
After updating the API account password used in Splunk-TA, the integration stops working.
The following error is displayed in the Splunk-TA logs:
Authentication Error, but we're using stored creds, so we will sleep for 300 seconds and try.
Cause
The updated password in the Splunk-TA configuration is not reflected in the passwords.conf file.
Solution
To resolve the issue, perform the following steps:
-
Go to Settings > Data Inputs in the Splunk UI and disable the TA Inputs.
-
In the Splunk configuration directory, search and delete the passwords.conf file.
-
Restart the Splunk instance.
-
Open the TA configuration in the Splunk UI and enter the updated API account credentials.
-
Verify whether the passwords.conf file is recreated with updated credentials.
-
Go to Settings > Data Inputs and re-enable the TA Inputs.
Ensure you restart the Splunk instance after deleting the passwords.conf file to apply the changes.