Endpoint Detection and Response Settings
Configure Endpoint Detection and Response (EDR) API settings to fetch the EDR data from your Qualys EDR Account.
To configure settings for EDR, follow these steps:
- Go to Apps > Manage Apps > Qualys Technology Add-on for Splunk > Set up.
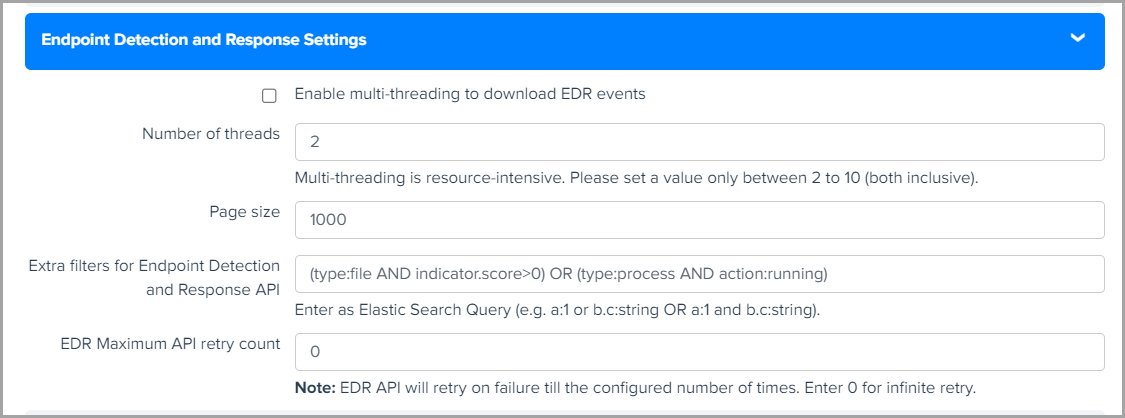
- To pass to the Indication of Compromise API, enter API input parameters in the Extra filters for Endpoint Detection and Response API field to pull EDR data (events) from your Qualys account.
TA uses default parameters type:file AND indicator.score>0) OR (type:process AND action:running) in the API request to call EDR API.
These parameters are shown in the EDR settings. You can customize the API request by adding new parameters or modifying the existing parameters
-
Select Enable multi-threading to download EDR events to pull the EDR Events data in case of multithreading. By default, this checkbox is disabled. - Enter the Number of threads to pull the EDR data. You can select the number from 2 to 50.
-
Enter Page Size to specify the number of records fetched in a single API call. Default: 1000 records, Maximum: 30000.
-
Enter EDR Maximum API retry count for 429 Error to define the number of times TA can retry the API call after a 429 error occurs.
-
Enter EDR Maximum API retry count to define the number of times TA can retry the API call after any error occurs (excluding 429 error). Allowed limit is from 1 to 6.
-
To fetch the loaded module data, select the Include loadedModules for Process events checkbox. This checkbox is disabled by default.
Ensure that the 'Enable debug logs' and 'Enable to preserve the XML/JSON files of API output' options under 'More Settings' are enabled to preserve the JSON File for EDR Events in case of multithreading. If 'Enable debug logs' are disabled under More Settings, the response should be parsed on the fly.
Event Types for Searching EDR Data in Splunk
You can use default event types to search for EDR data pulled in Splunk. See Event Types for Searching your Apps Data.