Portfolio Overview
The Home page serves as the landing page for partners after login. It provides a consolidated view of insights across all customer accounts by aggregating data from the Vulnerability Management, Detection and Remediation (VMDR), or Enterprise TruRisk™ Management (ETM) applications for onboarded customers. The page enables partners to quickly assess threat trends, customer risk posture, portfolio performance, and overall risk exposure through the following sections:
-
Top Trending Threats: Displays trending threats impacting identified customers, helping partners quickly identify emerging and active risks using Qualys Threat Intelligence and verified sources like the CISA Exploited Vulnerabilities (KEV) catalog.
-
Top High-Risk Customers: Displays the top five high-risk customers based on the risk posture of the onboarded applications, allowing partners to prioritize remediation efforts.
-
Portfolio Performance vs. Industry Benchmark: Compares the overall performance of the partner’s customer portfolio with industry benchmarks to help partners evaluate how their customers perform relative to industry standards.
-
High-Risk Exposure: Categorizes onboarded customers by risk level, providing a clear view of risk distribution across the customer portfolio.
Overview
The Home page shows a summary of customer data.

- Total Customers: Displays the total number of customers onboarded through the VMDR or ETM applications with credentials configured in Manage Customers.
- Customers At High Risk: Identifies customers with a TruRisk score of 700 or above, categorizing them as high risk.
The TruRisk™ score ranges from 0 to 1000, and the risk levels are defined as follows:
Low Risk: 0–499
Medium Risk: 500–699
High Risk: 700–849
Critical Risk: 850–1000
- Overconsuming Customers: Flags a customer as over-consuming when actual usage exceeds the purchased license count.
For example, consider a customer who purchases 100 asset licenses for an application (such as Policy Compliance) but uses 102 licenses. Count this customer as over-consuming.
Growth Opportunities
The Growth Opportunities bar on the Home page highlights upsell and coverage opportunities across your customer base. For each opportunity, the bar shows the number of active customers eligible for it.
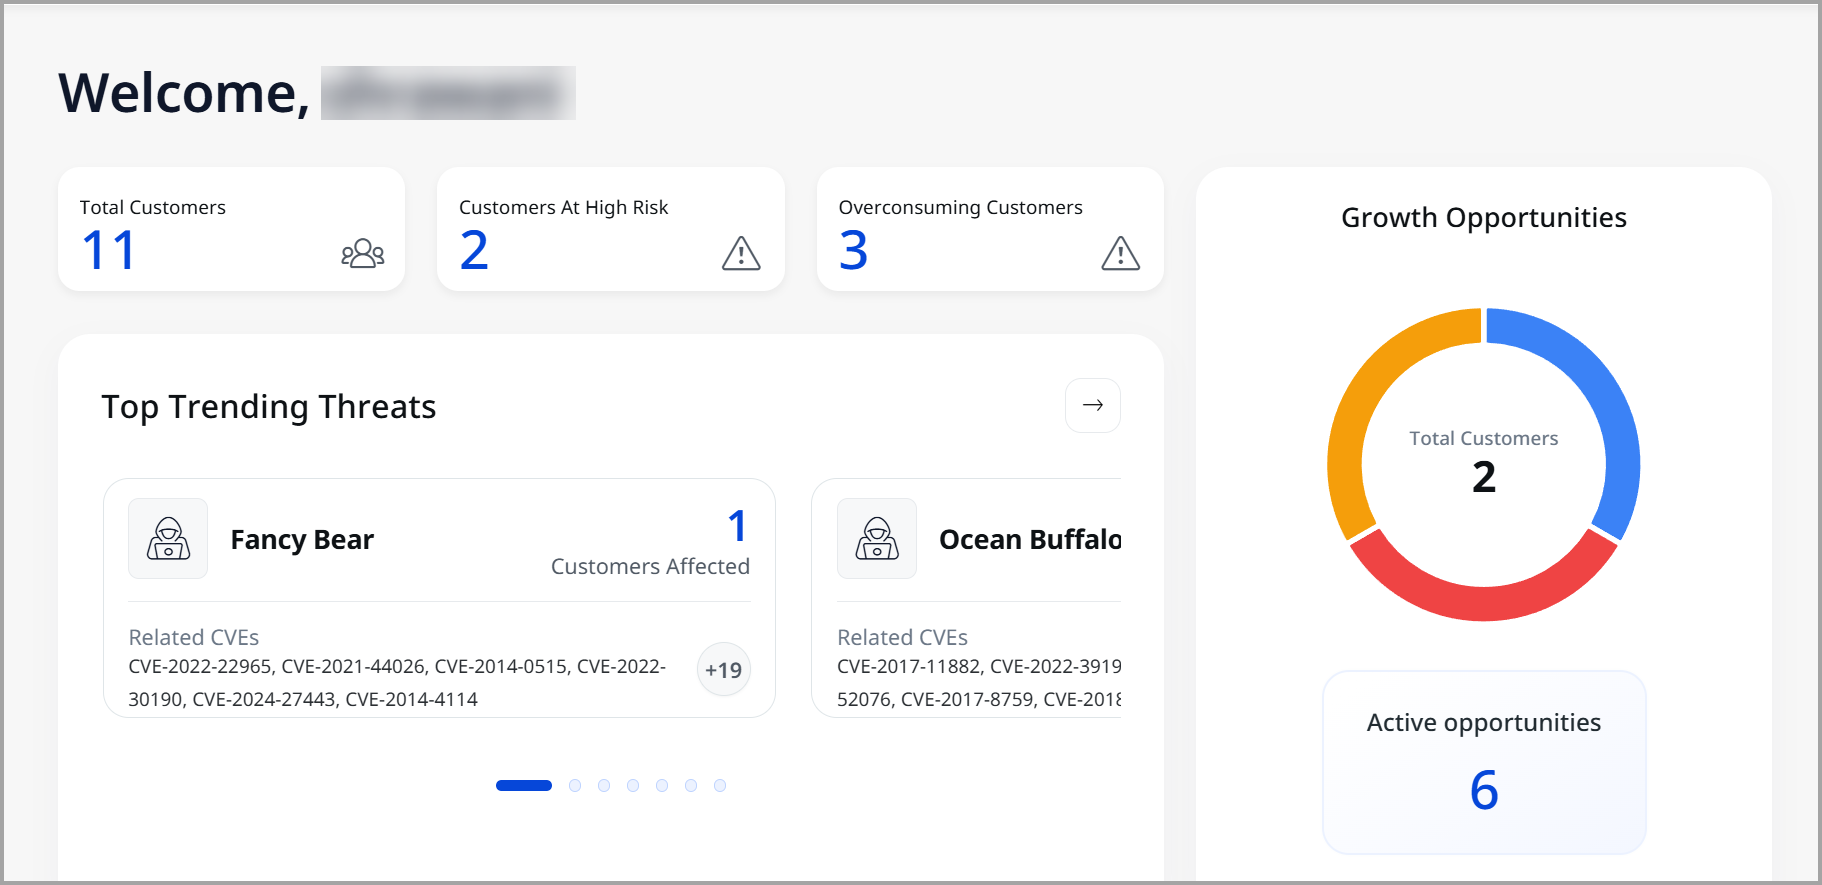
Click the active opportunities count to open a detailed view of that opportunity. The detailed view is split into two panels:
-
Opportunity List: The left-hand panel lists the growth opportunities available across your customer base.
-
Customer Details: The right-hand panel displays the customers eligible for the opportunity you select on the left, along with their relevant details.
Use this view to analyze an opportunity and identify which customers benefit from it, so you can prioritize your outreach.
Top Trending Threats
The Top Trending Threats section on the Home page lists the latest active security threats and explains how they affect your customers.
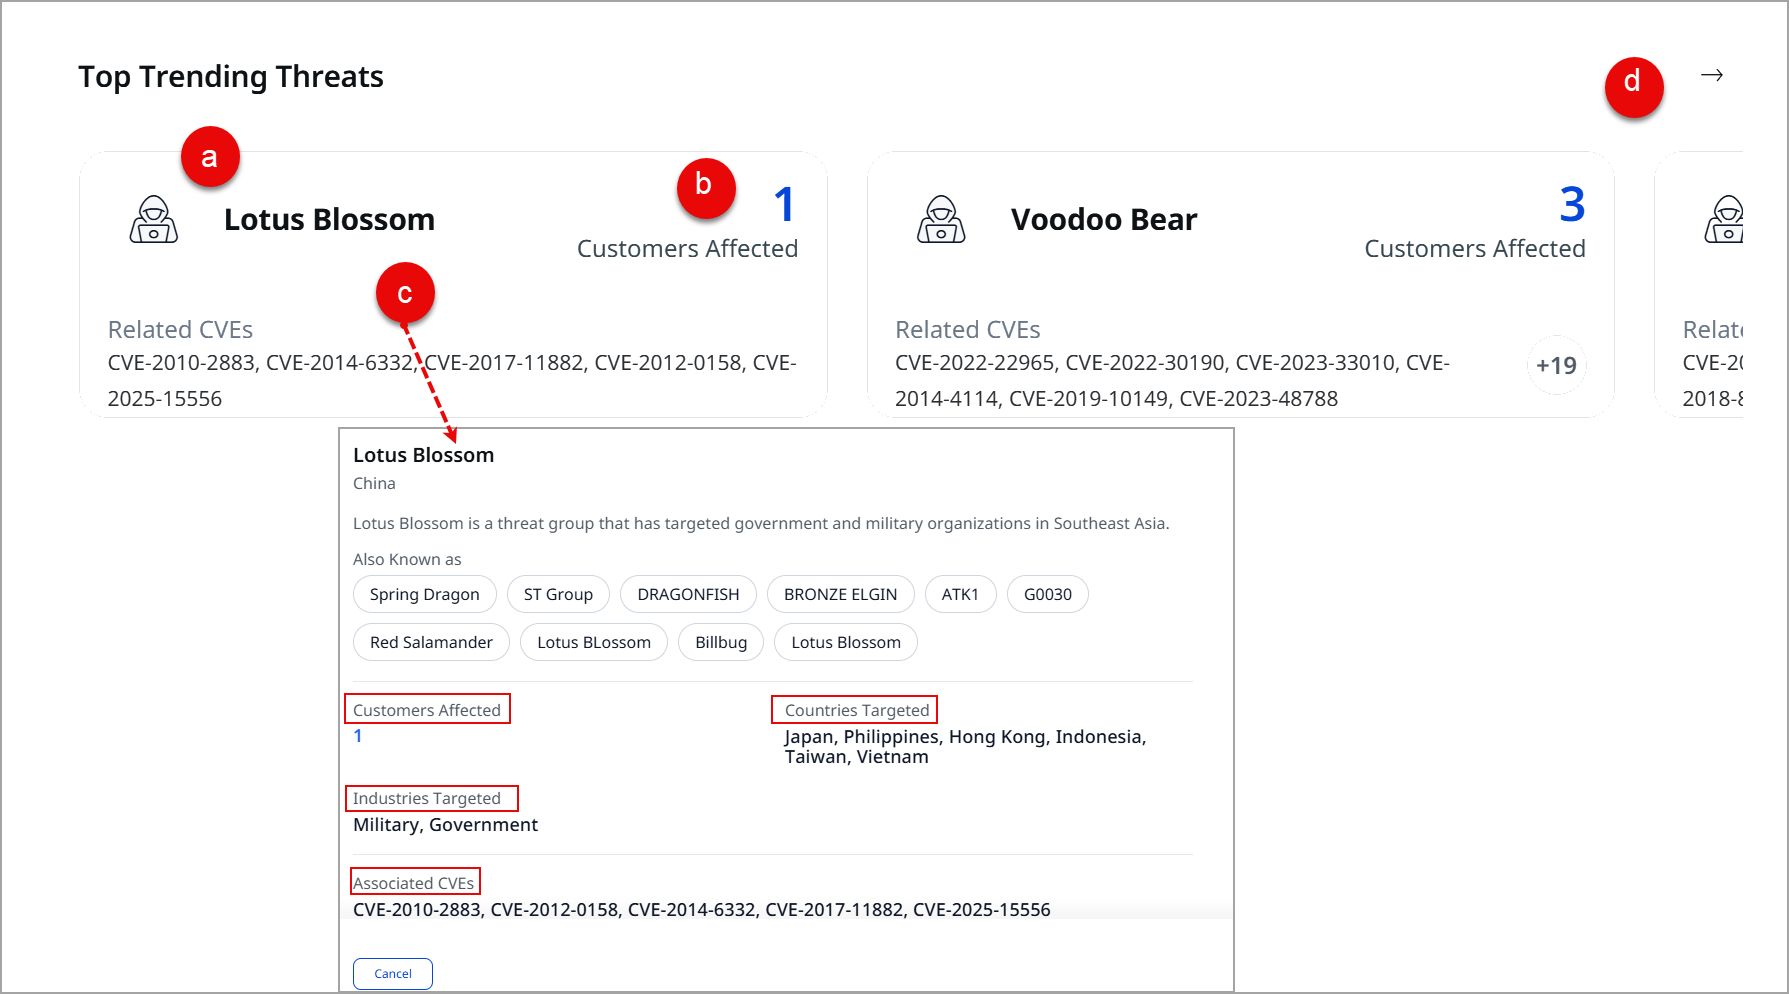
The interface displays seven horizontal cards that you can scroll through. Each card shows the number of affected customers.
- The section lists the names of active threats, such as “Fancy Bear.” The list updates over time as new threat data becomes available.
- You can see a threat in this section when any of your added customers fall under that threat category. Click the “Customers Affected” count to open the Risk Overview page. The system applies a filter for the selected threat. This filter helps you identify the customers at risk.
- The card provides an overview of the threat, including a brief description, affected customers, targeted countries and industries, and associated CVEs. You can click anywhere on the card to view detailed information about the threat.
- Click the arrow icon to view the complete list of threats that currently affect your customers.
Top High-Risk Customers
The top High-Risk customers display the top five customers ranked by risk score. The system sorts these customers in descending order by default. Customers with the highest scores appear first.
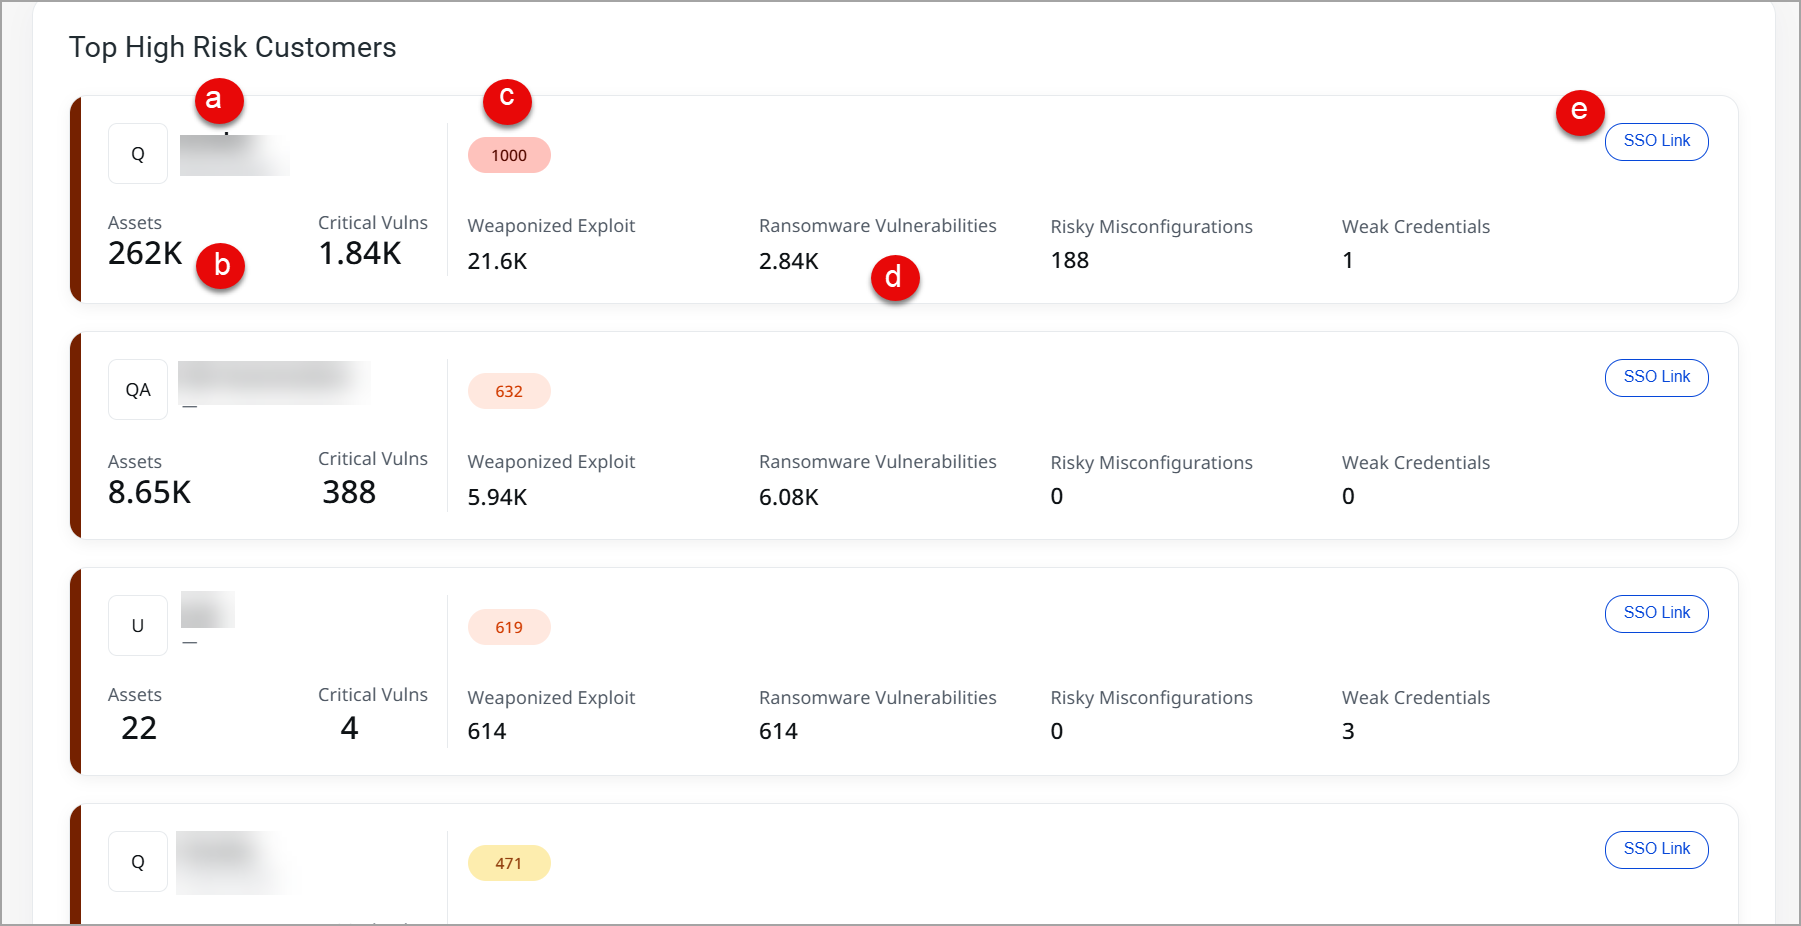
It displays the following information for each of these five customers:
a. The company name and the industry the company belongs to (for example, “Qualys Government”)
b. The total number of onboarded assets for the respective industry.
c. The TruRisk™ score of the customer based on the onboarded module.
d. The system retrieves key security data from such as Vulnerability Management and Enterprise TruRisk™ Management. The card displays the following metrics:
-
Critical vulnerabilities: Identifies the highest-severity vulnerabilities that require immediate remediation to reduce risk exposure.
-
Weaponized exploits: Highlights vulnerabilities for which active exploit code is available and can be used by attackers.
-
Ransomware vulnerabilities: Identifies vulnerabilities known to be leveraged in ransomware attacks.
-
Risky misconfigurations: Identifies insecure or non-compliant configurations that can expose systems to potential security risks.
-
Weak credentials: Identifies accounts configured with weak or easily guessable passwords that attackers can compromise.
e. The card provides a Single Sign-On link. This link allows a partner to log in directly to the selected customer’s portal without having to re-enter credentials. Its redirection logic is based on the modules a customer has onboarded.
-
If you have an ETM license, the system redirects you to the ETM page.
-
If you do not have an ETM license, the system redirects you to the Vulnerability Management page.
The top high-risk customers display provides immediate visibility into the highest-priority risks across the customer base. You do not need to search through the full list of your customers. You can quickly identify the five accounts that require immediate attention based on high-risk scores and specific threat exposure, such as ransomware or critical vulnerabilities. This section also provides quick access to high-risk accounts. Partners can use the Single Sign-On link to open a customer’s portal directly and investigate or remediate issues.
The Portfolio Performance vs Industry Benchmarks
The portfolio performance vs industry benchmark section compares the security performance of your customer portfolio with industry benchmarks.
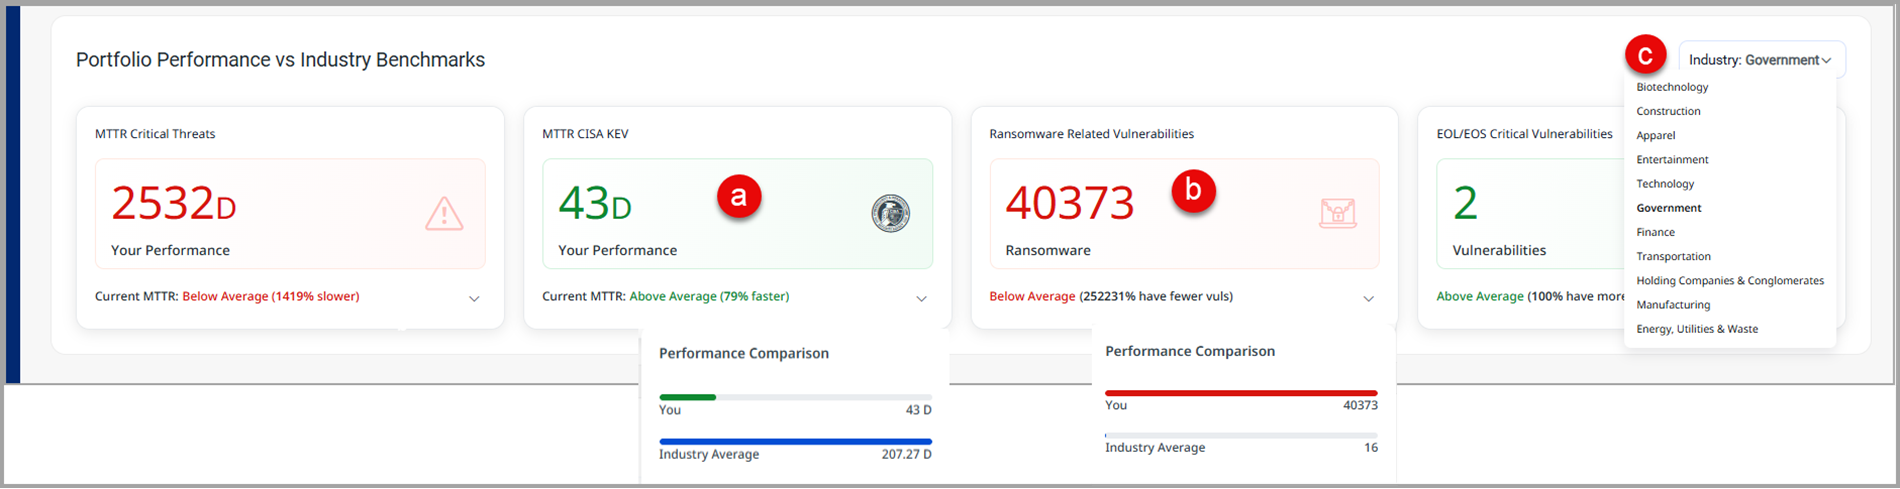
The following are several key features and metrics that help you understand this section:
Performance Metrics:
The section tracks and compares key security metrics, including:
-
Mean Time to Remediation for critical threats. The system measures this metric in days and compares your customers’ resolution time with the industry average.
-
Mean Time to Remediation for vulnerabilities listed in the CISA Known Exploited Vulnerabilities (KEV) catalog. The system measures this metric in days and (optionally) compares your customers’ resolution time with industry benchmarks.
-
The number of ransomware threats and critical vulnerabilities.
-
The count of assets running end-of-service or end-of-life software that no longer receives vendor support or security updates
a) Comparative Analysis: The card shows your performance alongside the overall industry benchmark for each metric. For example, the industry average for a metric may be 207.27 days, while your portfolio shows 43 days. This result shows that the partner’s customers remediate critical threats much faster than the industry average.
b) Visual Indicators: The system uses color coding to highlight performance gaps. It highlights data in red when your portfolio underperforms the industry benchmark. This indicator helps you identify areas that require attention.
c) Industry: The interface displays each industry in your customer portfolio, such as Government or Biotechnology.
The system shows an industry only if at least one customer belongs to it.
High-Risk Exposures
The High-Risk Exposure section displays a fixed card that provides a high-level view of specific vulnerabilities affecting your entire pool of added customers.
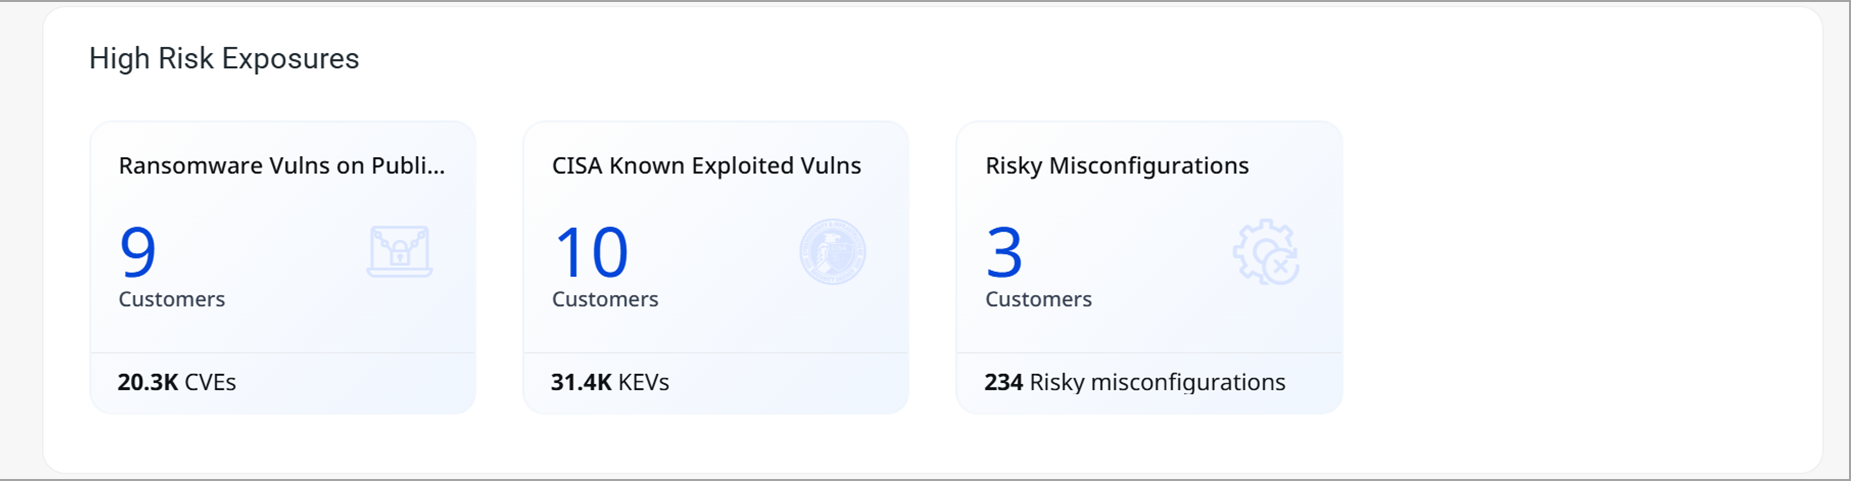
This section shows three major risk categories:
-
Ransomware Vulnerabilities: The card shows the number of customers exposed to ransomware-related threats.
-
CISA Known Exploited Vulnerabilities: The system tracks the number of customers affected by vulnerabilities listed in the Cybersecurity and Infrastructure Security Agency Known Exploited Vulnerabilities catalog.
-
Risky Misconfigurations: The card shows how many customers have insecure or incorrectly configured settings.
The system allows you to click each risk category. When you click a category, the system opens the Risk Overview page and applies a filter for that risk type. For example, when you click the ransomware category, the system applies a ransomware filter and displays the affected customers.