Viewing Compliance by Control
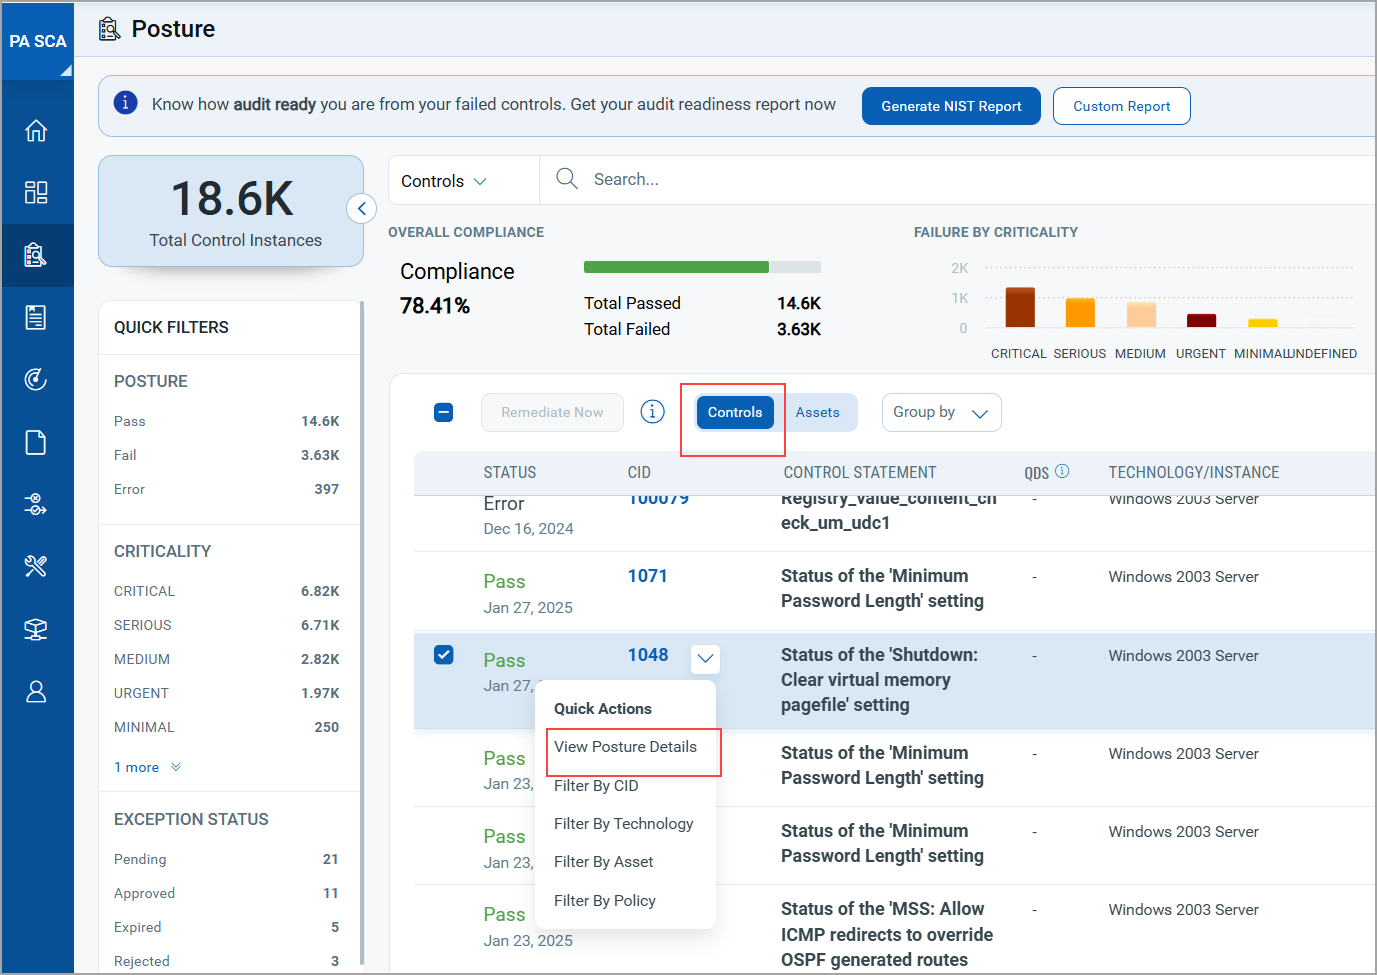
The Controls sub-tab helps you identify of all the control instances that are used in scanning your IT assets, how many show the PASS or the FAIL result. You also get to see the categorization of control instances showing FAIL posture into their levels of criticality. This helps you prioritize the remediation measures where you want to treat your high-risk assets first followed by lesser critical assets.
You can use several ways to filter out your posture records. For example, you can view the records in the context of control instances or of assets. You can also group records by controls, control categories, criticality levels, technology categories and subcategories.
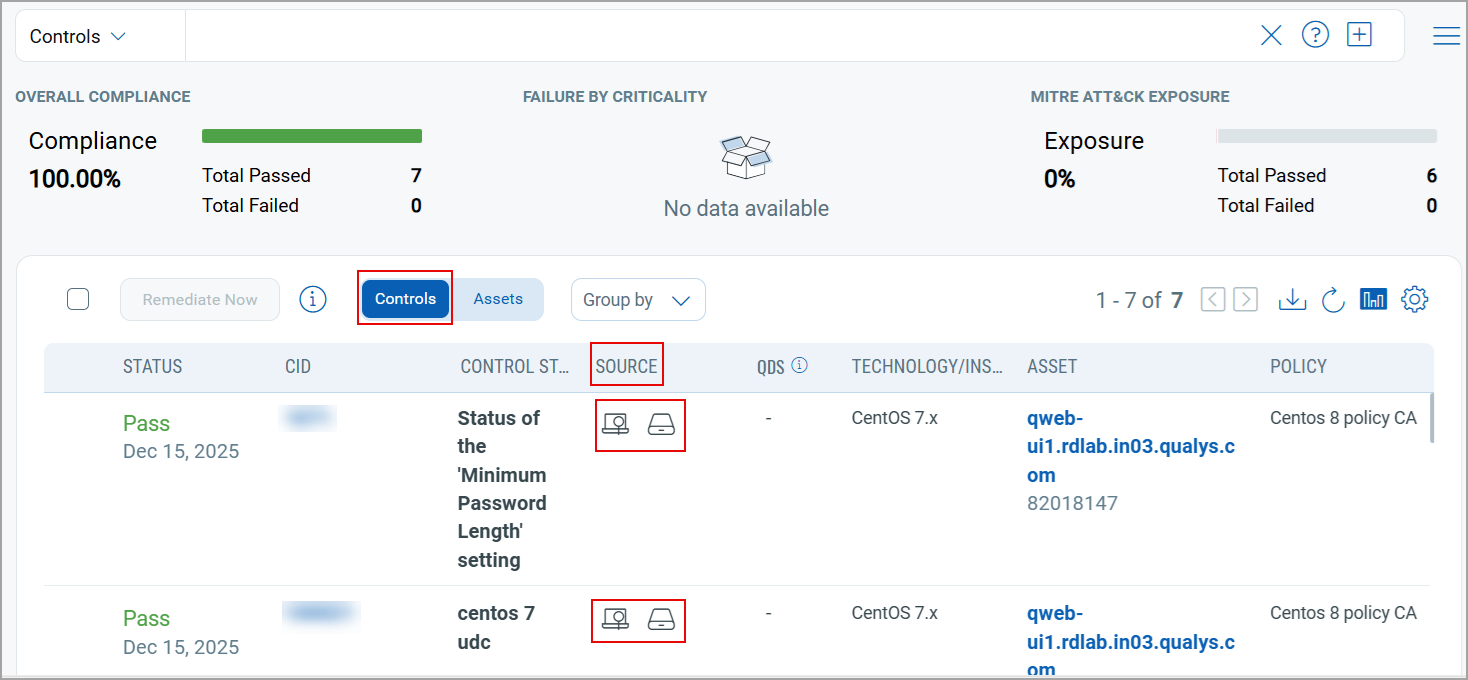
You can also identify whether the scanned host was a scanner or an agent using the Source column. This provides clarity when multiple scan sources are associated with the same host. The ![]() indicates agent and the
indicates agent and the ![]() indicated scanner.
indicated scanner.
Viewing Posture Details by Controls
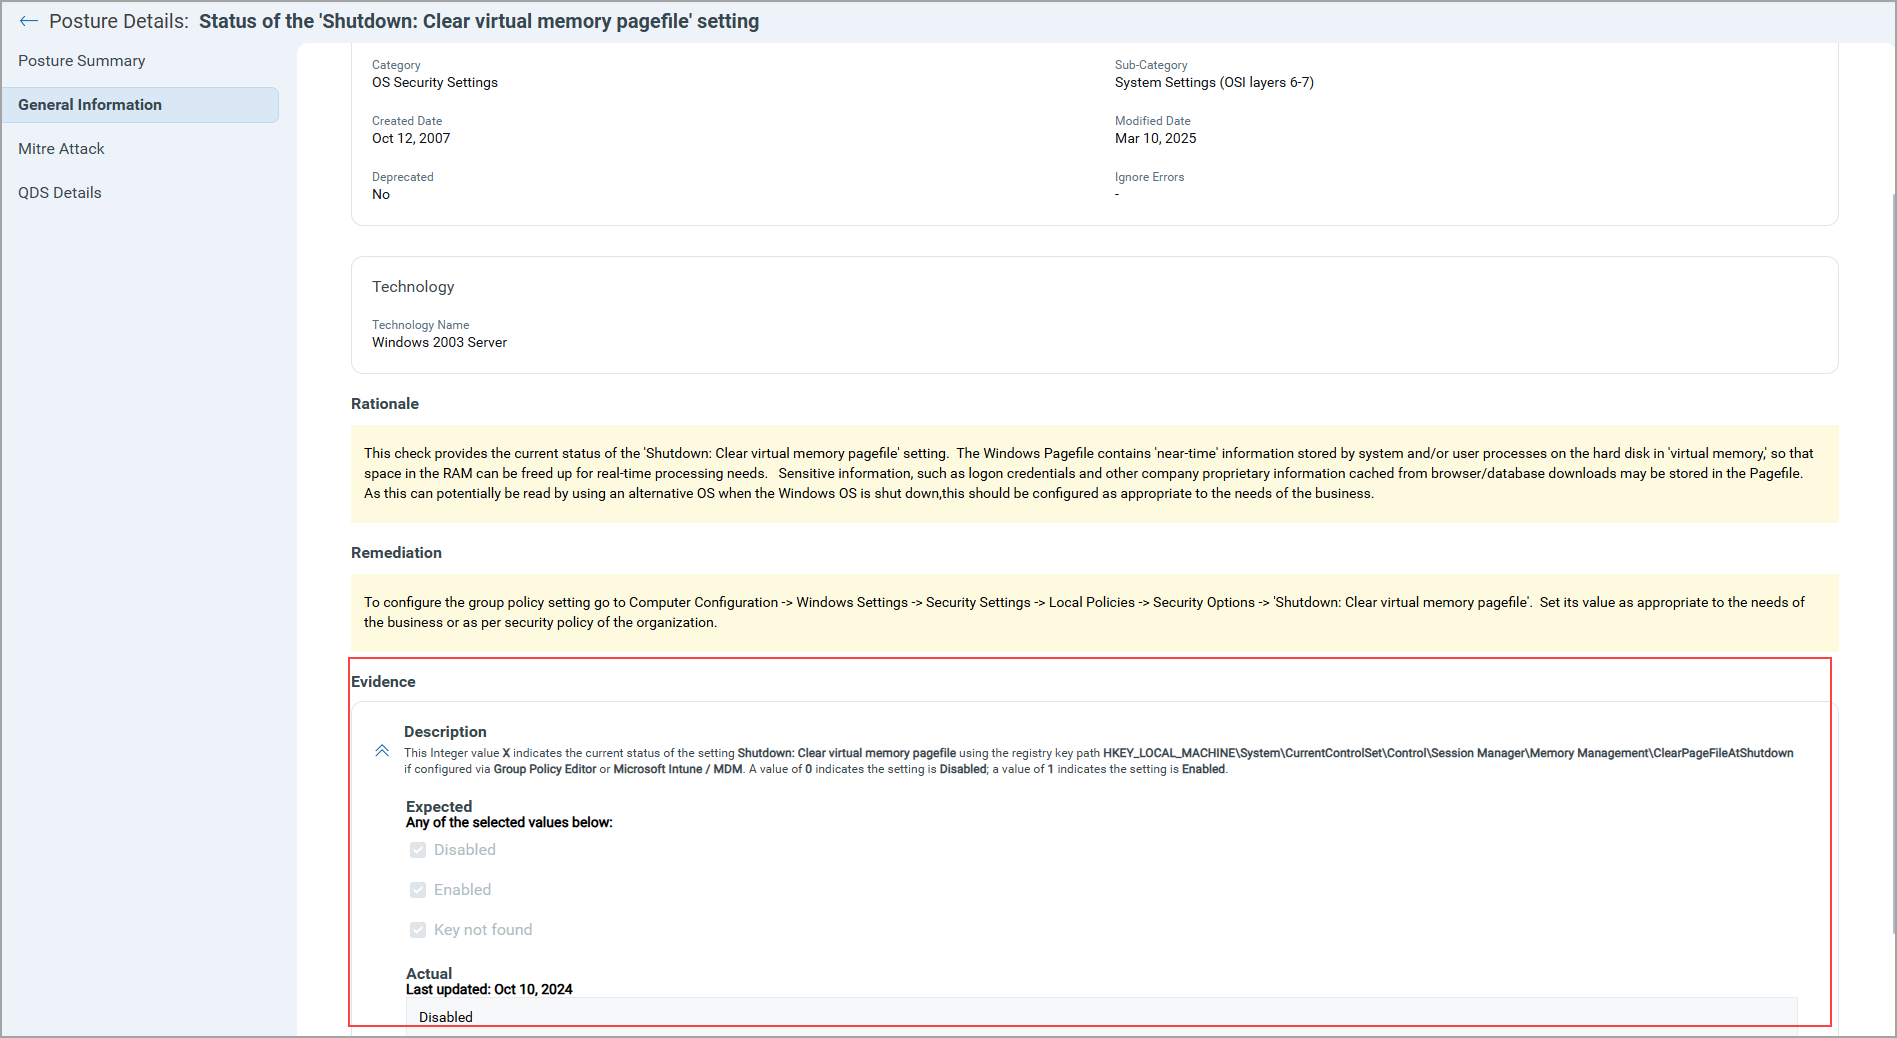
When you view posture details for a control, the details include an Evidence section with the Expected and Actual values for each control. The Expected value is the value defined in the compliance policy. The Actual value is the value returned during the last compliance scan on the host. These values are compared during the evaluation process for the control on the host, resulting in a Passed or Failed status.
View Posture Details by Controls
Select a control you are interested in and select View Posture Details from the Quick Action menu.
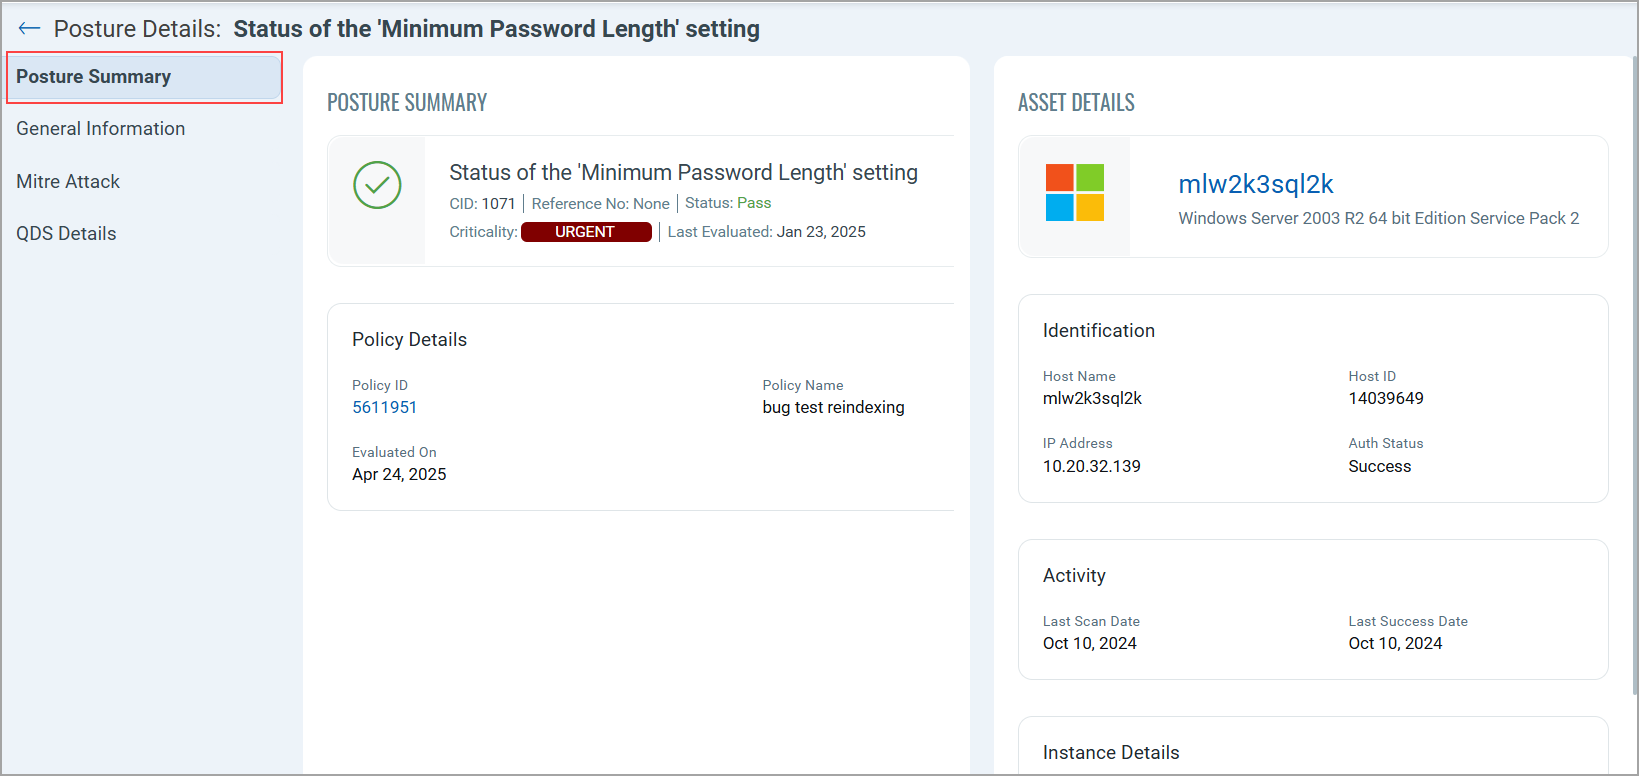
In the Posture Summary section, you can view comprehensive posture summary with many up-to-date details about the policy and the associated controls.
In the General Information section, expand the Evidence drop-down to see the expected and actual values for each control.
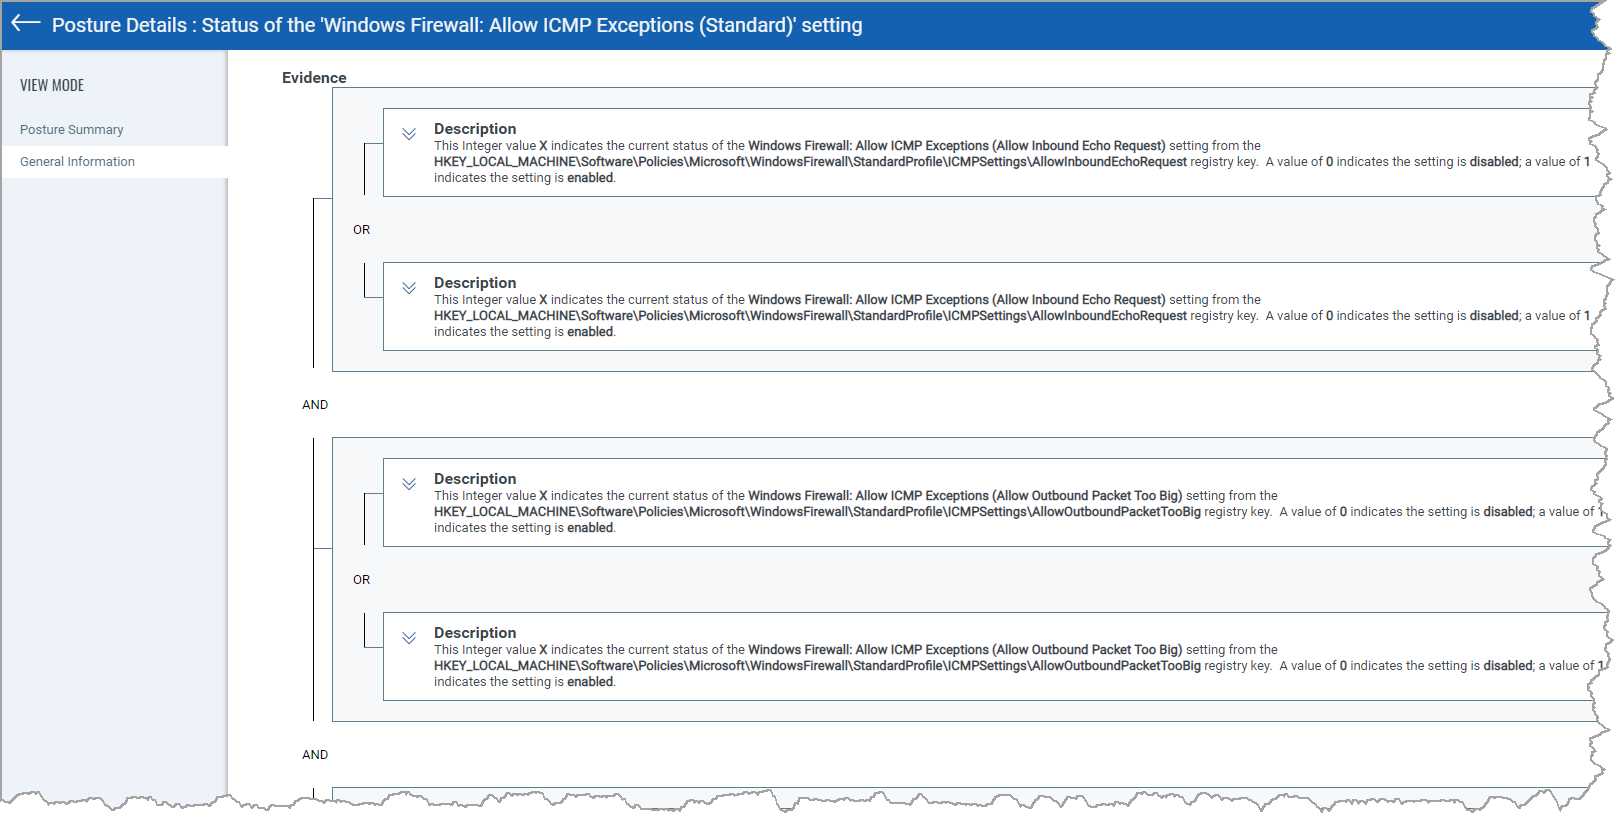
When a control has multiple sets of criteria, you can view them grouped with the operators AND and OR. Expand any control description to see the Expected and Actual values.
Download Posture Control Details in CSV Format
To download the Posture Control details in CSV format, in the Posture tab, select Controls > download icon (![]() ).
).
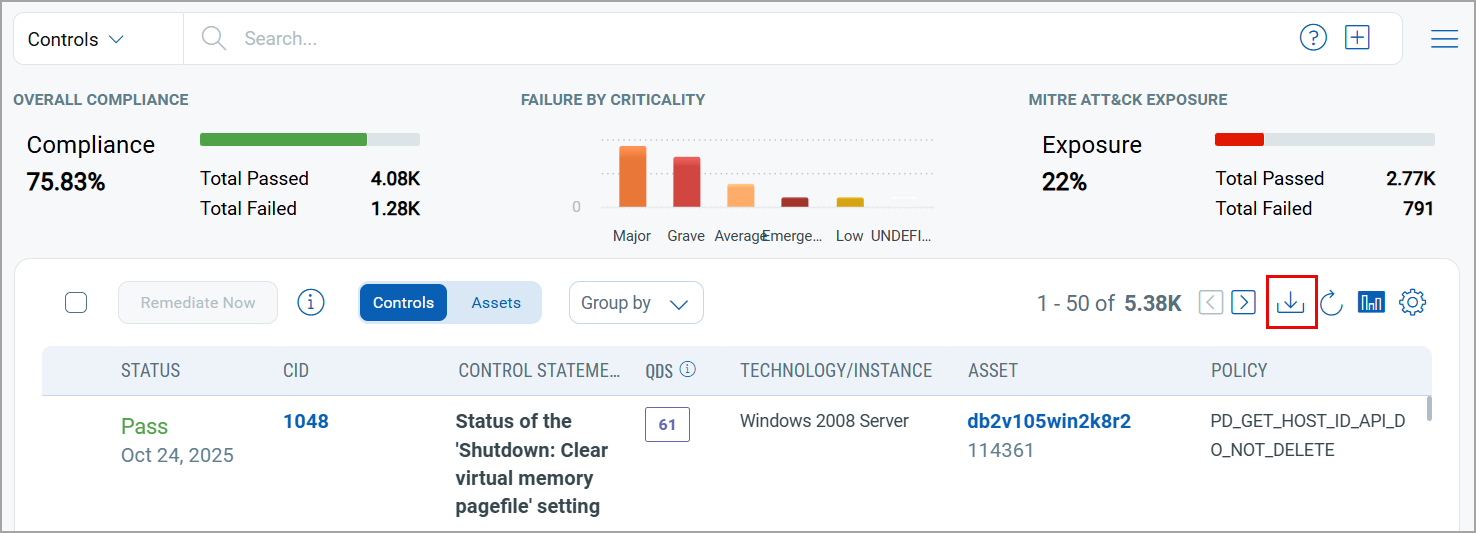
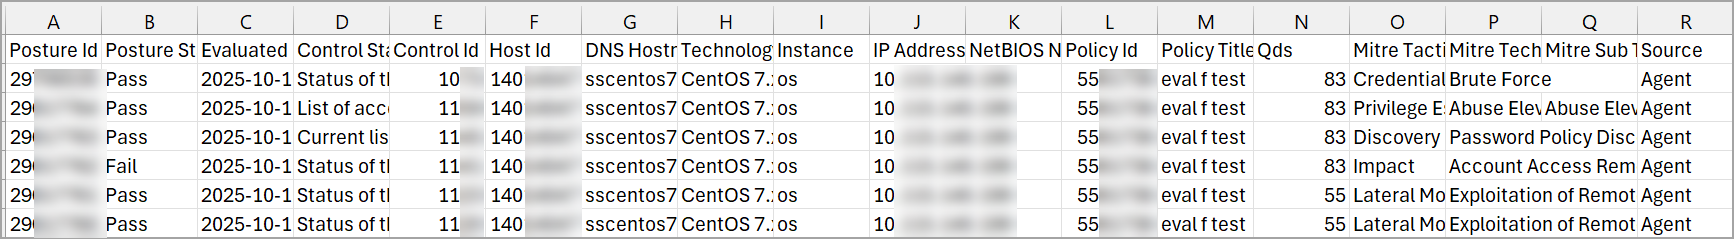
The Posture Control report is downloaded. The report consists of the columns posture ID, status, evaluation date, control statement and ID, host ID, DNS Hostname, technology name, instance, IP address, NetBIOS name, policy ID, policy title, QDS, Mitre Tactic Name, Mitre Technique Name, Mitre Sub Technique Name, and source.
How to identify the source (scanner vs agent) of posture data in the Posture tab and reports?
The Posture tab displays all sources that contributed to generating a posture. When the posture data for a control or asset has been collected by both a scanner and an agent, both the scanner and agent icons are displayed in the Source column. This helps to quickly identify which sources contributed to that posture.
- Under the Posture tab > Controls, in the Source column, both the scanner (
 ) and agent (
 ) icons are displayed.
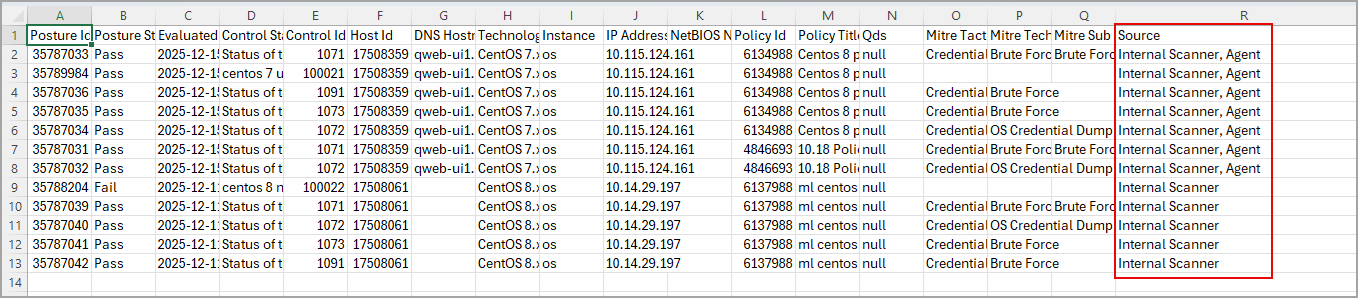
- When the posture results are downloaded in CSV format, the file, in the Source column lists the types as scanner and agent accordingly.
How to view the detection dates for a control in a scan?
Under the Posture tab > Controls, on hovering over any of the icons, scanner or agent, the name of the source (scanner or agent), the date on which the control was first detected in a scan, and the date on which it was last detected in a scan.
![]()
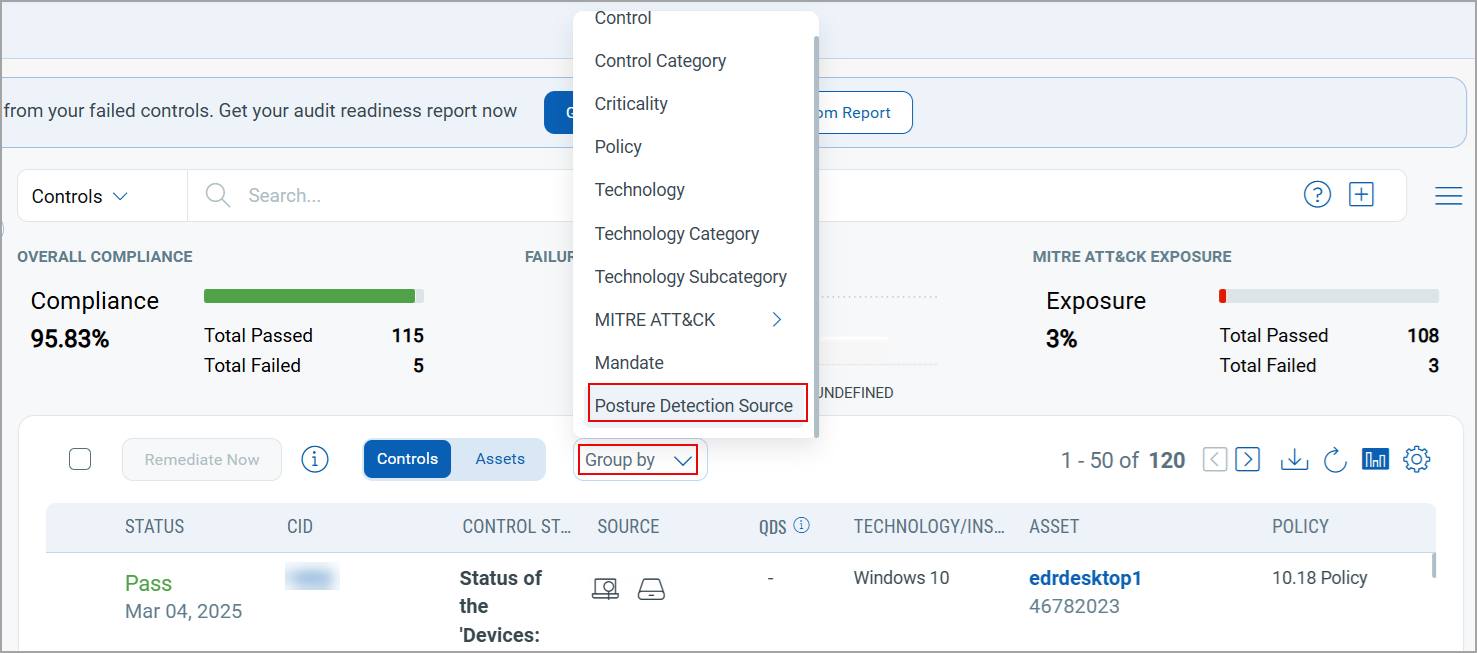
What is the Posture Detection Source group by option?
The Posture Detection Source group by option shows how many control instances were detected by each source, such as agents and internal scanners.
To group by Posture Detection Source, navigate to Posture > Controls > Group by > Posture Detection Source.
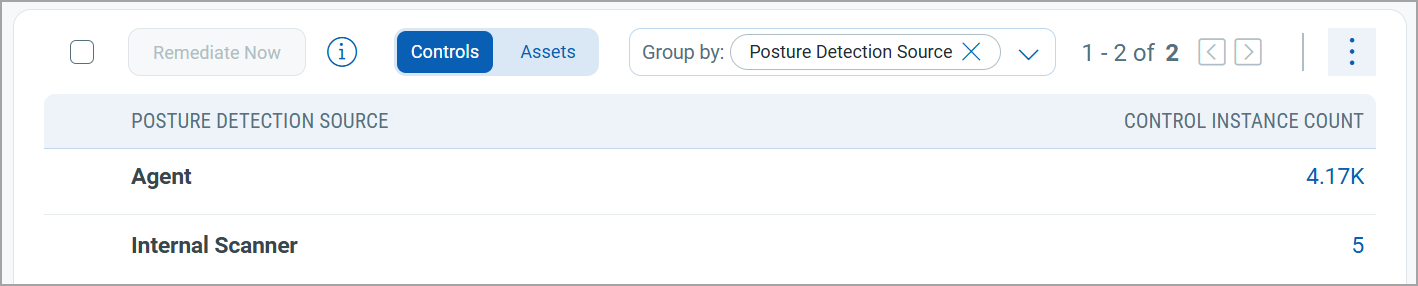
The grouped results based on Posture Detection Source are displayed.
- The Group by Posture Detection Source option is available for both Controls and Assets.
- The Source column is currently supported to display details only for the internal scanner and agent.
- When the Group by Posture Detection Source is selected, the system displays the total number of control instances per source.
In this case, control instances detected by multiple sources are counted under each applicable source, that can result in overlapping counts.
For example, consider the following:
- 10 control instances are detected only by the scanner.
- 10 control instances are detected only by the agent.
- 10 control instances are detected by both the scanner and the agent.
When grouped by Posture Detection Source:
- Scanner shows a total count of 20 (10 scanner only + 10 scanner and agent)
- Agent shows a total count of 20 (10 agent only + 10 scanner and agent)
This overlap occurs because control instances detected by both sources are included in the count for each source.