Patch Management Widgets
Qualys Patch Management offers several out-of-the-box widgets. Each widget displays a short description of the information it provides. You can also easily configure widgets to pull data from other modules/applications and add them to your dashboard.
- Total 7 out-of-the-box widgets for Windows patches, of which 5 are the system-defined widgets, and two are editable.
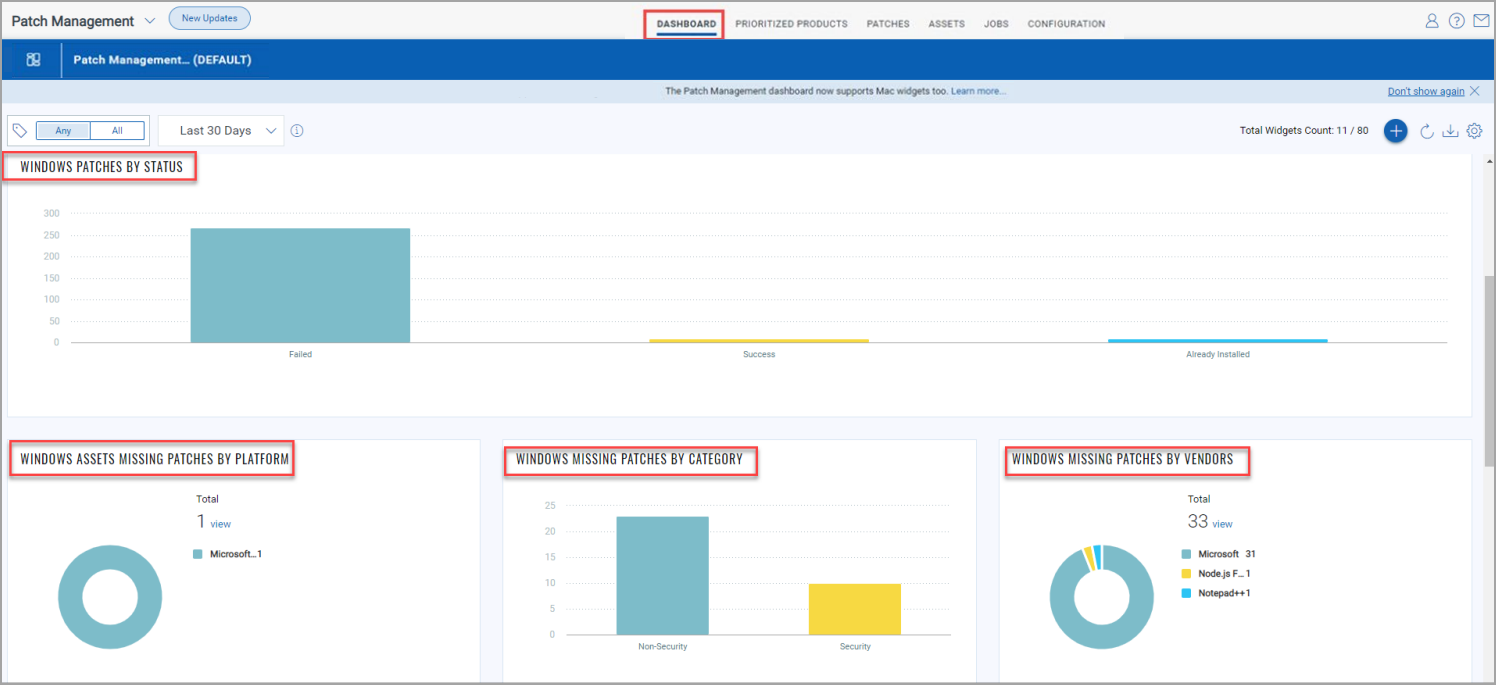
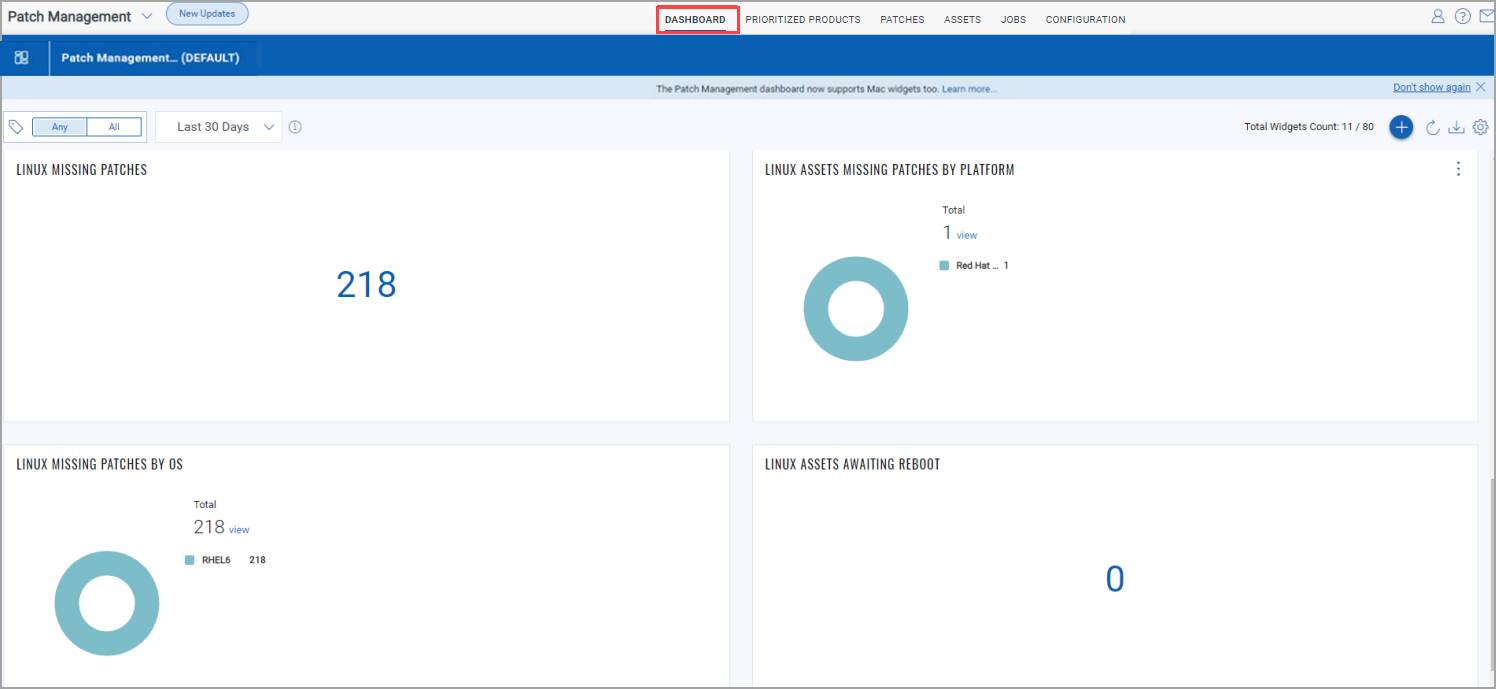
- 4 out-of-the-box widgets for Linux patches.
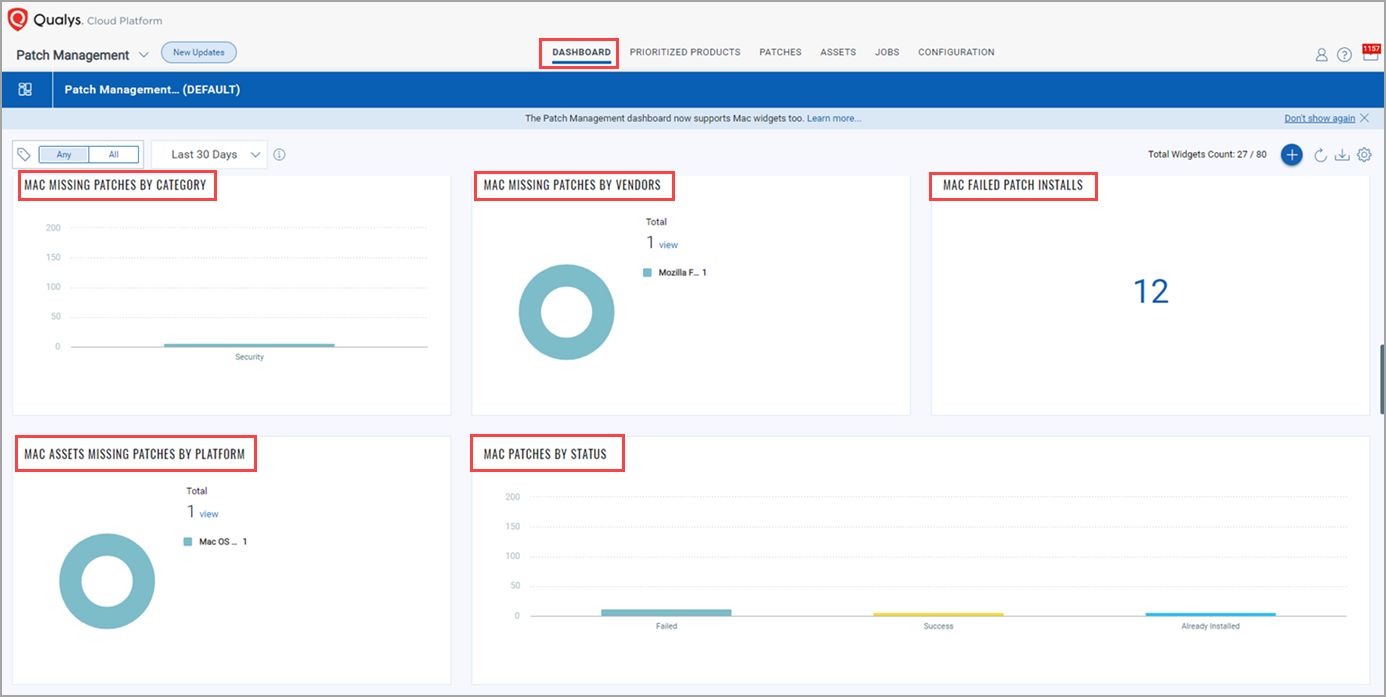
- Total 7 out-of-the-box widgets for Mac patches, of which 5 are the system-defined widgets, and two are editable.
Widgets - Data Across All Platforms
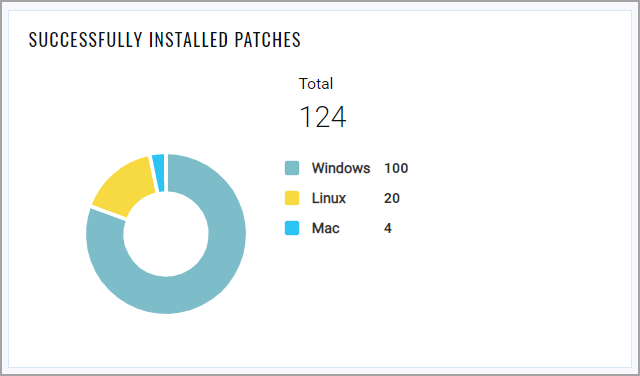
- Successfully Installed Patches
You can add a widget that shows the count of successfully installed patches across all platforms. The count of patches is based on the job results received from the Cloud Agent, which considers the results of the last 15 occurrences of a particular job execution.
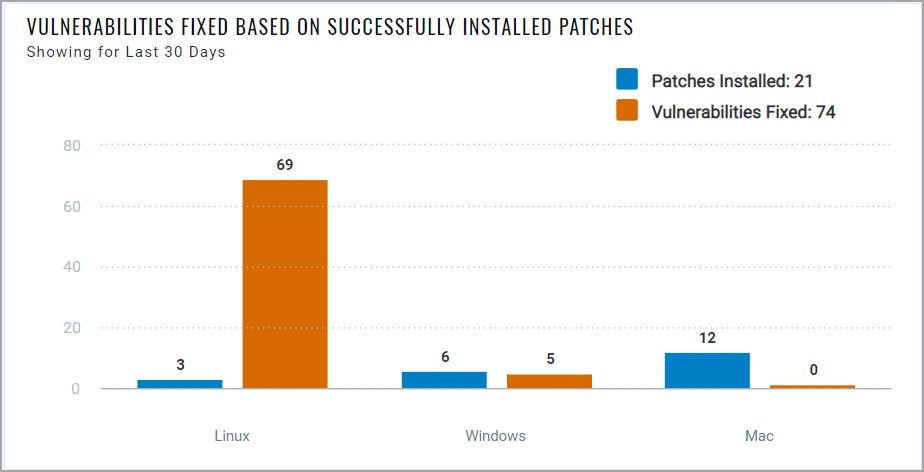
- Vulnerabilities Fixed Based on Successfully Installed Patches
You can add a widget that shows a platform-level breakup of the number of patches successfully installed and the vulnerabilities fixed.
Consider This
- The browser time zone is considered for date time selection, not the user time zone.
- You might notice a discrepancy in the count of fixed QIDs if the date of patch installation and scan result received from VMDR are different. Also, in the case of non-security patches, you might see a difference in the count of patches from the Successfully Installed Patches widget and the Vulnerabilities fixed widget.
The vulnerabilities fixed count also includes the vulnerabilities for which the patch already exists, but another patching mechanism, such as a Windows update, fixed these vulnerabilities. Note that the patches count doesn't include patches for such vulnerabilities.
The count of patches is based on the deployment job results received from the agent, which considers the results of the last 15 occurrences of a particular job execution.
The patches and vulnerabilities counts are not clickable, and they are updated based on the tag and the time filter selection available in the Unified Dashboard (UD) header.
Important to Know
- If Timeframe is enabled, the patches and vulnerabilities count is shown according to the widget-level time filter you select because the widget-level time filter setting takes precedence over the UD time filter setting.
Example:
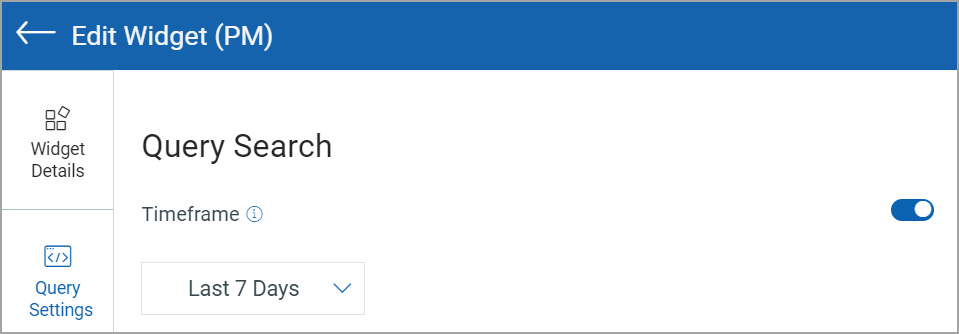
- If Timeframe is disabled, the Last 30 Days time filter from the UD header is considered a default time filter, and the patches and vulnerabilities count is shown according to that time filter.
- You can edit and replicate the widget and customize the tag selection for such replicated widgets. Values in such edited widgets honor the widget level tags and time filter selection, not the UD level tag selection.