TruRisk™ Eliminate Release 4.1
September 06, 2026
This release unifies Patch, Mitigate, and Isolate under TruRisk™ Eliminate, adds new Overview and Operational Status dashboards for risk and remediation visibility, and improves asset status reporting in Job Progress.
Enhancement
TruRisk™ Eliminate Unifies Patch Management, Mitigate, and Isolate
What Changed For You
You'll now view only TruRisk™ Eliminate in the application picker: Patch, Mitigate, and Isolate are consolidated into this single application, and the name change carries through built-in dashboards and email notifications.
TruRisk™ Eliminate combines Patch, Mitigate, Isolate, and Custom Assessment and Remediation (CAR) capabilities in a single application to help you reduce cyber risk. You can select a fix that best suits your needs. CAR is maintained separately under the Risk Remediation plan alongside TruRisk™ Eliminate. It provides the ability to create custom scripts. TE enables you to prioritize high-risk vulnerabilities, select the appropriate fix, respond faster to emerging threats, and maintain business continuity, even when traditional patching is not immediately possible. The standalone Mitigation and Isolation applications are now consolidated, and the application picker now displays only TruRisk™ Eliminate.
Log in to the Qualys TruRisk™ Enterprise platform and navigate to Risk Remediation and select TruRisk™ Eliminate.
This name change is also updated in the built-in dashboards and email notifications.
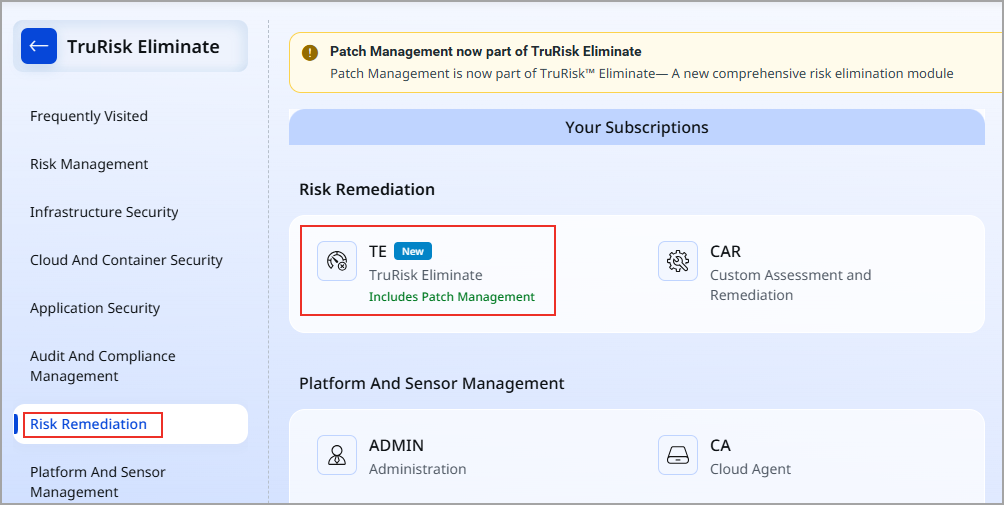
This name change will be reflected in the patch deployment windows and in the Administration UI starting with Cloud Agent version 7.0.0.
New Feature
Get a Complete View of Risk and Remediation Opportunities
What's New for You
You now have a new TruRisk™ Eliminate Overview dashboard, a single landing page that surfaces your addressable vulnerability exposure, high-impact remediation opportunities, compliance insights, and a downloadable TruRisk™ Eliminate Report.
The new TruRisk™ Eliminate Overview dashboard is your central landing page for risk elimination insights and remediation planning. The page highlights your organization's addressable vulnerability exposure and provides actionable recommendations to reduce cyber risk more efficiently.
The Overview page is accessible from the TruRisk™ Eliminate > Home tab. For more information, see Risk Elimination Overview.
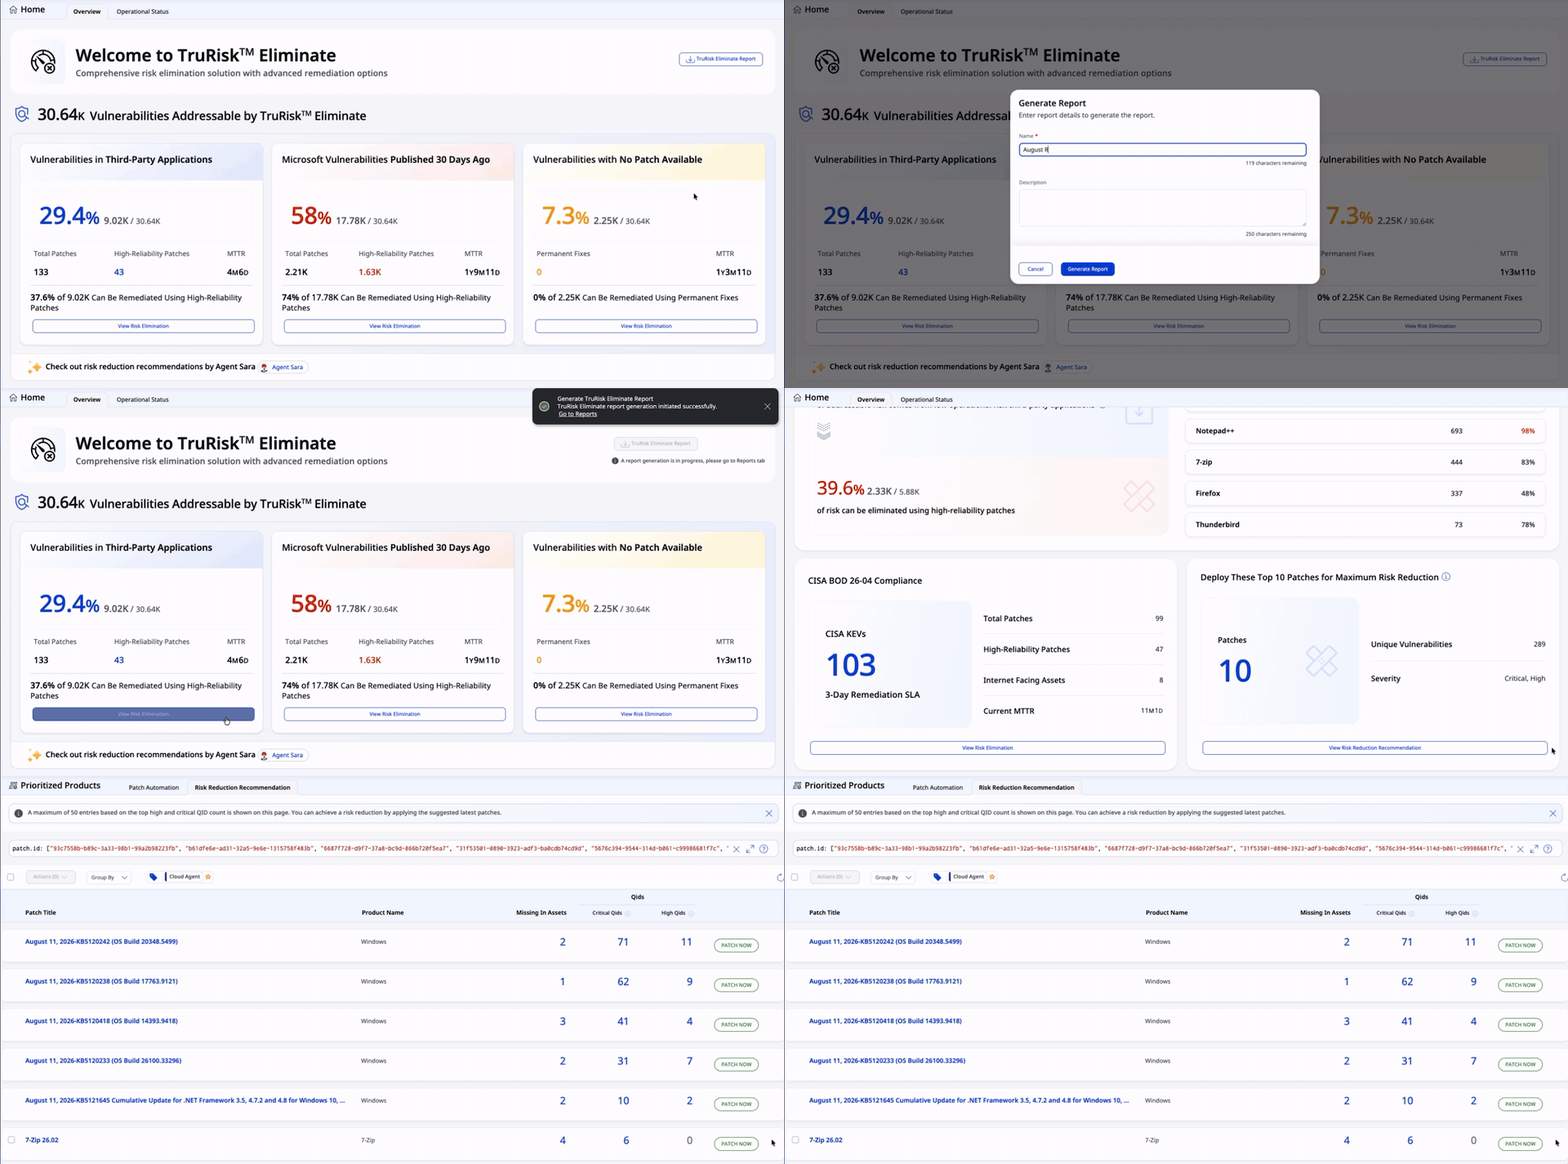
If you have a Patch Management free or trial subscription, this page also displays the View Feature Details and Enable Trial options. Use View Feature Details to compare your current capabilities and the features you will get after the upgrade to TE. You can directly enable your trial subscription using the Enable Trial option.
Dashboard Components
The TruRisk™ Eliminate Overview dashboard helps security teams quickly identify remediation priorities, improve compliance, and reduce cyber risk with AI-assisted recommendations and actionable insights.
The dashboard includes:
- Addressable Vulnerability Summary: View vulnerabilities you can remediate using TruRisk™ Eliminate. The View Risk Elimination option redirects you to the Eliminations tab, from which you can select the appropriate fix for the vulnerability. For a Patch Management-only subscription, you will only see the remediation option.
- Risk Elimination Opportunities: Identify high-impact remediation opportunities, including:
- Third-party application vulnerabilities
- Microsoft vulnerabilities older than 30 days
- Vulnerabilities with no vendor patch available
- AI-Assisted Risk Reduction: Agent Sara will provide AI-assisted recommendation plans to help accelerate risk reduction. This option will be available in a future release.
- Risk Reduction Recommendations: Identify the addressable risk coming from low operational risk third-party applications, the portion of it that high-reliability patches can eliminate, and the top products to target for zero-touch remediation.
- Compliance Insights: Monitor remediation progress for CISA Binding Operational Directive (BOD) 26-04, including Known Exploited Vulnerabilities (KEVs), affected internet-facing assets, Mean Time to Remediate (MTTR), and available patches.
- Maximum Risk Reduction: View the top 10 recommended patches that provide the greatest overall risk reduction. The View Risk Reduction option redirects you to the Risk Recommendations tab, which displays the available patches to create the deployment job.
- TruRisk Eliminate Report: Generate a detailed report of your risk and remediation posture. Click TruRisk Eliminate Report in the upper-right corner of the Overview page, provide a report name, and download it from the Reports tab once generated. It covers:
- Vulnerability coverage across Windows, Linux, and Mac through TruRisk™ Eliminate.
- Top Recommendations for Zero-touch Patch Automation.
- MTTR Performance and Leading Risk-Elimination Opportunities.
- Deep Dive into Diverse Risk Sources, Including Top CVEs Mitigated by Peers and Top EOL/EOS Bloatware Driving Risk.
New Feature
Track Operational Status of Remediation in One View
What's New for You
You now have a new Operational Status page, a single, user-specific view of asset activation, asset health, SLA violations, and deployment results across your patching program, refreshed every 24 hours.
The Operational Status page provides a centralized, user-specific view of your organization's patching posture and outcomes within Patch Management. It serves as a single destination for operational insights, providing key patch data across asset health, Service Level Agreement (SLA) compliance, deployment results, patch effectiveness, and risk reduction. All widget data is scoped to your subscription.
The Operational Status page is accessible from the TruRisk™ Eliminate > Home tab and is available to users with a TruRisk™ Eliminate subscription. The data for all the widgets is refreshed every 24 hours.
For more information, see About Operational Status.
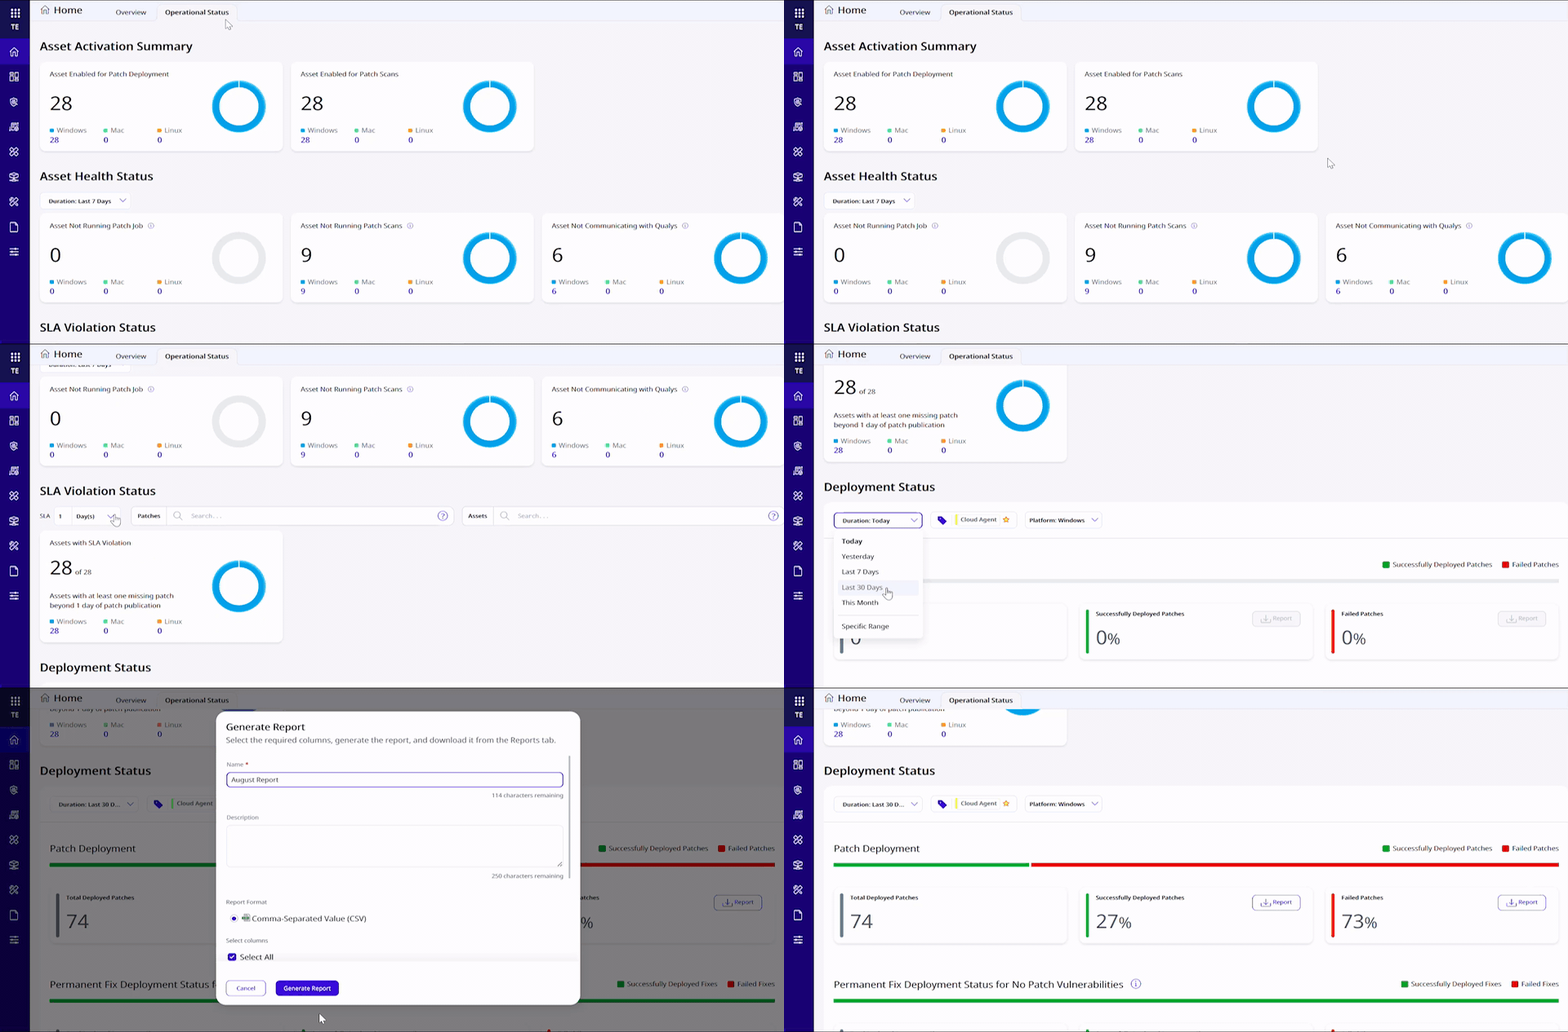
The Operational Status page includes the following default widgets:
- Asset Activation Summary: Displays the count of assets enabled for patch deployment and patch scanning across Windows, Mac, and Linux platforms. Clicking a count opens to the filtered assets list.
- Asset Health Status: Shows assets not running patch jobs and assets not communicating with Qualys. Supports time-based filters including Today, Yesterday, Last 7 Days, Last 30 Days, and Last 90 Days.
- SLA Violation Status: Identifies assets with missing patches that exceed the selected SLA threshold (for example, one day, one month, or up to 365 days or 12 months). Supports QQL token filtering to refine results by patch family or other attributes.
- Deployment Status: Shows total deployed patches along with success and failure rates based on the selected time range, platform, and tags. It also displays the details of permanent fixes for no patch vulnerabilities.
Key Benefits
- Unified Visibility: View the entire patching life-cycle from asset activation through patch effectiveness in one place without navigating multiple tabs or reports.
- Faster Issue Identification: Default widgets highlight the operational gaps, such as assets not activated for patching, assets not communicating with Qualys, running patch jobs, and SLA violations, enabling faster remediation.
- Granular Insights: Clickable widget counts and charts provide direct access to filtered assets, patches, jobs, or vulnerability views for deeper investigation.
Enhancement
Improved Asset Status in Job Progress
What Changed For You
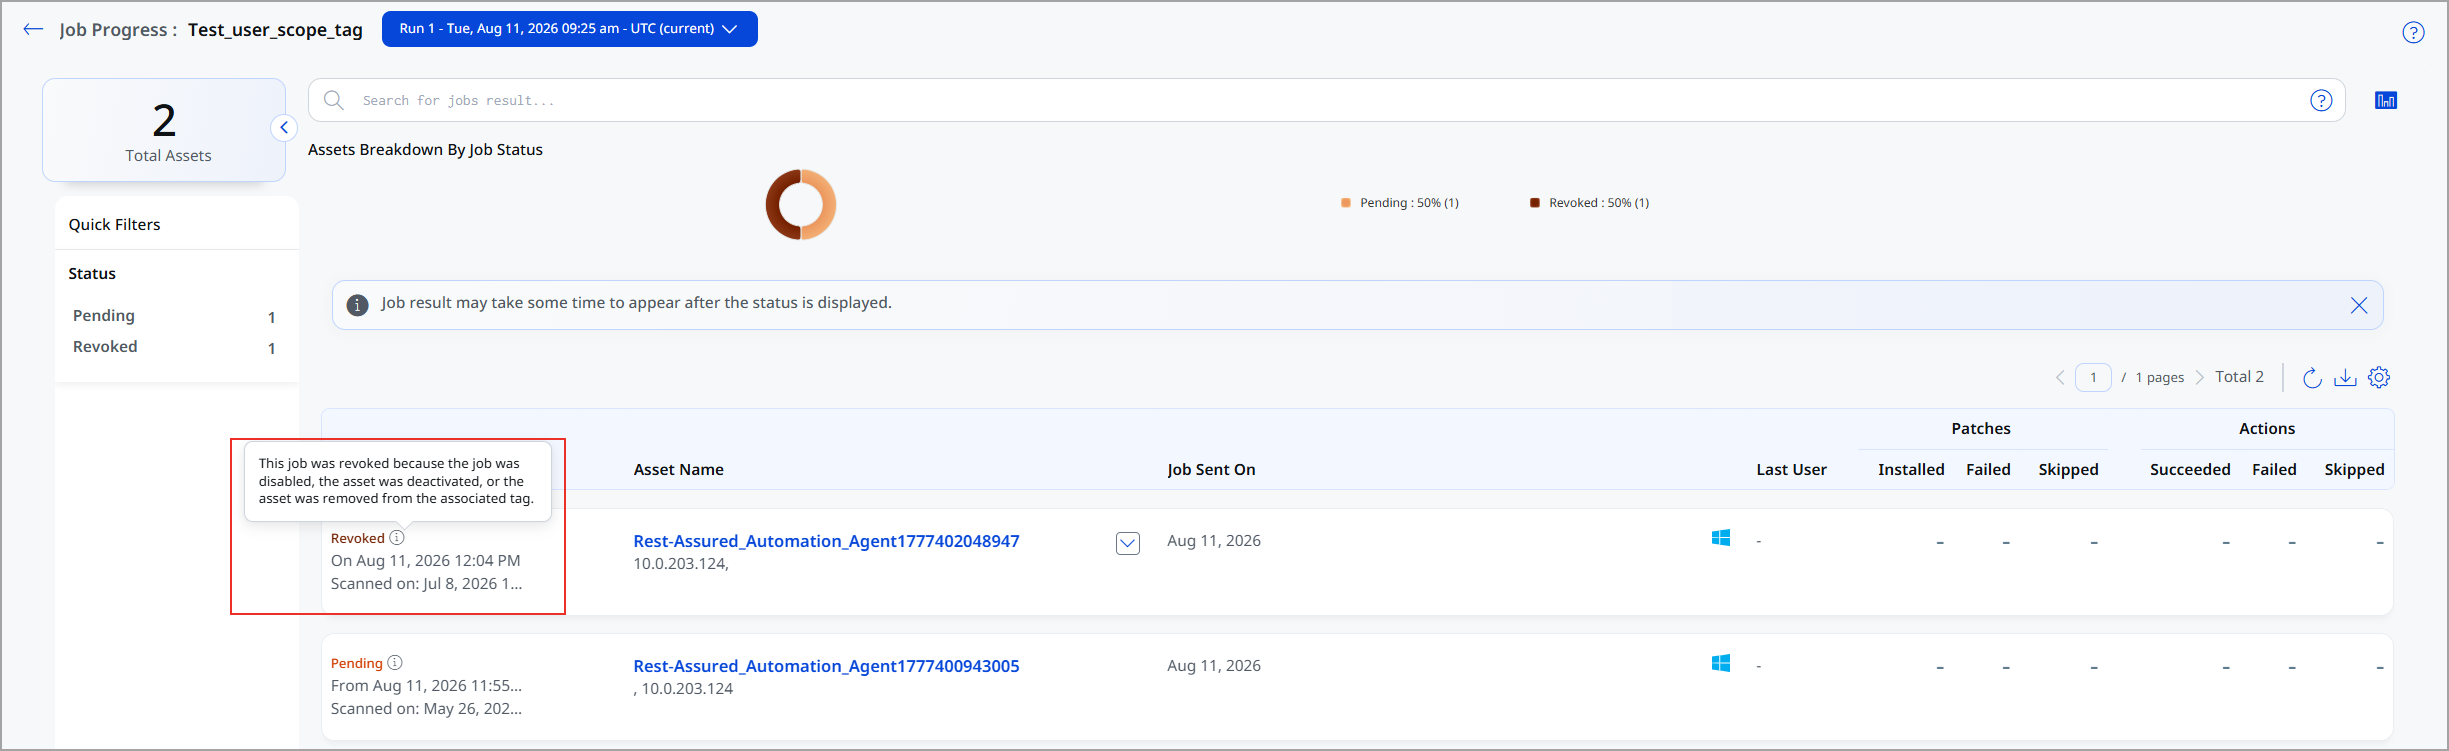
You'll now see a Revoked status, along with an explanation message, instead of an indefinite Pending status in Job Progress when an asset's manifest is revoked.
Assets with a revoked manifest now display a new Revoked status instead of Pending in the Job Progress view. An informational message is also shown to explain why the manifest was revoked, making it easier to identify the reason and understand the asset's current state.
Previously, assets remained in the Pending state indefinitely when a job's manifest was revoked, with no explanation of why the job was not progressing. This happened when the assets in a job changed after it was scheduled, for example, when an asset-tag association changed in a tag-based job, the affected asset was no longer eligible for the job but still showed as Pending.
For more information, see Asset Statuses List.
Fix
Issues Addressed
The following reported and notable customer issues are fixed in this release.
| Component/Category | Description |
|---|---|
| PM - UI | An issue occurred in which deployment jobs displayed an incorrect time zone during job creation. This issue occurred because the agent automatically selected the first entry in the Time Zone drop-down list, instead of the correct entry.
This issue is now fixed, and new jobs automatically select the user's local timezone. |
| PM - UI | An issue was fixed where the Next Trigger Date for scheduled patch jobs disappeared after the page finished loading.
The next trigger dates only for applicable jobs is now displayed in the UI. |
| PM - UI | An issue occurred where the Deployment Jobs page made repeated requests to retrieve tag information, resulting in slower page load times.
This issue was fixed, and the performance has improved. |
| PM - Job Scheduling | An issue occurred in which some patch jobs scheduled between 12:00 AM and 3:00 AM started about 24 hours after their scheduled times.
This issue was fixed, and the jobs now run at the intended scheduled time. |
| PM - UI | An issue occurred where Microsoft Edge patch failures with MSI error 1603 displayed incorrect troubleshooting information.
This issue has been fixed, and the correct error details and guidance are now displayed. |
| PM - UI | An issue occurred where the vulnerabilities.status token in the patch job vulnerability search was not found, although the same token was found in VMDR search.
This issue is now fixed, and the token is displayed in the patch job vulnerability search. |
| PM - UI | An issue occurred in which software uploads via the Pre/Post Deploy and Install Software actions failed at 500 MB, even for files within that limit. This happened because the file size was not calculated in binary units, misrepresenting the actual size.
This issue is now fixed with an accurate binary-based size calculation, and the updated supported file size is now visible in the UI. |
| PM - Assets | An issue occurred where the rebootrequired flag was reset, due to which expected results for the asset.isPendingReboot token were not returned.
This issue is now fixed and the QQL token results are now displayed correctly. |
| PM - Job Windows | An issue occurred where the time zone selected for a scheduled patch deployment job changed to a different time zone after the job was saved.
This issue has been fixed, and the selected time zone is now retained and displayed correctly in the job details. |
| PM - Job Scheduling | An issue occurred where some Patch Tuesday jobs scheduled between 12.00 AM and 3.00 AM were not getting executed.
This issue is fixed and the jobs now run at the scheduled time. |
| PM - UI | An issue occurred where navigating to the Options section from the Job Information page caused the Patch Management application to crash and display an error message.
This issue has been fixed, and users can now access the Options section without application crashes or errors. |