View Dashboard List
To view the created dashboard list and its creation date of your account, select the Dashboard tab and click the dashboard selector  or click the Manage Dashboards
 menu or navigate directly to the Manage Dashboards tab. The dashboards displayed in the Dashboard selector and Manage dashboards are listed in alphabetical order of the dashboard name.
The following screenshot is an example that shows the list of dashboards along with created date and time:

Dashboard Selector Tabs
The dashboard selector groups your dashboards into three tabs. The number next to each tab name shows how many dashboards the tab lists.
| Tab | Lists |
|---|---|
| Qualys Recommended | Dashboards that Qualys creates for each module and makes available to all users. This tab opens first. For details, see Qualys Recommended Tab. |
| Your Dashboards | The dashboards are created in your subscription that you can access. This tab does not include recommended dashboards. |
| Frequently Used | The dashboards you used in the past 30 days. |
| Favorites | The dashboards you marked as favorites. For details, see Mark Dashboard as Favorites. |
Qualys Recommended Tab
The Qualys Recommended tab lists dashboards that Qualys creates for each module and makes available to all users. Use these dashboards to see useful insights right away, without building dashboards from scratch. Trend widgets on these dashboards show trends from your own subscription's data.
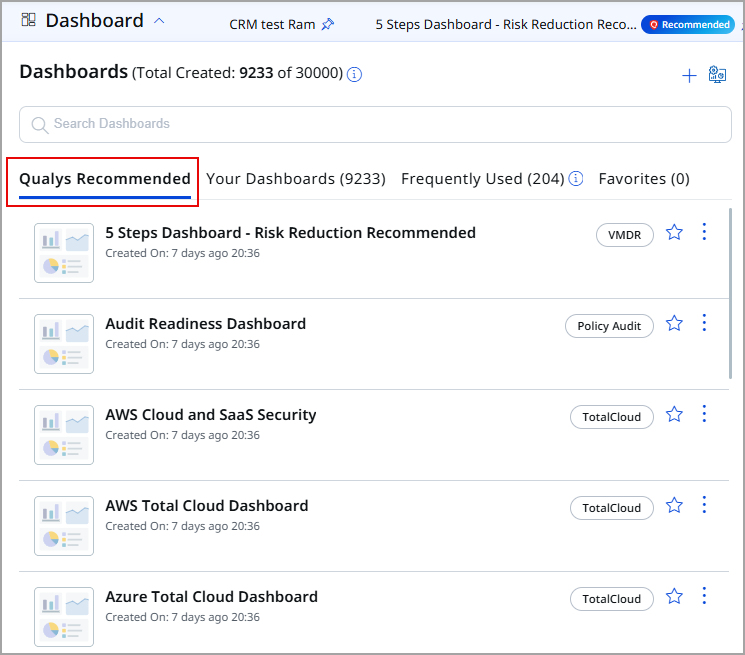
To view recommended dashboards:
- Go to the Dashboard tab and click the dashboard selector icon. The Qualys Recommended tab opens first.
- Find the dashboard that you want. Each dashboard shows a tag labeled with its module name, for example, VMDR or TotalCloud. To quickly find a dashboard, type its name in the Search Dashboards box.
- Click the dashboard to open it.
The dashboard opens in a new tab and shows a Recommended tag.
Actions for Recommended Dashboards
Recommended dashboards are read-only, so you cannot edit or delete them. To see the actions that you can perform, click the dotted icon next to a recommended dashboard.
| Action | Description |
|---|---|
| Set as default | Sets the recommended dashboard as your default dashboard. For details, see Set as Default Dashboard. |
| Pin Dashboard / Unpin Dashboard | Pins the recommended dashboard to the dashboard tabs, or unpins it. For details, see Pin Dashboard. |
| Open as a new Dashboard Tab | Opens the recommended dashboard in a new dashboard tab. |
| Prints the recommended dashboard. | |
| Export | Exports the recommended dashboard. |
To mark a recommended dashboard as a favorite, click its star icon. Recommended dashboards that you mark as favorites appear in the Favorites tab, and recommended dashboards that you use appear in the Frequently Used tab.
Default Recommended Dashboard
Each module with recommended dashboards has one default recommended dashboard. The Unified Dashboard always pins this dashboard as the first dashboard tab in that module. You cannot close or unpin this tab, and it does not count toward your pin limit.
Recommended dashboards do not appear in the Your Dashboards tab and do not count toward your subscription's dashboard limit. For details, see Dashboard Limit.
Frequently Used Tab
The Frequently Used tab lists only the dashboards you used in the past 30 days, so you can open the dashboards you rely on without scrolling through the full list.
Opening a dashboard, generating a report from it, or exporting it counts as use. The tab always covers the most recent 30 days. When you stop using a dashboard, it is removed from the Frequently Used tab after 30 days of inactivity, but it remains available in the All Dashboards tab. When you use it again, it returns to the Frequently Used tab.
To view your frequently used dashboards:
- Go to the Dashboard tab and click the dashboard selector icon.
- Click the Frequently Used tab.
- To see a description of the tab, hover over the info icon next to Frequently Used.
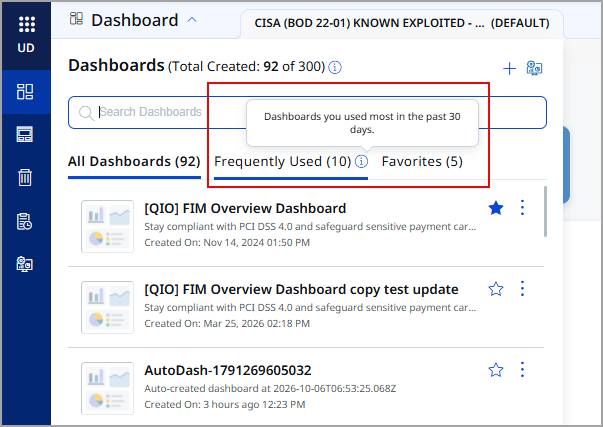
You can mark a dashboard as a favorite from the Frequently Used tab by clicking its star icon. For more information, see Mark Dashboard as Favorites.
On the Manage Dashboards tab, you can click on the column names to sort the dashboards as per the Created By, Created On, Last Updated By, Last Updated On and Last Used columns. The following screenshot shows the dashboards sorted by the Created On column.

The Last Used dashboard data is tracked only for dashboards created after 2022.