Bubble Widget
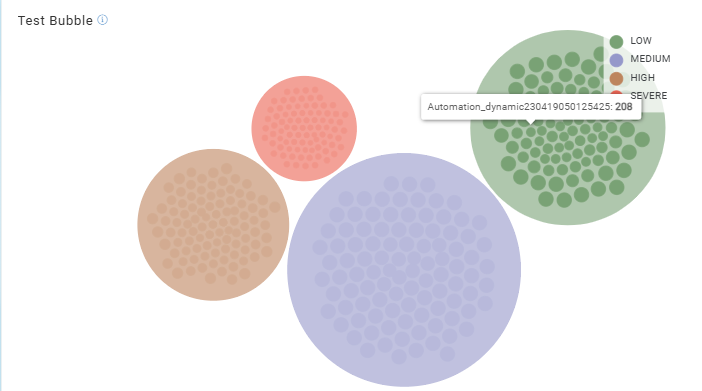
Bubble widget provides an enhanced way to visualize the data. Each inner circle in the bubble widget represents a tag which is a logical grouping of assets. The outer circle of the bubble widget represents the Asset Risk Score (ARS) range. The inner and outer circles are clickable and directs the user to the Vulnerabilities page.
Bubble widget is available only for Vulnerability Management application.
Perform the following steps to create Bubble widget:
- On the dashboard, click the Add Widget
 button. The widget library is displayed.
 - Click Build your widget.
- On the left pane, select Vulnerability Management application.
- On the right panel, select Bubble widget.
- Provide a name for the widget and enable the Show description on widget check box to display widget description.
- Click Query Settings.
- Provide Asset Query in the Asset Query field. To add a vulnerability query click Add Vulnerability query.
Currently, you can implement Group By TruRisk Range and Tags for Bubble chart.
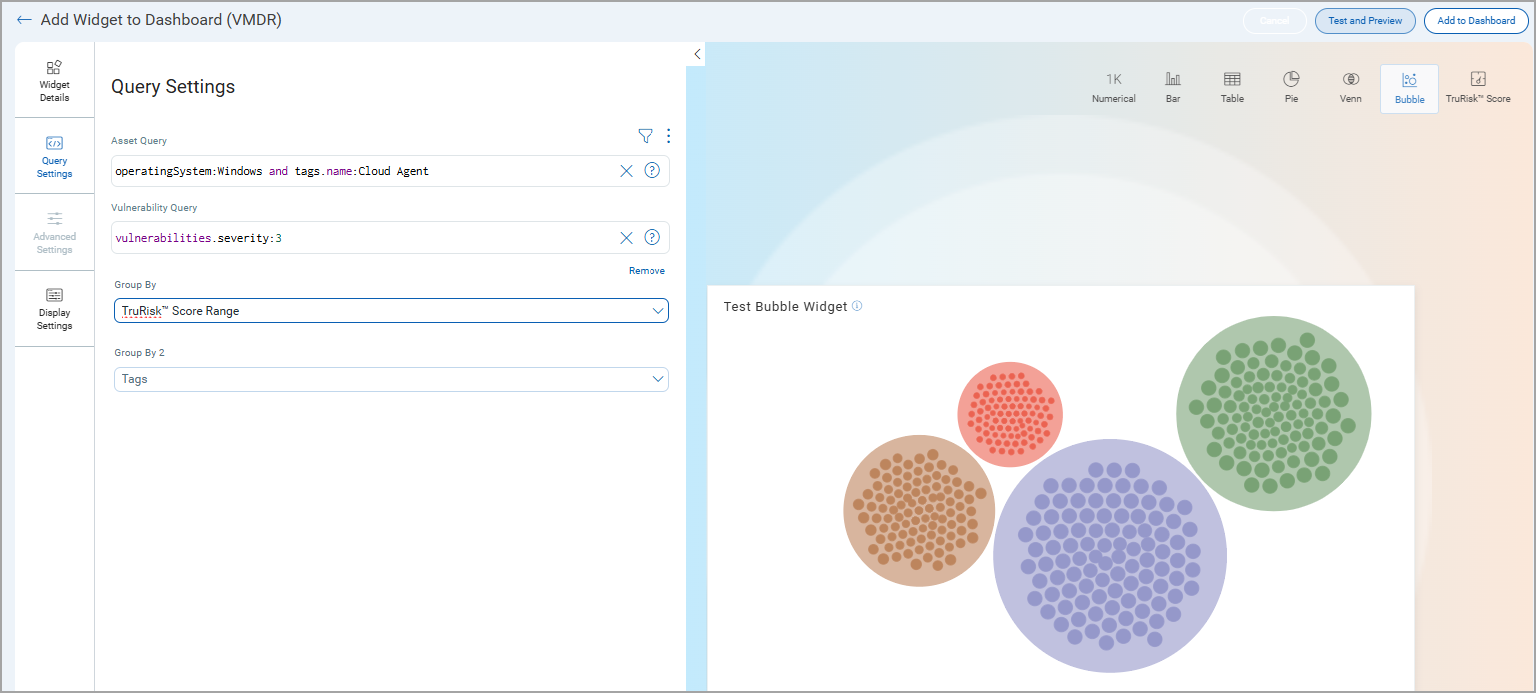
- In the Display Settings, toggle Show Legend to view the Legends of the Bubble chart.
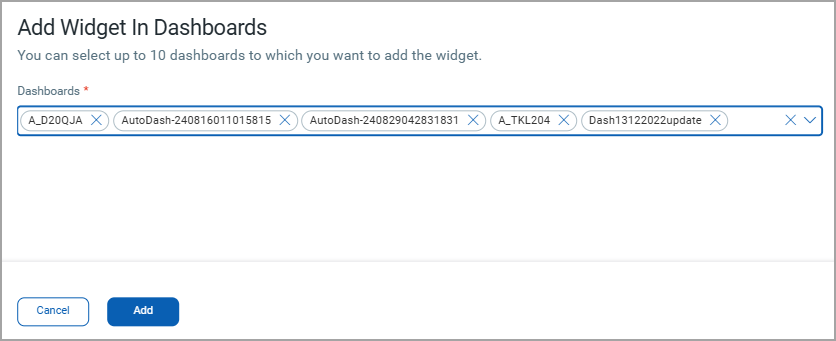
- Click Add to Dashboard to complete widget creation and view the widget on the dashboard. In Add widgets in dashboards window you can provide names of up to 10 dashboards to add the widget. Click Add.
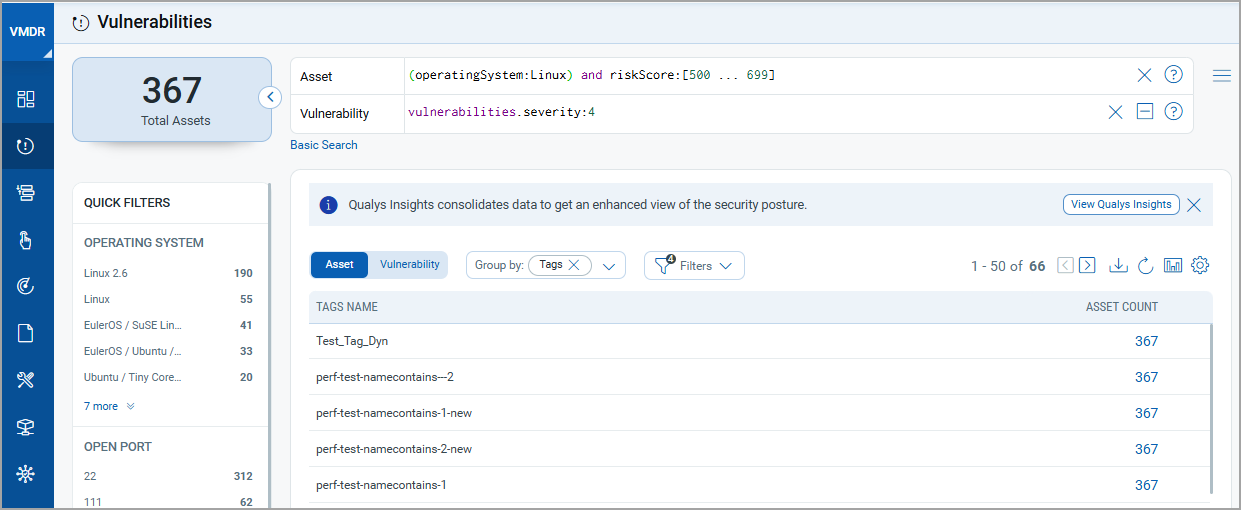
- To view the report of the query created, hover the mouse on the inner circles. Select the inner or outer circle. You are redirected to the Vulnerabilities page that lists the assets or vulnerabilities.
The following screenshot is an example if you select the inner circle:

The following screenshot is an example if you select the outer circle: