Multi-Grouped Table Type
You can visualize, consolidate, and communicate multiple data points through a single widget using multi-grouped table widget.
The multi-source table widget type is available only for the Vulnerability Management and Policy Audit applications.
Create Multi-Grouped Table Type
You could build your search query for a vulnerability and then group the search results using multiple pre-defined parameters. Perform the following steps to build a grouped table:
- On the dashboard, click the Add Widget
 button. The widget library is displayed.
 - Click Build your widget.
- On the right pane, choose the Table widget Type.
- On the left pane, select Vulnerability Management application.
- Provide a name for the widget.
- Select the Show Description on widget check box to display the widget description on the dashboard.
- Click Query Settings.
- Choose the Display result as: Vulnerability or Asset
- Based on your preference, add an asset or vulnerability query that you want to populate in the widget. For information on search queries, refer to Search Tutorial. Using the
 search action menu, you can view the frequently-used QQL queries, save, and manage them with ease. Looking for the different actions on the search queries, see Search Actions.
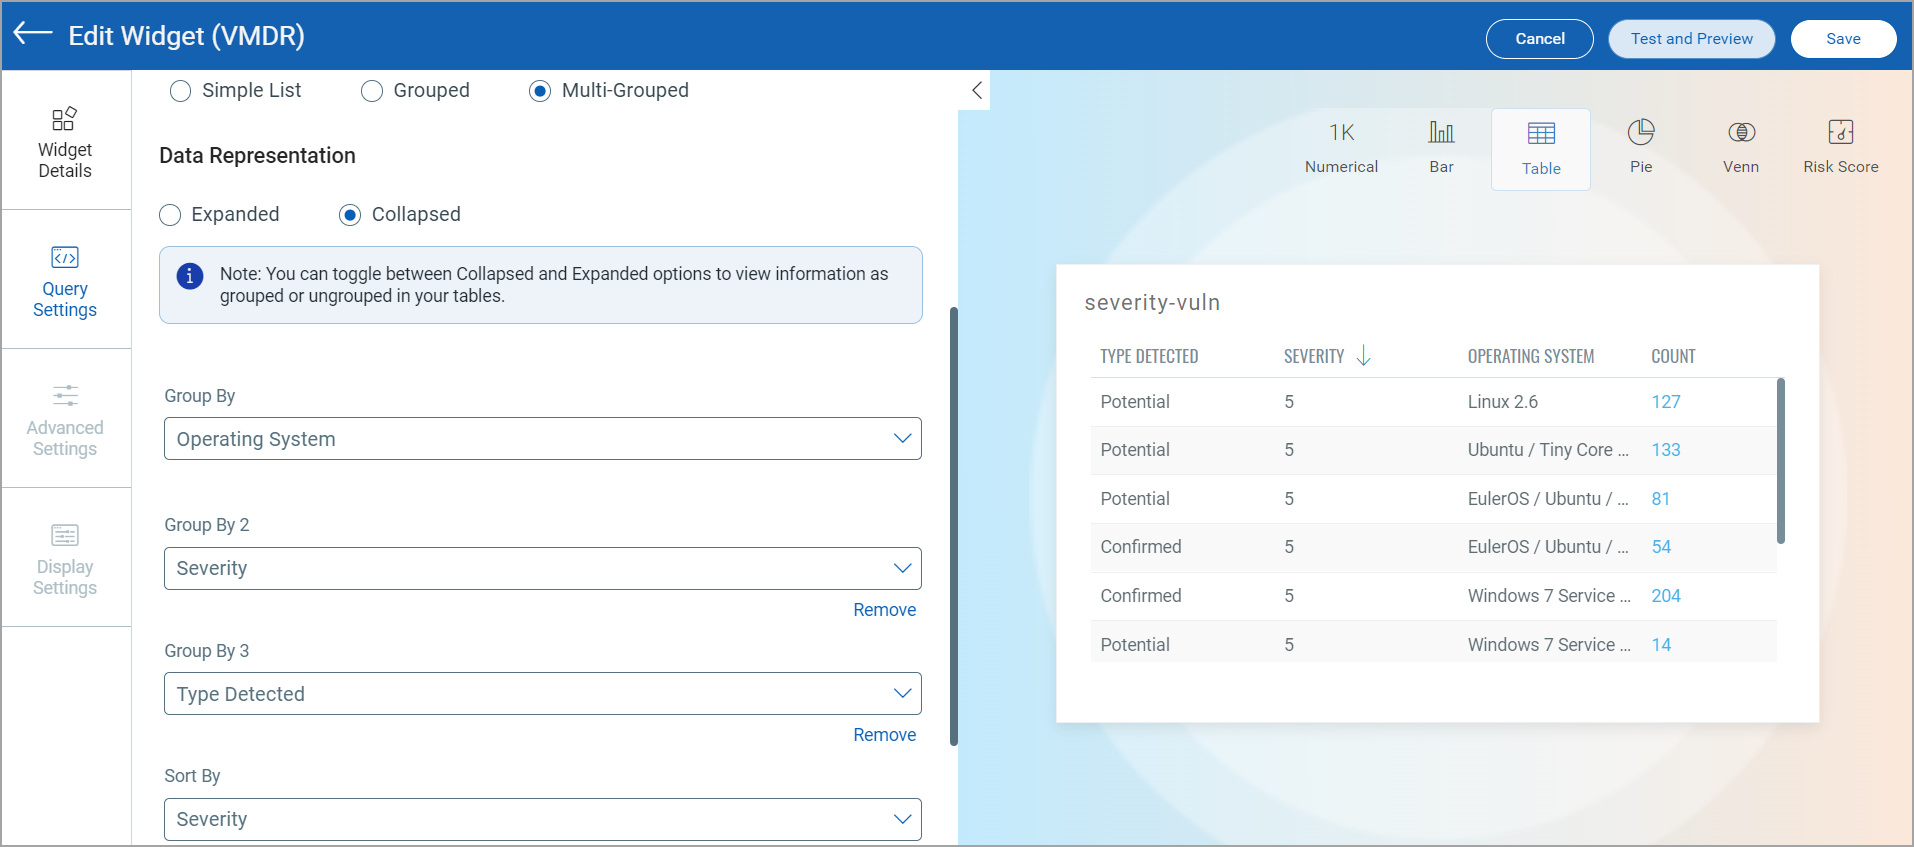
 - Select Multi-Grouped as Table Type.
- Choose the type of data representation you want in the table.
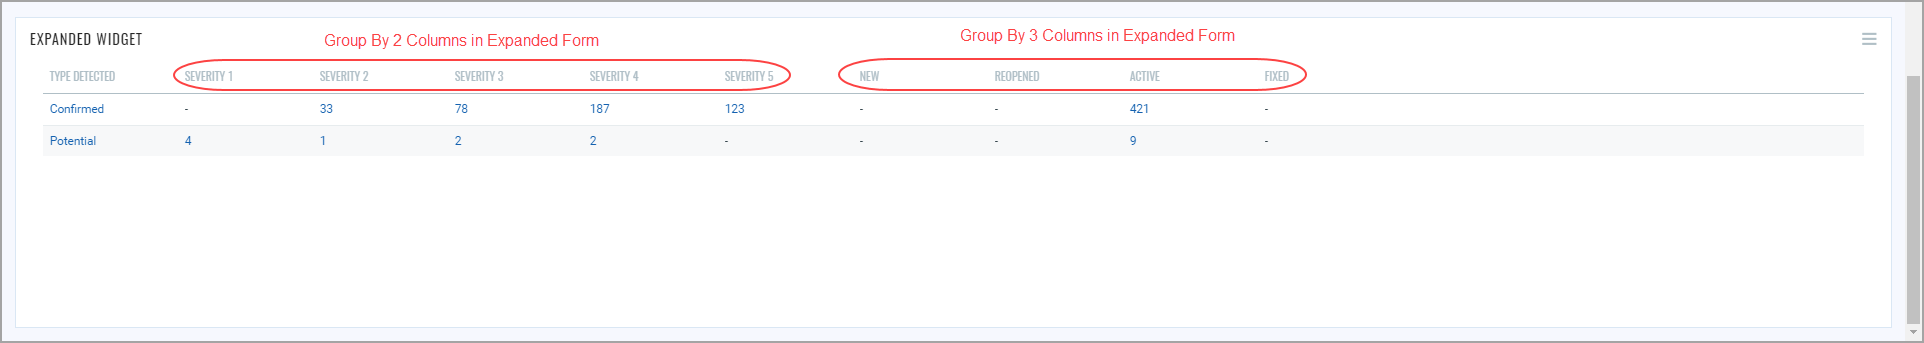
- Expanded: The values of data points selected through Group By 2 and Group By 3 fields are added as separate columns in the table. For example, if you choose table to be grouped by Type Detected, Severity (Group 2), and Status (Group 3). The values for Type Detected (Confirmed, Potential) are listed as rows in the table, while the values for Severity (Severity 1, Severity 2, and so on) and Status (Re-opened, Active, Fixed) are listed as separate columns in the table.
If you choose Status as one of the Group By fields, the Exclude Vulnerabilities filter is not applicable to the Fixed status column in the table. Similarly, if you choose Type Detected as one of the Group By fields, the Exclude Vulnerabilities filter is not applicable to the Information type detected column.
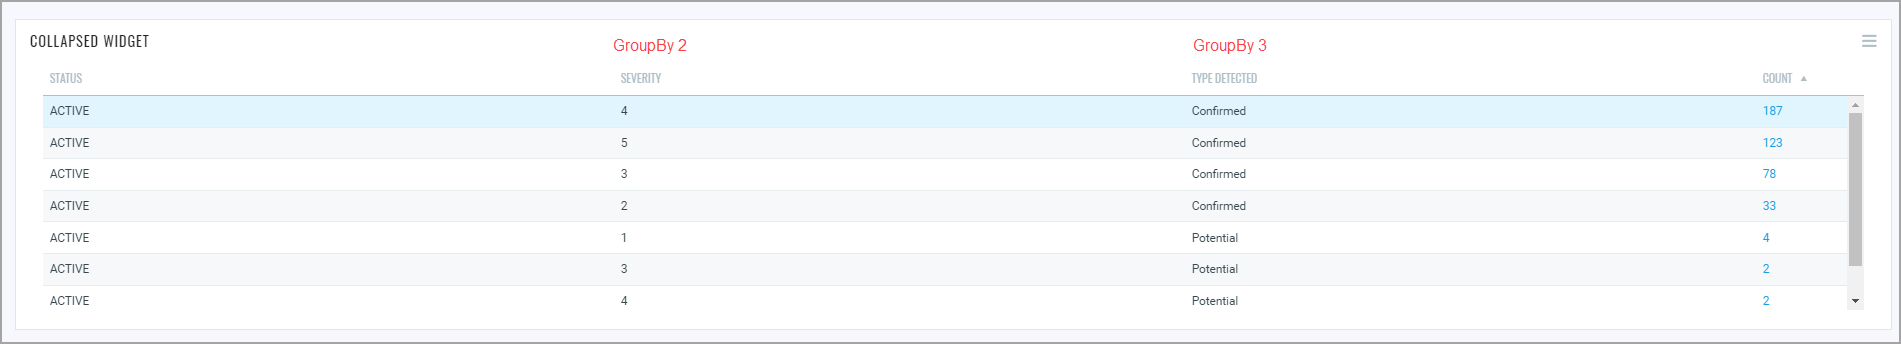
- Collapsed: The data points selected through Group By fields are added as columns in the table. For example, if you choose to the table to grouped by Status, Severity (Group 2), and Type Detected (Group 3). The data points Severity and Type Detected are grouped as columns in the table.
- Expanded: The values of data points selected through Group By 2 and Group By 3 fields are added as separate columns in the table. For example, if you choose table to be grouped by Type Detected, Severity (Group 2), and Status (Group 3). The values for Type Detected (Confirmed, Potential) are listed as rows in the table, while the values for Severity (Severity 1, Severity 2, and so on) and Status (Re-opened, Active, Fixed) are listed as separate columns in the table.
- Group By: Select the categorization parameter for the data fetched by search query. Depending on the search result of Query 1, the parameters that can be grouped are pre-populated. Type the parameter name and select from the pre-populated list.
- Group By 2: Select another parameter for categorization of the data fetched by search query. Depending on the search result of Query 1 and parameter selected in Group By, the parameters in Group By 2 are pre-populated. Type the parameter name and select from the pre-populated list.
- Group By 3: Similar to Group By 2, you could choose third parameter to categorize the data fetched by the search result. Type the parameter name and select from the pre-populated list.
- Sort By (only for Vulnerability option): Choose Count or Severity to sort the data type. The Severity option in the Sort By field is displayed if you select Severity in the Group By field.
- Display Limit: Select Top or Bottom to display data in descending or ascending order. You can also select from 50, 25, 10 for the data to be populated in the bar widget.
The following screenshot is a Collapsed example of Top 10 vulnerabilities that are grouped in the sequence from Group By 3 to Group By:
You can view the preview of the widget and configure the parameters as per your requirement. Click Add to Dashboard to complete widget creation and view the widget on the dashboard.