You use a compliance scorecard report template to report on compliance status for multiple policies across different environments.
Go to PC > Reports > Templates to view the compliance report templates in your account. To create a new scorecard template, select New > Scorecard Template. To edit an existing one hover over a scorecard template and select Edit from the Quick Actions menu.
When you run a compliance scorecard template you'll be prompted to select up to 20 policies and up to 10 asset groups or asset tags to include in the report. Your report will include the hosts that match at least one of the selected policies and at least one of the selected asset groups/tags.
You'll need to choose the timeframe you want to report on - from the last 1 day to the last 90 days. We'll only report on compliance evaluation data collected within your selected timeframe.
Choose the control criticality levels you want to report on. When you clear a criticality, we'll filter out all controls with that criticality from the report.
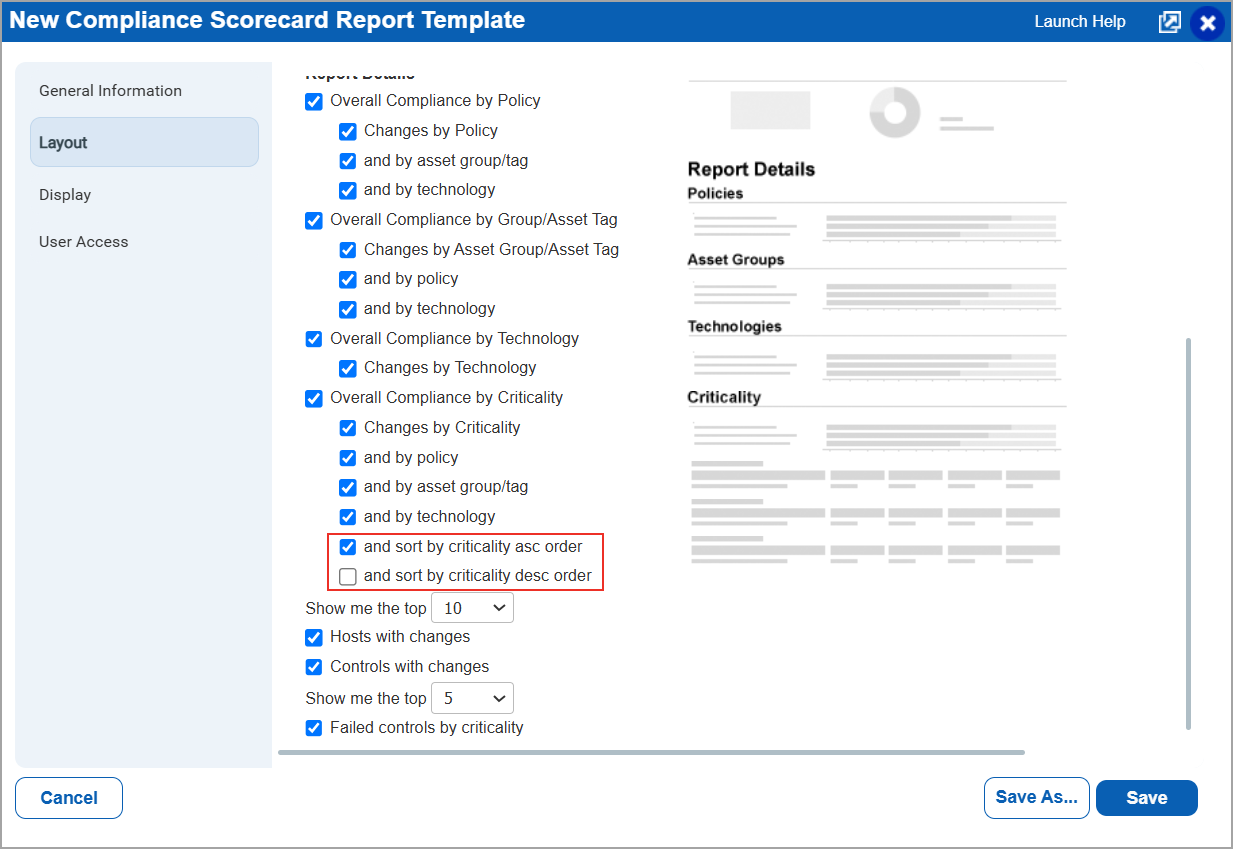
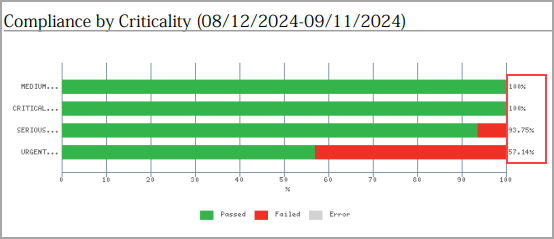
You can sort the compliance criticality in ascending or descending order. Go to Reports > Templates > New or Edit from the Quick Action menu > Scorecard Template > Layout, and under Overall Compliance by Criticality, select the checkbox and sort by criticality asc order or and sort by criticality desc order.
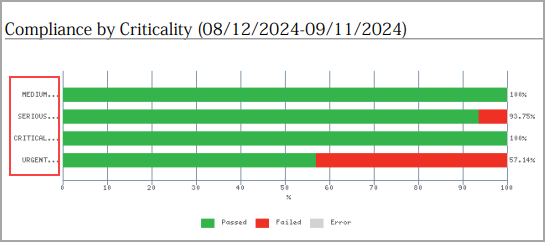
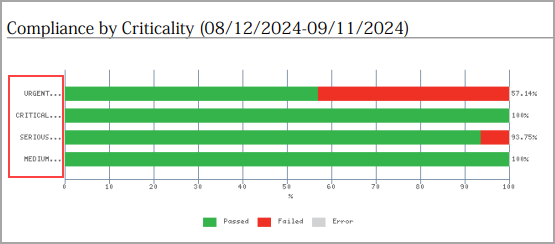
The Scorecard report displays the criticality levels in the following order when you sort in the following order:
This is applicable to all the options available under Overall Compliance by Criticality. You can view the selected order in the Compliance Scorecard Report Template Information page.
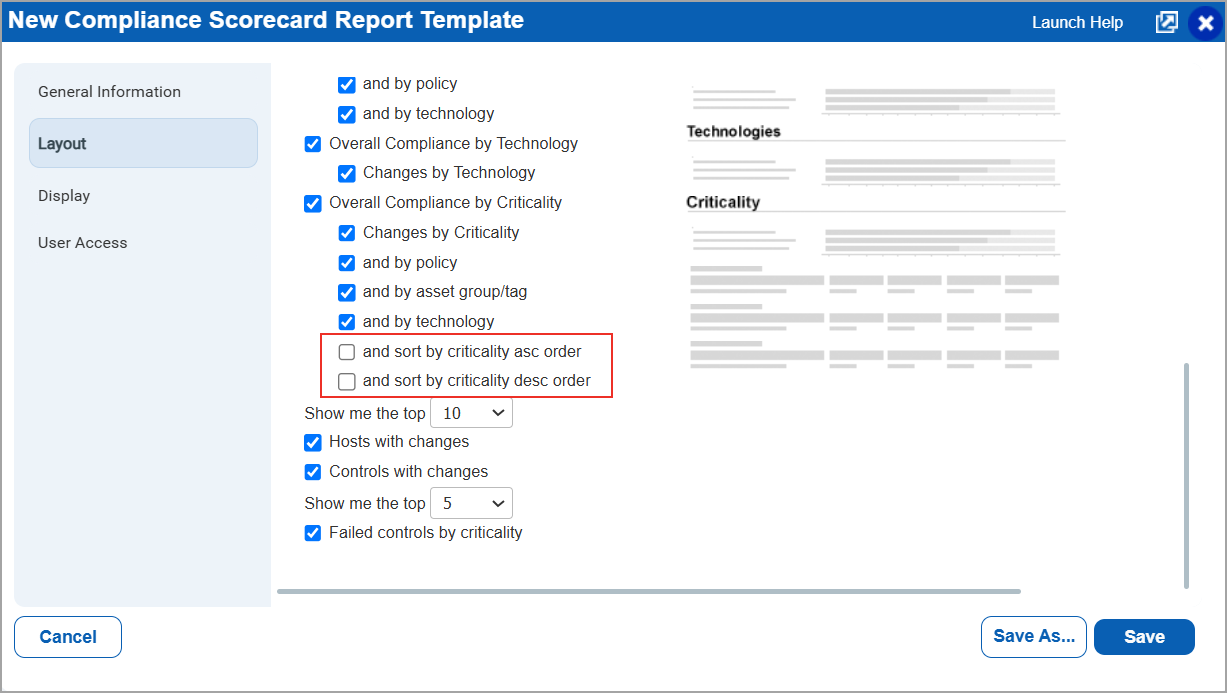
Sorting of compliance criticality is supported in all the scorecard report formats like PDF, HTML, and XML.
Note: When you do not select any options, the compliance criticality is displayed as per the highest criticality percentage.
You'll notice that there are multiple ways you can report on your compliance data - by policy, by asset group/asset tag, by technology and by criticality. For each section, you can include the current compliance status by selecting the "Overall Compliance" option. For example, select Overall Compliance by Policy to include a bar graph in your report that shows the current number of passed, failed and error control instances for each policy in the report.
You can include a breakdown of compliance status changes that occurred during your report timeframe. Select the "Changes by" options to include change details in the report. For example, you can include changes by policy, changes by policy and by asset group/tag, and changes by policy and by technology. Selecting all options allows you to see the same data broken down in different ways.
Choose whether you want to see the top 10, 25 or 50 hosts and controls with changes. You'll see the hosts and controls with the highest number of control instances that changed compliance status during your report timeframe. These lists show the number of control instances that changed to a Pass status, changed to a Fail status and changed to an Error status.
Choose whether you want to see the top 5 or 10 failed controls for each criticality level included in the report. For example, the top 5 failed Urgent controls, the top 5 failed Critical controls, the top 5 failed Serious controls, and so on. These are the controls with the highest number of failed instances.
This is a spot where you can add required information like a disclosure statement or data classification (e.g. Public, Confidential). The text you enter will appear in all reports generated from this template, except reports in XML and CSV formats.
Here's a quick look at key sections in the Compliance Scorecard Report: