Measure the Likelihood of Vulnerability Exploitation
Traditional vulnerability scoring focuses on technical severity but does not reflect the real-world likelihood of exploitation.
Qualys TruRisk™ introduces two foundational scores that enable risk-based vulnerability management:
Qualys Vulnerability Score (QVS) and Qualys Detection Score (QDS).
Together, these scores translate technical findings into contextual, actionable risk intelligence.
Qualys Vulnerability Score (QVS)
QVS is calculated first. It operates at the CVE level and measures the likelihood of a specific vulnerability being exploited in the wild. QVS answers the question: How likely is this specific CVE to be exploited?
QVS is computed for all vulnerabilities in the National Vulnerability Database (NVD), including those without Qualys detection signatures (QIDs), ensuring comprehensive coverage. Each CVE in the Qualys database receives its own QVS, even if a Qualys detection signature (QID) does not yet exist.
QVS provides a contextual risk assessment by combining traditional vulnerability metrics with real-world threat intelligence.
The scoring framework first evaluates the threat attributes of a CVE. If the CVE is listed in the CISA KEV catalog or associated with known malware or threat actors, it receives a higher weight (more than 90%). The remaining weight (10%) is applied to exploit maturity, EPSS, and trending factors. If no threat attributes are present, 65% weight of the score is assigned to the CVSS Base Score, which measures the technical severity, exploitability, and potential impact on confidentiality, integrity, and availability.
The remaining 35% is distributed across exploit maturity, EPSS, trending feed, and other threat intelligence factors.
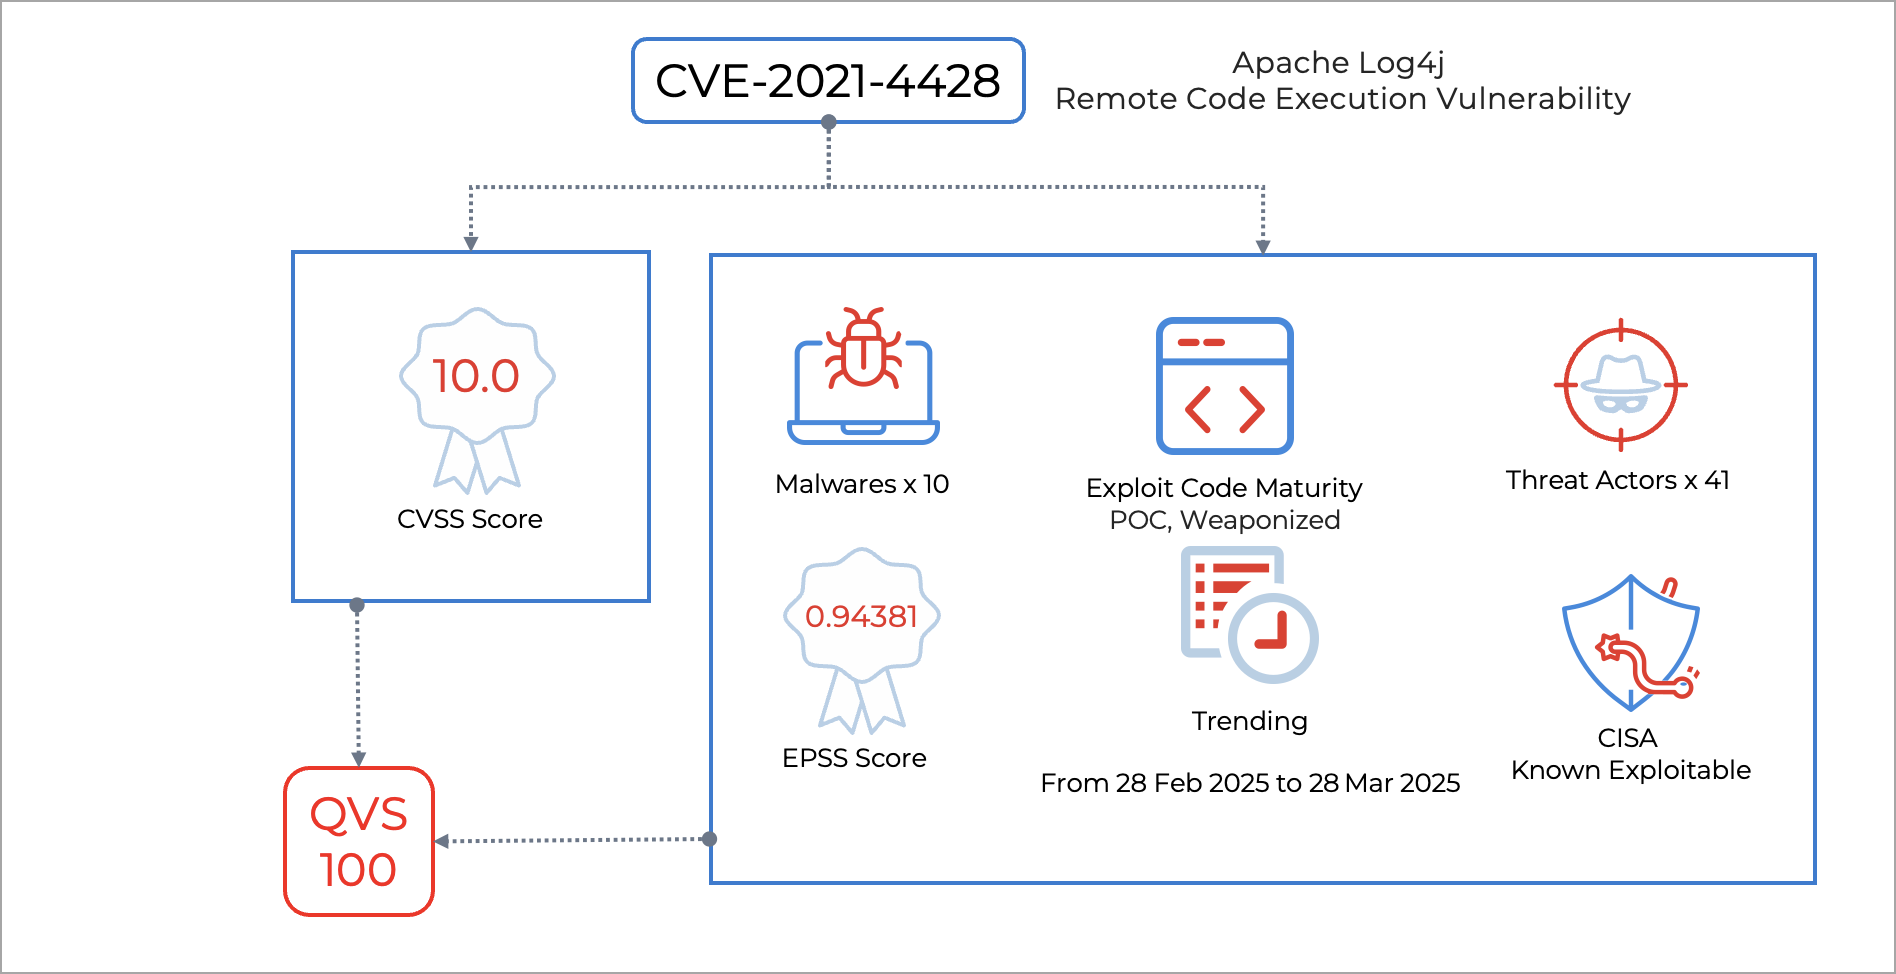
For example, a QVS score of 100 indicates a high CVSS base score combined with confirmed active exploitation in the wild. It reflects widespread threat-actor interest, available exploit code, and a significant potential for business impact. Such vulnerabilities are prioritized for remediation because they combine high technical severity with active real-world threat activity.
QVS Risk Factors
The following table lists the QVS risk factors in a sequential order:
| Sequence | Key Factor | Description |
| 1 | CVSS Base Score, EPSS, CISA KEV |
The QDS algorithm starts with the CVSS score as the foundational input for assessing technical vulnerability severity. |
| 2 | Threat Actors | Validates exploitation by threat actors or ransomware groups. Vulnerabilities actively used by these groups receive the highest threat level ratings. |
| 3 | Malware | Verifies active exploitation by malware families. Vulnerabilities currently exploited by malware receive elevated risk ratings. |
| 4 | Exploit Code Maturity | Evaluates the sophistication of available exploit code. Weaponized exploits (mature and easily usable for system compromise) receive higher ratings than Proof-of-Concept (PoC) exploits (theoretical or with limited functionality). |
| 5 | Exploit Type and Real-Time Threat Indicators (RTIs) | Analyzes vulnerability type classification. Remote exploitation vulnerabilities and web application vulnerabilities receive higher risk ratings than Denial-of-Service (DoS) vulnerabilities. |
| 6 | Trending in the Wild | Monitors recent exploitation activity within the last 14 days across the Dark Web, social media, GitHub, and other intelligence sources. Trending vulnerabilities receive additional risk elevation. |
The above factors are evaluated using more than 300,000 CVEs tracked from 25+ different exploit and threat intelligence sources (as of November 2025) . Building an accurate risk profile for any CVE requires combining multiple inputs to assess its overall risk. QDS leverages these factors to calculate a vulnerability's true risk level.
QVS Beyond NVD Dependencies
Some CVEs may not appear in the National Vulnerability Database (NVD) for several days or even longer. This delay can occur if the vulnerability has not yet been made public or if there are limited research resources to complete the NVD entry.
In such cases, the Qualys Security Research Team assigns CVSS scores in accordance with NVD standards to maintain consistency in scoring. When the NVD has not yet processed a CVE, Qualys creates QIDs based on vendor advisories and internal threat research. QVS is then calculated using Real-Time Threat Indicators (RTIs) instead of waiting for official NVD scoring. This weighted model applies 20% of the available CVSS data and 80% of the RTI analysis to provide proactive, risk-based scoring.
Example: QID 6017591
This QID exists without associated CVEs because the CVE has not yet been published in the NVD.
Despite this:
- RTIs indicate "Exploit Code Available" and "Denial of Service" potential.
- Both factors are classified as Severe by Qualys Threat Research.
- Easy exploitation combined with availability impact results in a Critical QVS score.
CVE-2025-21655 is one such example.
This proactive approach enables immediate risk assessment and prioritization, even when NVD data is pending.
As a result, you may occasionally see high QDS scores for detections that appear medium severity, because Qualys uses multiple intelligence sources beyond NVD data.
Understanding the Qualys Vulnerability Score for CVEs
The Qualys Vulnerability Score (QVS) is a Qualys-assigned score that evaluates a vulnerability based on multiple factors linked to its CVE.
These include the CVSS base score and external threat indicators such as active exploitation, exploit code maturity, and inclusion in CISA Known Exploited Vulnerabilities (KEV) or similar threat lists.
QVS is also calculated for vulnerabilities that do not have Qualys detection signatures (QIDs).
For QIDs without published CVEs or with low QDS values, QVS is computed using Real-Time Threat Indicators (RTIs) such as Zero-Day Exploits, Active Attacks, Ransomware, and Wormable vulnerabilities.
You can query and display vulnerabilities using either Qualys Identifiers (QIDs) or industry-standard CVEs, allowing flexible, cross-referenced analysis for more effective risk management.
For details, see Understanding Old and New Vulnerability Queries.
You can also retrieve individual QVS score insights. For details, see Qualys TruRisk API Support in dedicated API endpoint.
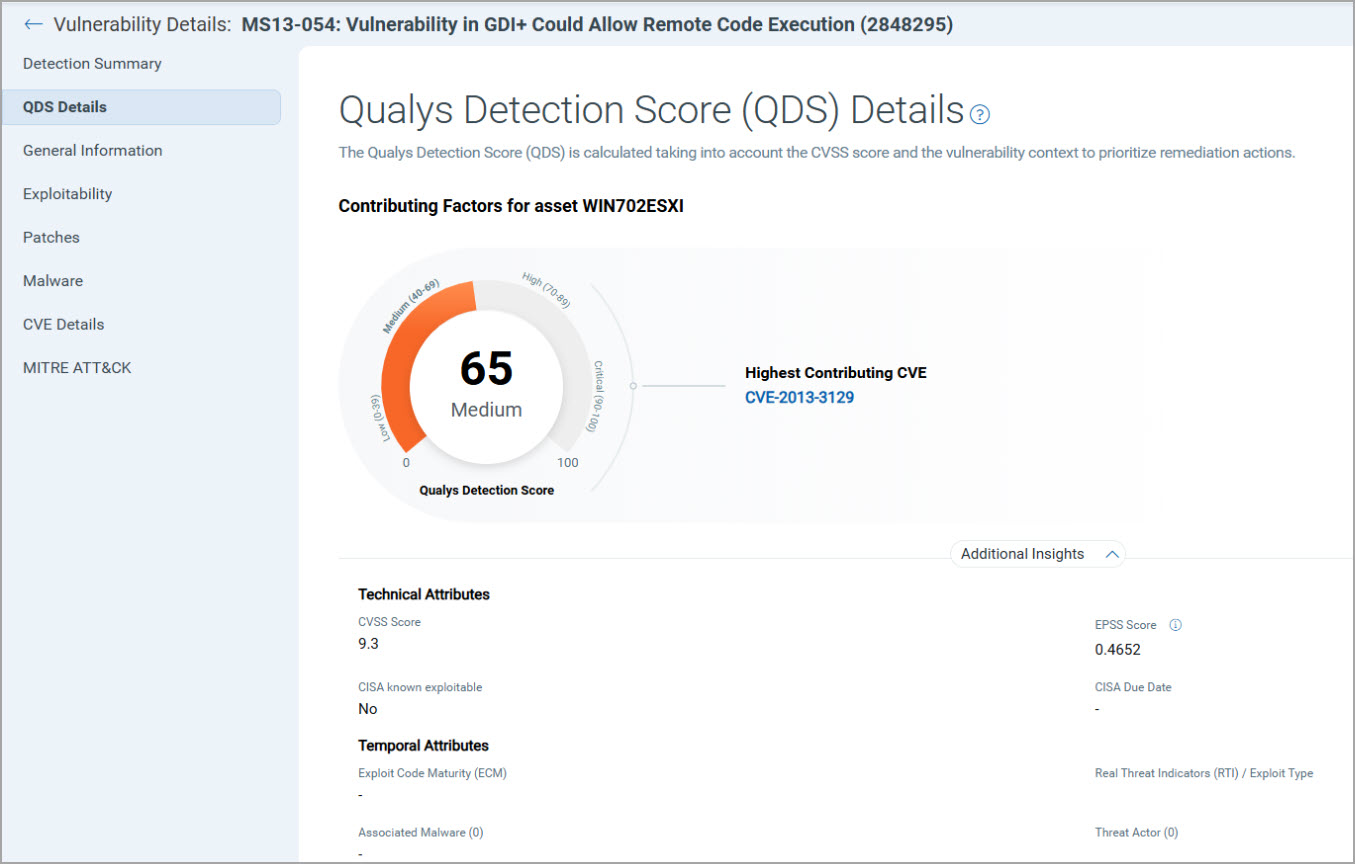
Qualys Detection Score (QDS)
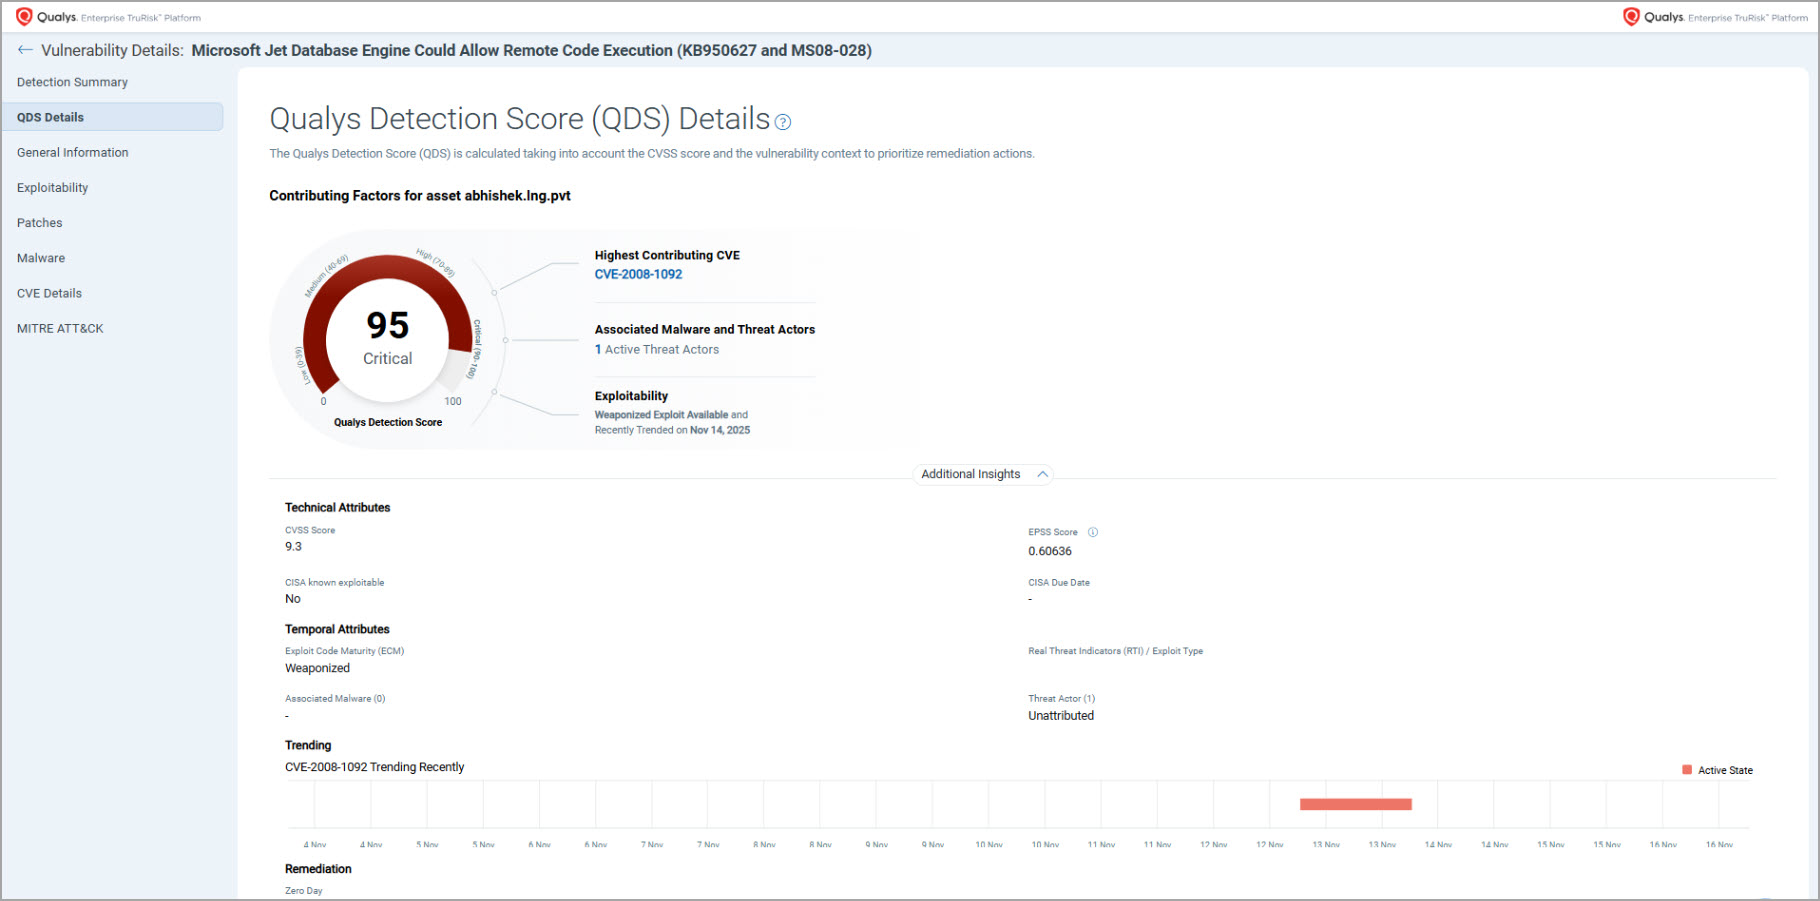
The Qualys Detection Score (QDS) operates at the QID level and represents the primary score for vulnerability prioritization. It consolidates multiple CVEs associated with a detection and uses the highest QVS among them to determine the QDS value. QDS answers the question: How risky is this detection (QID) in my current environment?
Example:
QID 355352 is associated with two CVEs:
CVE-2023-32233 (QVS 75) and CVE-2023-2269 (QVS 30).
Since the highest QVS is 75, the resulting QDS for QID 355352 is 75, ensuring that the most critical CVE drives prioritization.
QDS has a range from 1 to 100 and with four severity levels:
- Critical: 90-100
- High: 70-89
- Medium: 40-69
- Low: 1-39
We recommend prioritizing vulnerabilities with a TruRisk™-QDS score of 70 or higher.
How QDS Is Derived
Each QID in Qualys may map to one or more CVEs. QDS consolidates this information into one actionable detection-level score.
| QID | CVE Relationship | Description | QDS Calculation |
| Single QID | Single CVE | The QID maps to one CVE. | QDS equals the QVS for that CVE. |
| Single QID | Multiple CVEs | The QID maps to multiple CVEs. | QDS takes the highest QVS among all mapped CVEs. |
QDS also considers:
- Threat intelligence factors: exploit code maturity, malware associations, and active threat campaigns.
- Environmental adjustments: compensating controls that reduce exploitability (for example, RDP disabled on affected assets).
QVS and QDS Relationship
QVS provides the foundation for exploit likelihood, while QDS consolidates those results into a single operational score that drives prioritization and remediation decisions. The following table explains their relationship.
| Stage | Metric | Level | Purpose |
| 1 | QVS | CVE | Measures the likelihood of exploitation for each CVE using CVSS and threat indicators. |
| 2 | QDS | QID | Aggregates QVS values and contextual factors to produce one detection-level risk score. |
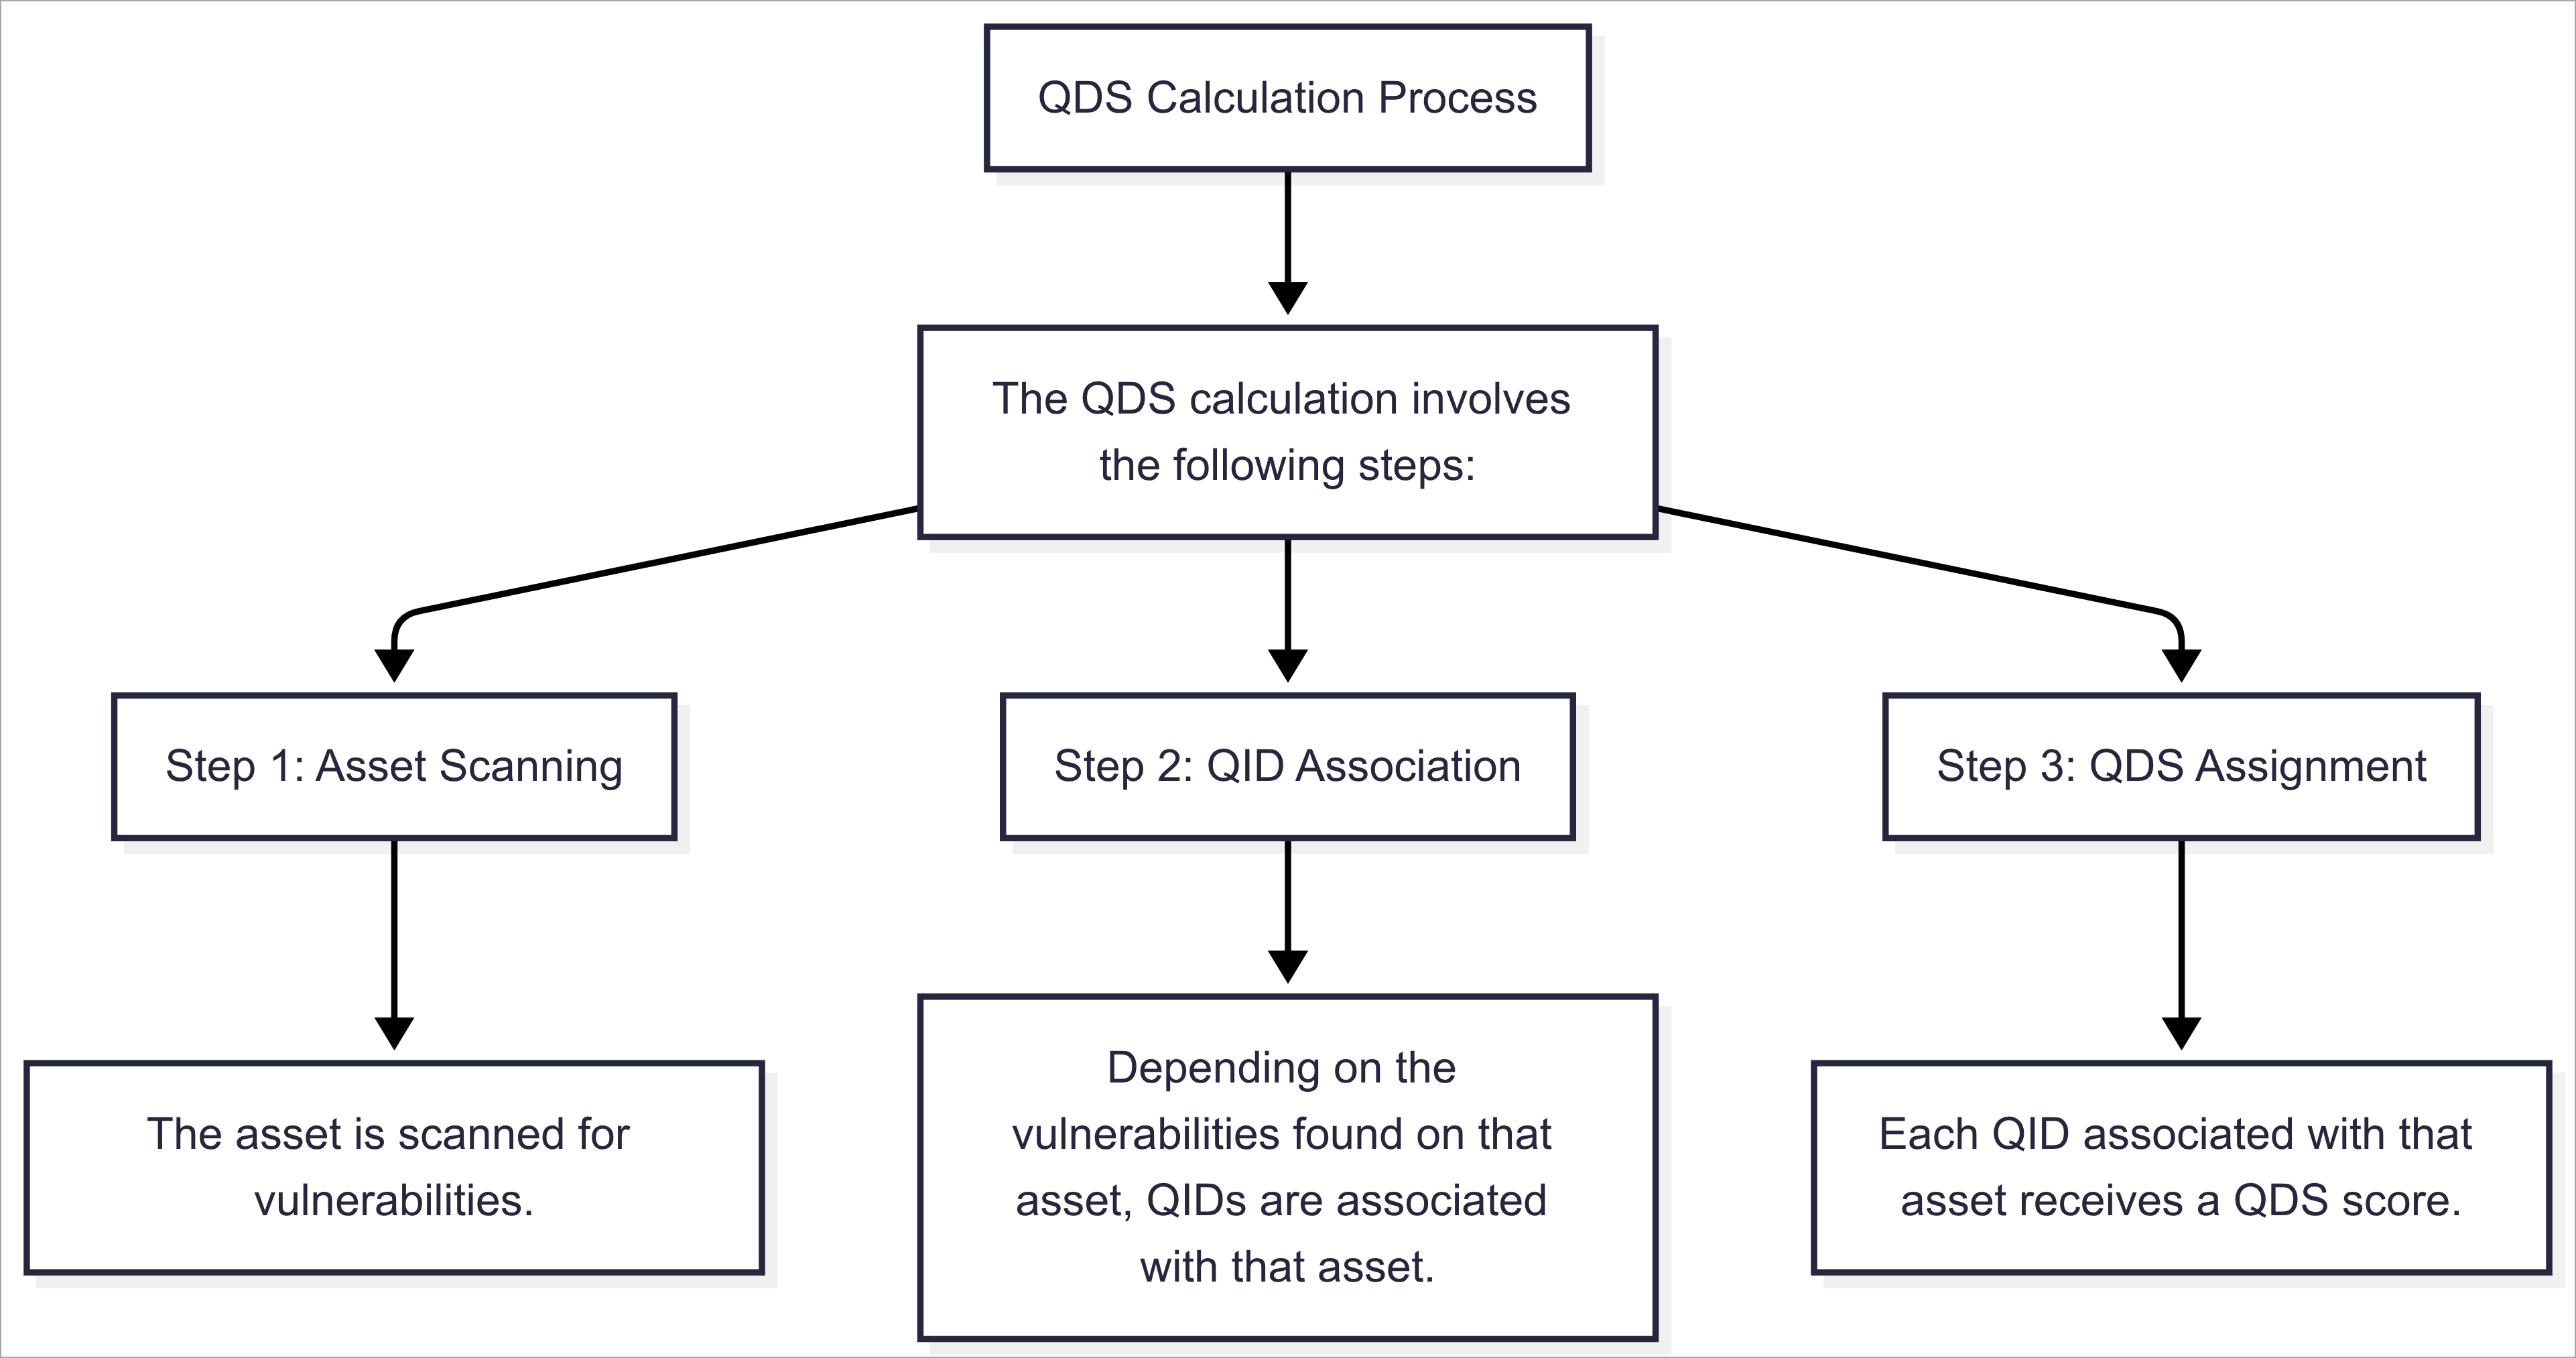
QDS Calculation Process
The QDS calculation involves the following steps:
QIDs are not only associated with vulnerabilities. They are also associated with information gathered from that asset. These information-gathering QIDs do not have a QDS associated with them and do not affect the TruRisk™ Score of that asset.
QDS vs CVSS
A vulnerability with a low CVSS score can still have a high QDS, as attackers often exploit less-severe vulnerabilities to evade detection. Organizations that rely solely on CVSS may overlook such threats and underestimate their actual risk exposure.
Example 1 - Low CVSS, High QDS
To identify vulnerabilities with a QDS of 90 or higher and low CVSS criticality, use the following QQL query:
vulnerabilities.vulnerability.cvss2Info.baseScore<4.0 and vulnerabilities.vulnerability.cvss3Info.baseScore<4.0 and vulnerabilities.detectionScore>79
In this example, CVE-2023-20867 has a CVSS score of 3.9. Yet, it appears in the CISA Known Exploited Vulnerabilities (KEV) list, is linked to an active malware campaign, and is being exploited by multiple threat actors.
This demonstrates why QDS provides critical insight beyond CVSS alone, highlighting vulnerabilities that are actively exploited despite low technical severity.
Example 2 - High CVSS, Low QDS
Some vulnerabilities may have a high CVSS score but a low QDS when there is no evidence of active exploitation or associated threat activity.
Organizations focusing only on CVSS might treat these as high risk even though the likelihood of exploitation is low.
To identify vulnerabilities with a QDS of 70 or lower and a Critical CVSS classification, use the following QQL query:
vulnerabilities.vulnerability.cvss2Info.baseScore>=7.0 and vulnerabilities.vulnerability.cvss3Info.baseScore:7.0 and vulnerabilities.detectionScore:<=40
In this example, CVE-2021-43905 has a CVSS score of 9.6, yet its QDS remains low due to the absence of known exploits or malware activity.
This indicates that while the vulnerability is technically severe, its real-world exploitation likelihood is minimal.