Tell me about the Policy Summary
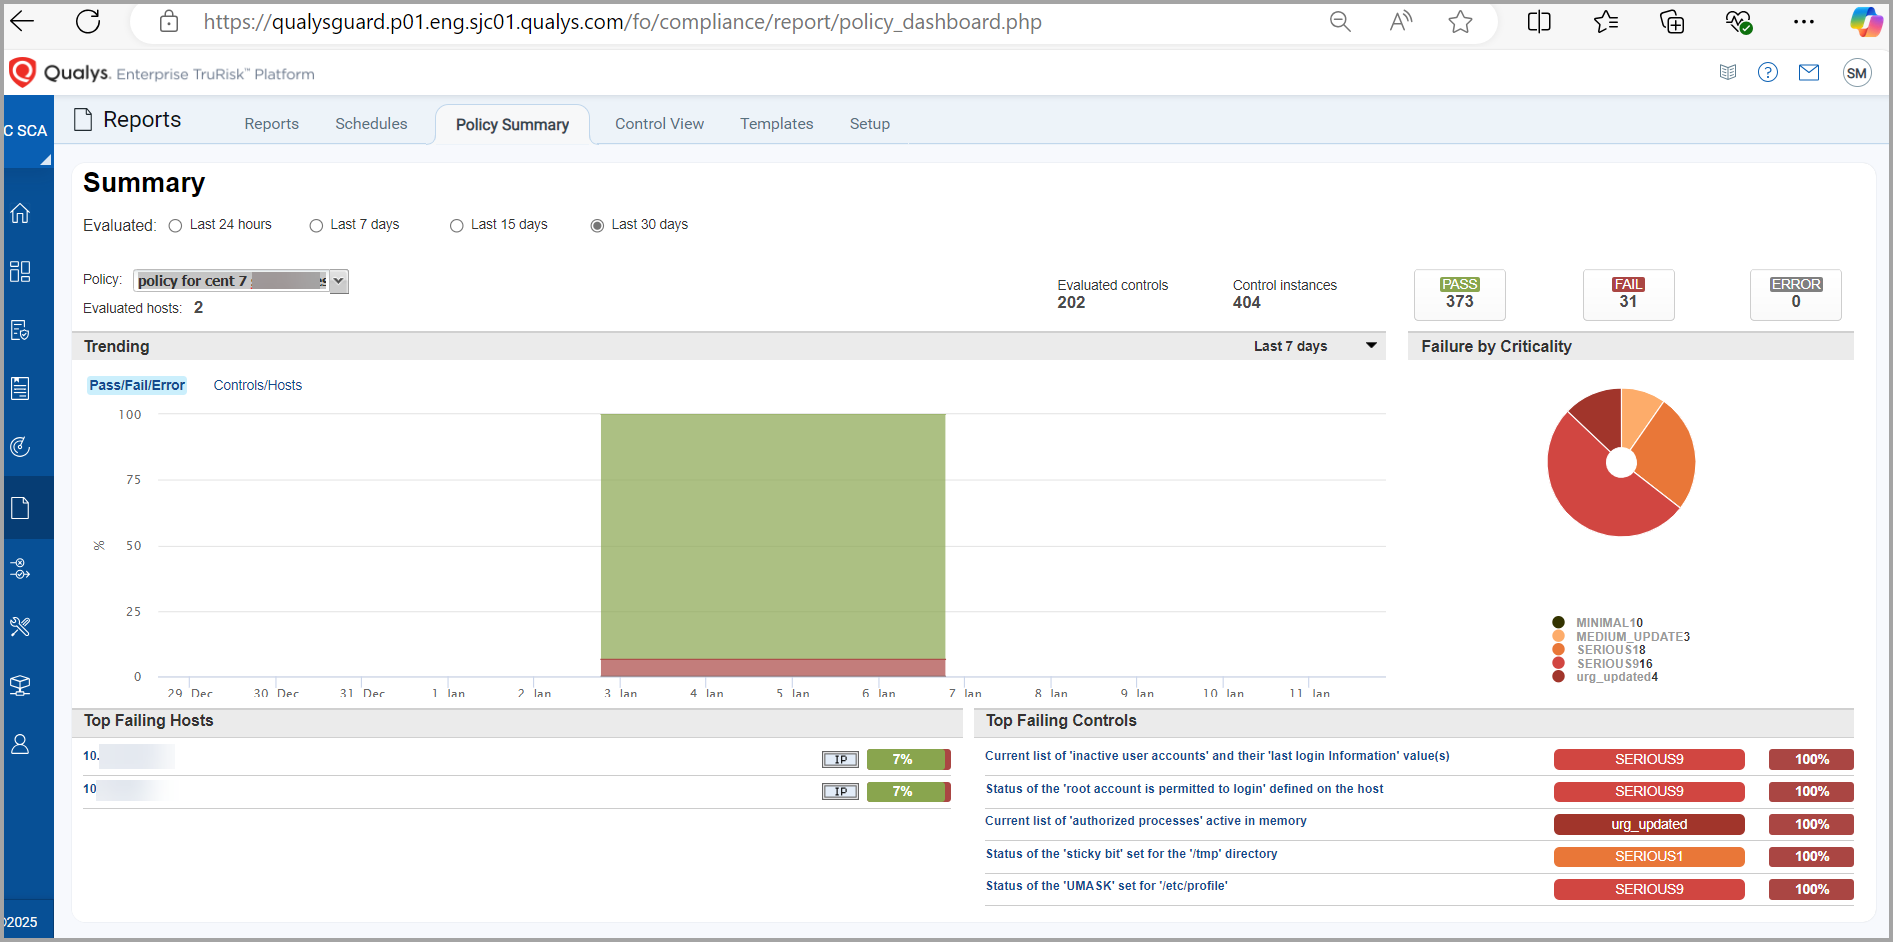
Run a Policy Summary to get a dashboard view of your compliance status for a single policy. The Policy Summary will include data for controls evaluated in the selected timeframe.
Choose the policy you're interested in from the Policy menu, and choose a timeframe filter option next to Evaluated. Your options are: Last 24 hours, Last 7 days, Last 15 days or Last 30 days (the default). The timeframe filter is applied to all sections, except the Trending graph.
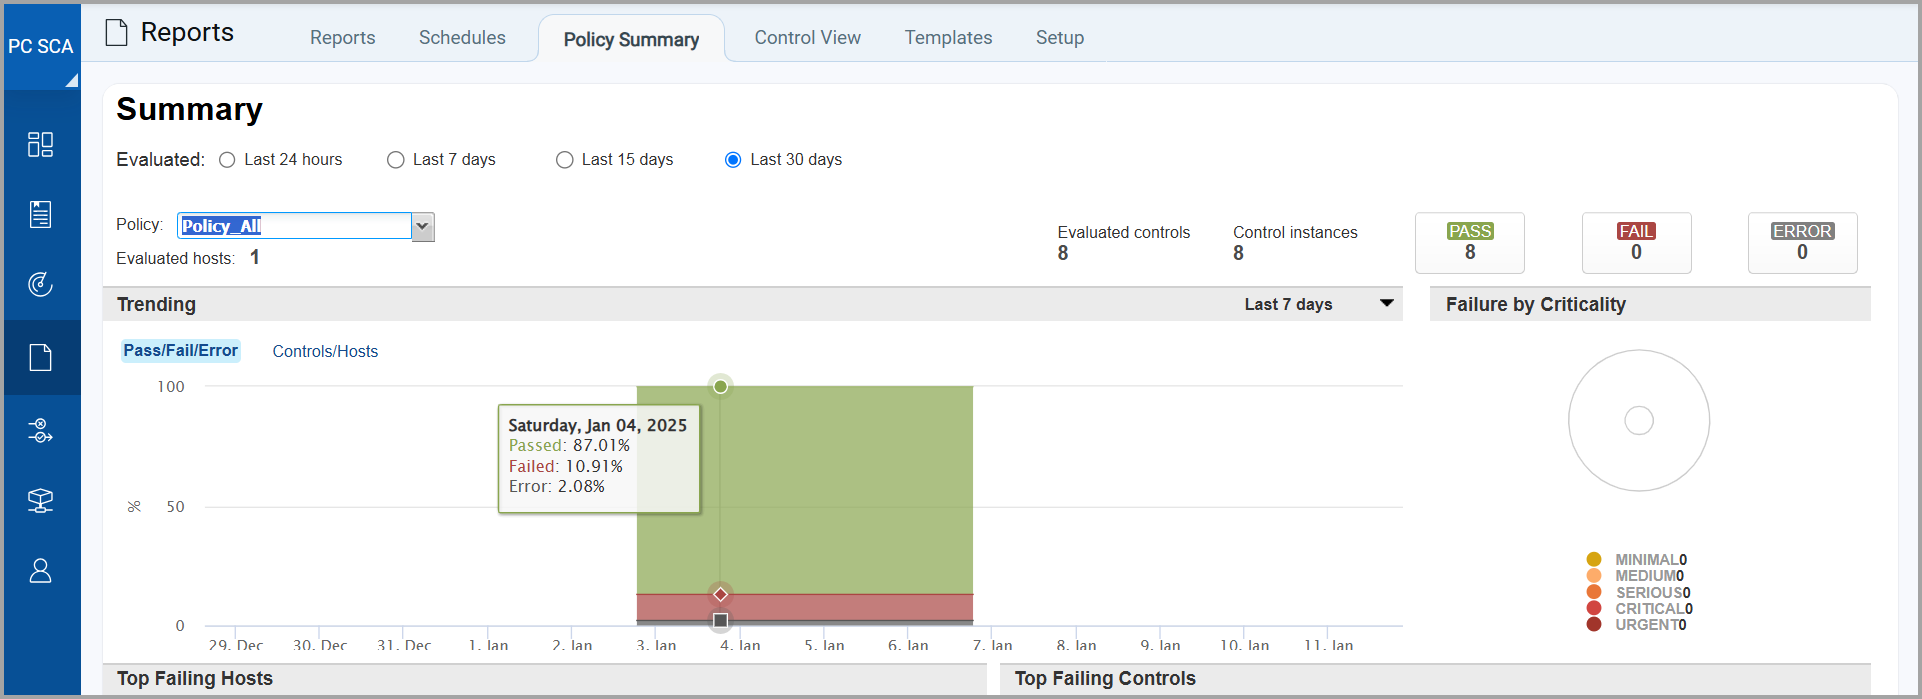
If you have not evaluated any controls for the selected policy in the timeframe selected, then the Policy Summary will show 0 counts for the number of evaluated hosts, evaluated controls, control instances, number of controls with Pass/Fail/Error, and there won’t be any top failing hosts or top failing controls listed. See the example below.
As mentioned, the Evaluated timeframe filter is not applied to the Trending graph. This graph will show data as long as controls were evaluated at some point and may include data from more than 30 days ago. Note that the Trending graph has its own timeframe selection (from last 7 days to last 90 days).
|
Your Policy Summary |
|
Why aren't all of my compliance policies listed?Why aren't all of my compliance policies listed? A policy is listed only if it has compliance evaluation data, meaning that at least one control in the policy has been evaluated on a host in the policy. |
|
For the Trending graph (Pass/Fail/Error or Controls/Hosts), select the number of days (Last 7 days to Last 90 days) to include in the graph from the drop-down menu above the graph. Your selection applies only to the Trending graph. Tip - The Trending graph may show aggregate data when a longer timeframe is selected. |
|
Pass/Fail/Error trend graphPass/Fail/Error trend graph This shows the percentage of control instances with a Passed status, the percentage of control instances with a Failed status and the percentage of control instances with Error status over the trend duration period. Place your mouse cursor over any area of the graph to see details for a particular day. |
|
Controls/Hosts trend graphControls/Hosts trend graph This shows the number of controls and the number of active hosts in the policy over the trend duration period. A host is considered active when at least one control in the policy was evaluated on the host, resulting in a Passed or Failed status. Note that this graph shows the actual number of controls in the policy, not the number of control instances. |
|
Failure by Criticality pie chartFailure by Criticality pie chart This shows the total number of failed control instances at each criticality level. |
|
What are the top failing hosts?What are the top failing hosts? These hosts have the highest percentage of controls that failed when evaluated for the host. Select the IP address for any host to run the Individual Host Compliance report. |
|
What are the top failing controls?What are the top failing controls? These controls have the highest percentage of Failed status when evaluated for hosts in the policy. Select the title for any control to run the Control Pass/Fail report. |
|
Tell me about policy statisticsTell me about policy statistics This graph shows the total number of control instances with a Passed status, the total number of control instances with a Failed status and the total number of control instances with a Error status. Place your mouse cursor over the green area to see the number of Passed control instances, over the red area to see the number of Failed control instances and over the black area to see the number of Error control instances. |
You can quickly run interactive reports from the Policy Summary. Click any host to run the Individual Host Compliance report. Click any control to run the Control Pass/Fail report.