Check Scanner Appliance Capacity
By checking the capacity of your scanner appliance, you can understand its usage pattern and determine whether it is currently available for scanning.
How do I see the available capacity for an appliance?
Go to Scans > Appliances. Click the row for the scanner appliance you are interested in and review the preview pane. The preview pane shows the Available Capacity for the appliance, expressed as a percentage. For example, Available Capacity: 100% means the appliance is not in use, and 100% of its capacity is currently available.
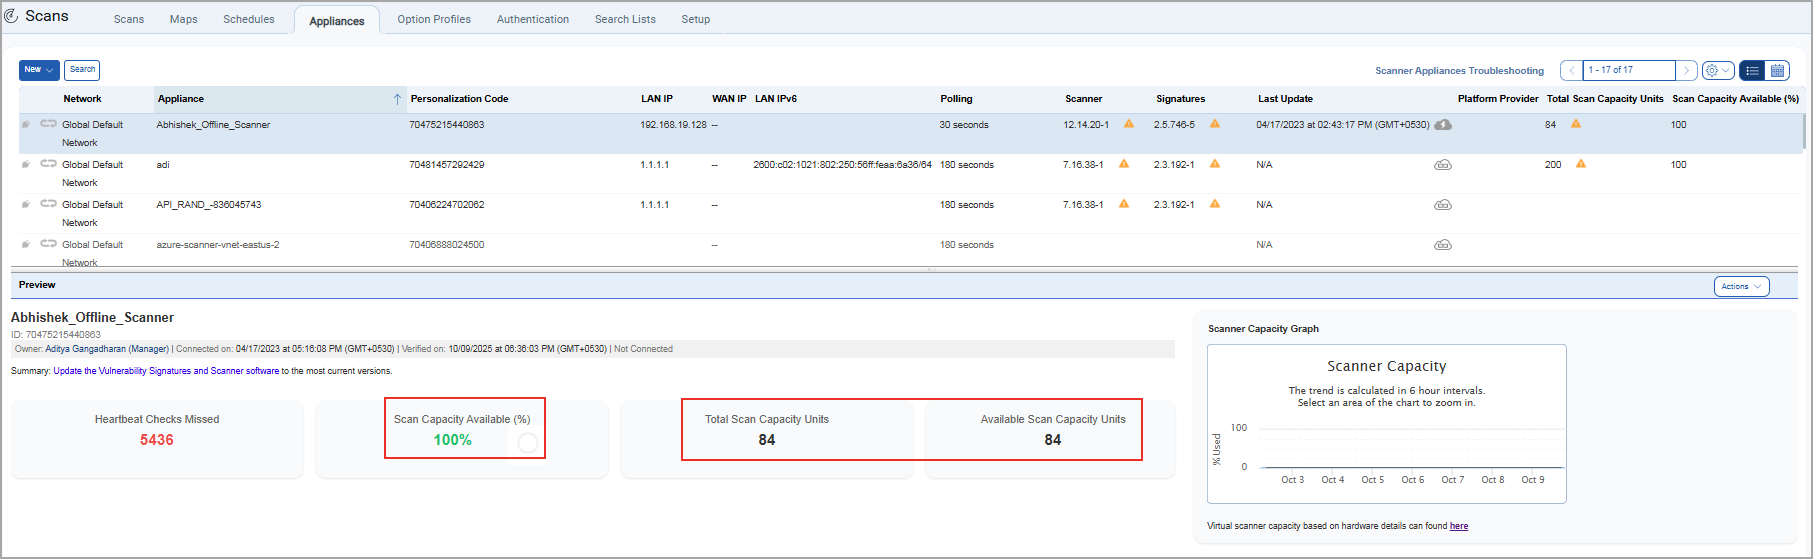
 This icon displayed next to the units mentioned under the Total Scan Capacity Units column indicates that the total capacity units are below 240. For more information, refer to Sizing your Scanners for Optimal Performance.
How do I see the Average Available Scan Capacity (%) column for an appliance?
Go to Scans > Setup > Scanner Capacity Percentage and enable the checkbox (Display Scanner Capacity Percentage column in the Scanner Appliance tab) and click Save.
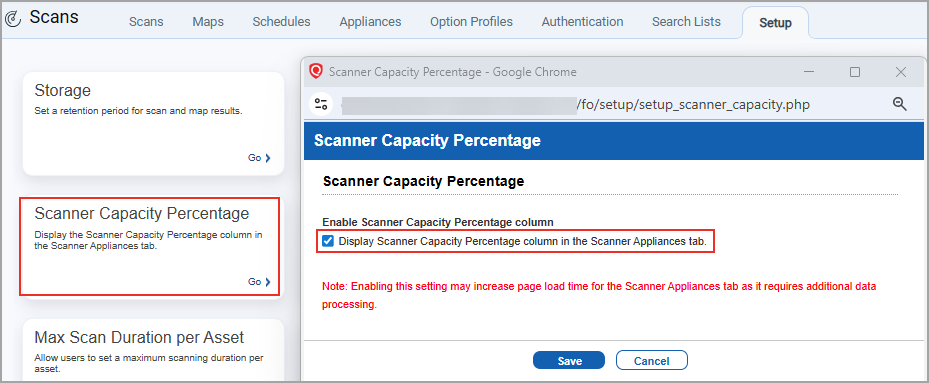
This checkbox is disabled by default. Only Managers and Primary Contact (POC) can enable the scanner capacity percentage column. Once enabled, Avg. Available Scan Capacity (%) column becomes visible to all users within the subscription.
How do I see how much capacity the appliance typically uses?
Go to Scans > Appliances. Click the row for the scanner appliance you are interested in and review the preview pane. The preview pane displays the Scanner Capacity Graph, which helps you select an appropriate scanner to launch scans.
You can view:
- Average available scan capacity as a percentage for the last 7 days under Avg. Available Scan Capacity(%) column in the scanner appliances listing page. This is visible only when the user with the Manager user enables the checkbox (Scans > Setup > Scanner Capacity Percentage).
- Scan Capacity Available (%) in the preview pane to display the current available scan capacity of the selected scanner appliance.
The graph shows the capacity of the appliance for the last 7 days, calculated every 15 minutes. Place your cursor over any point on the chart to see the used capacity at that moment, expressed as a percentage.
For example, Used Capacity: 27% indicates that 27% of the scanner appliance's total capacity is used, and 73% is available at that time. You can view the calculation date and time.
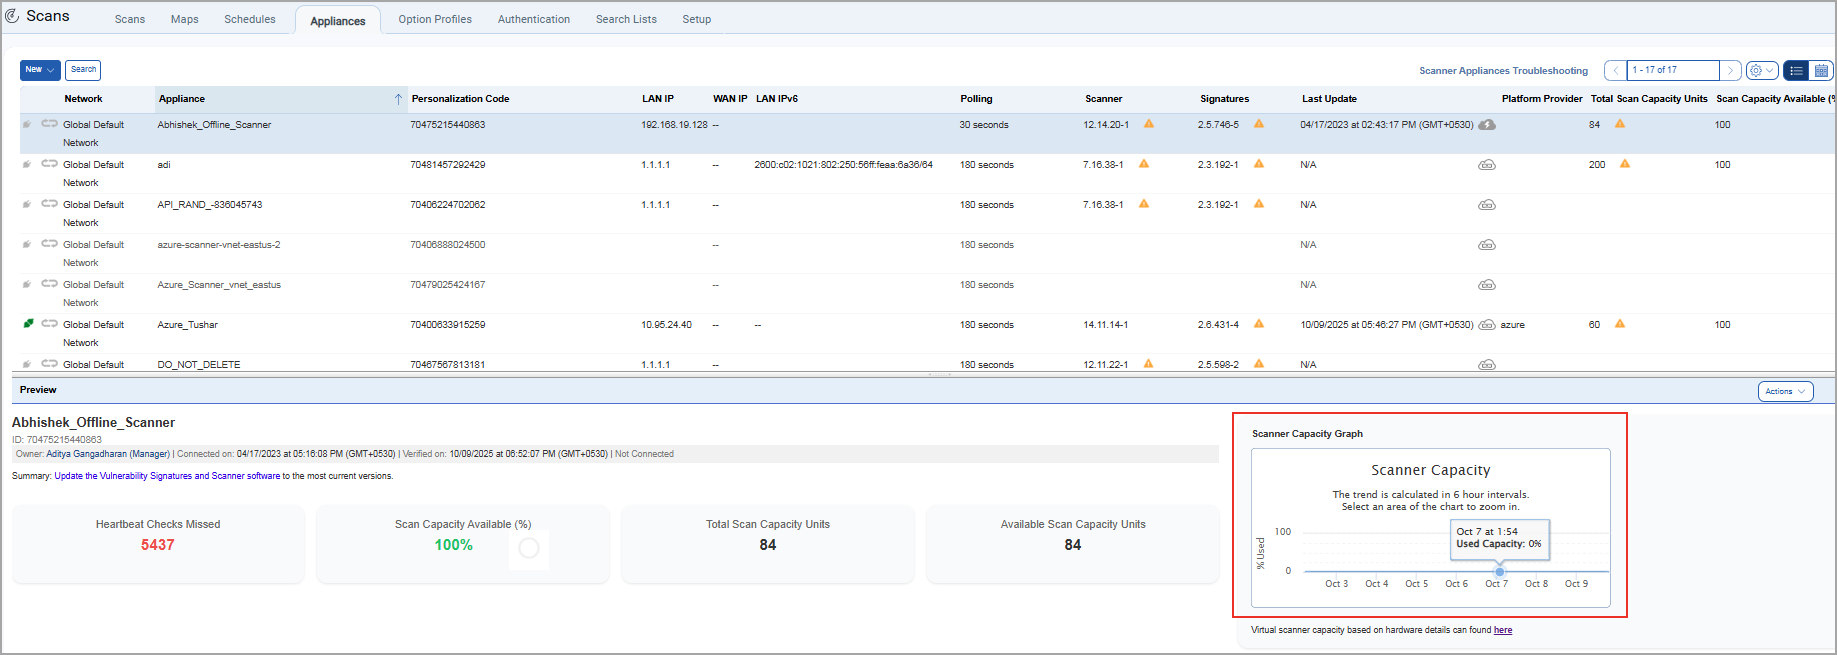
Tell me about the capacity trend calculation
A trend line shows the capacity trend, calculated every 6 hours. Every 6 hours, the service takes an average of the used capacity and shows this in the middle of a 6 hour window. For example, for the period 3 pm to 9 pm, the average is displayed at 6 pm. Average over 6 hours: 10% means the average of the used capacity was 10% and 90% of its capacity was available over the 6 hour window.
Don't see capacity information?
New Scanner Services must be enabled for the subscription to see scanner appliance capacity information. Go to Help > Account Info > General Information to see whether your subscription has this configured.