Policy Audit Release 1.11
May 11, 2026 (Updated on June 9, 2026)
View TruRisk™ Score in Policy Reports in CSV Format
With this release, you can enable the TruRisk™ score in Policy report templates and view it in Policy reports generated in CSV format. You can enable the TruRisk™ score feature for report templates that use the following Group By options:
- Host
- Controls
- Control References
TruRisk™ score can be enabled for both new and existing Policy report templates.
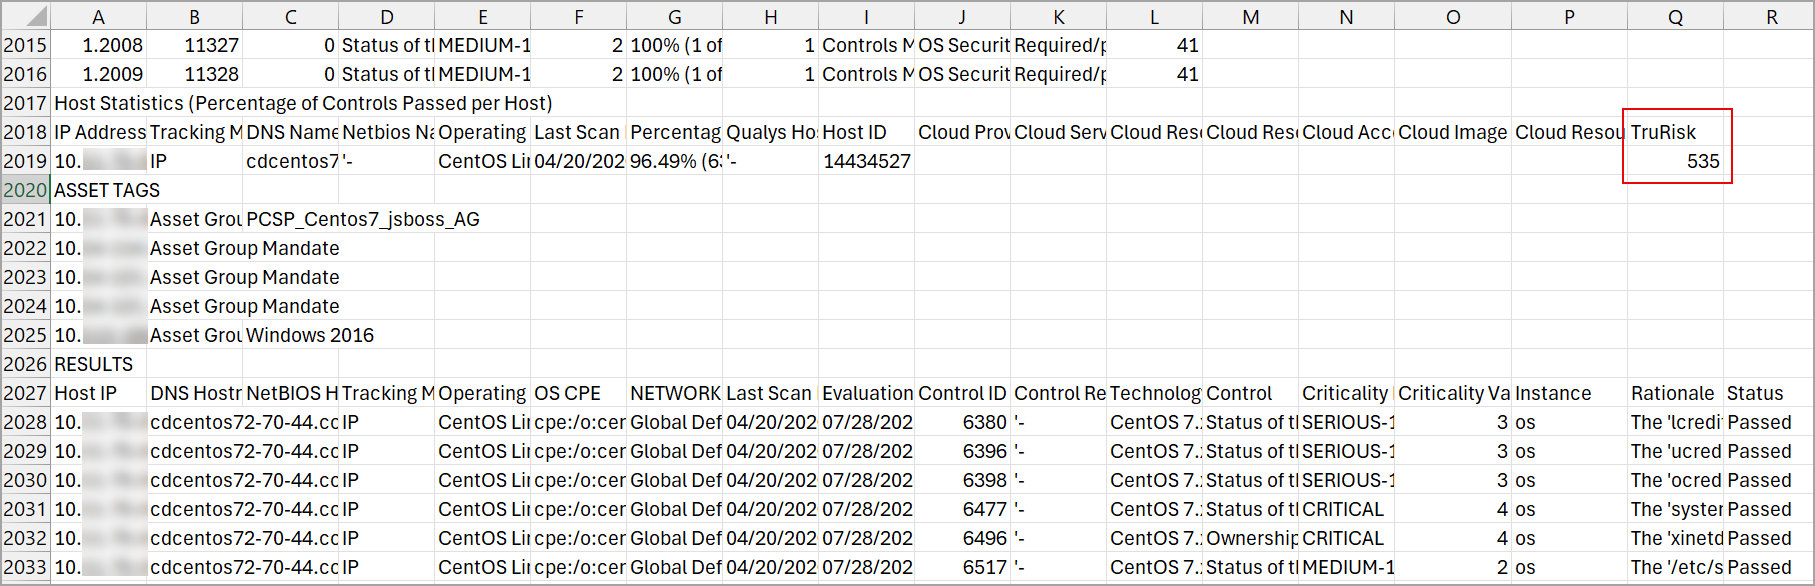
Once enabled, when you generate the Policy report in CSV format, under the Host Statistics section, the TruRisk column is included, displaying the TruRisk™ score for the assets.
To enable this feature for your subscription, contact your Technical Account Manager (TAM) or Qualys Support.
To enable TruRisk™ score for a policy template, navigate to:
- Reports > Templates > New > Policy Template.
The New Compliance Policy Report Template window is displayed. - In the Layout tab, under Report Layout > in Group By, select from Hosts, Controls, or Control References.
- Under Sections > Score > select TruRisk for CSV Reports Only.
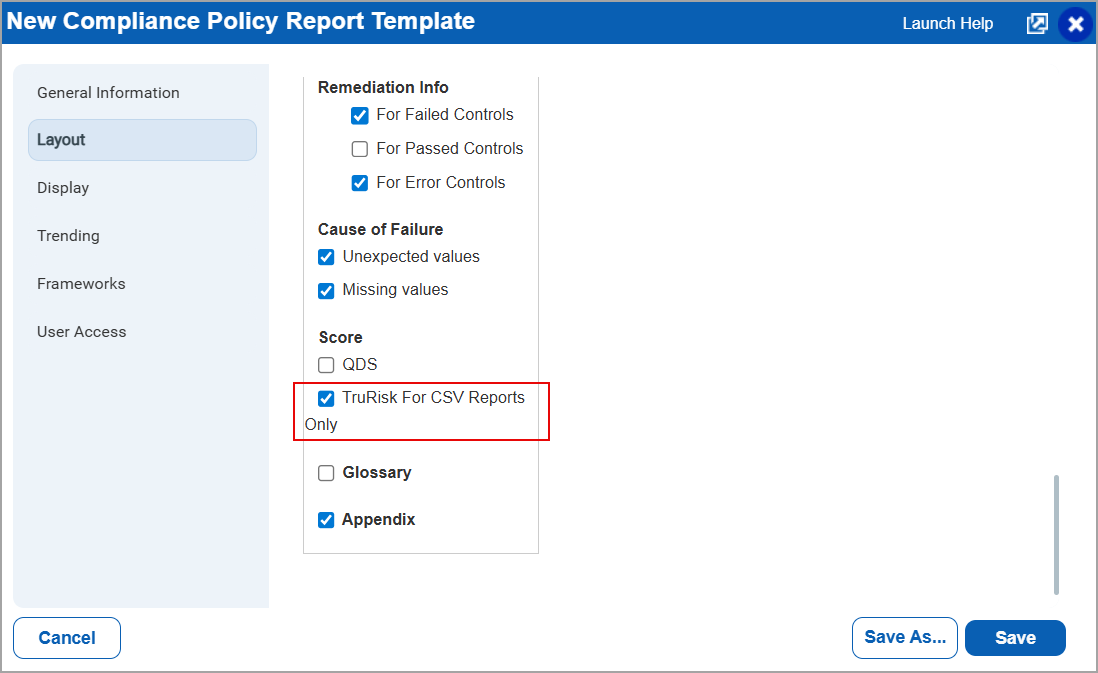
Once the option is selected and a policy report is generated using the template, the TruRisk column is displayed in the CSV format reports.
Support for Active Directory VMware NSX Authentication
You can now use Active Directory (AD) support with HashiCorp Vault when you create, update, list, and delete VMware NSX authentication records for authenticated scans of VMware NSX environments. This enables you to securely retrieve AD credentials from Vault. With this enhancement, you can:
- Connect directly to the target asset using AD credentials.
- Fetch credentials dynamically from the specified Vault path.
You can find this option when you navigate to:
- Scans > Authentication > New > Hypervisors & Virtualization > NSX.
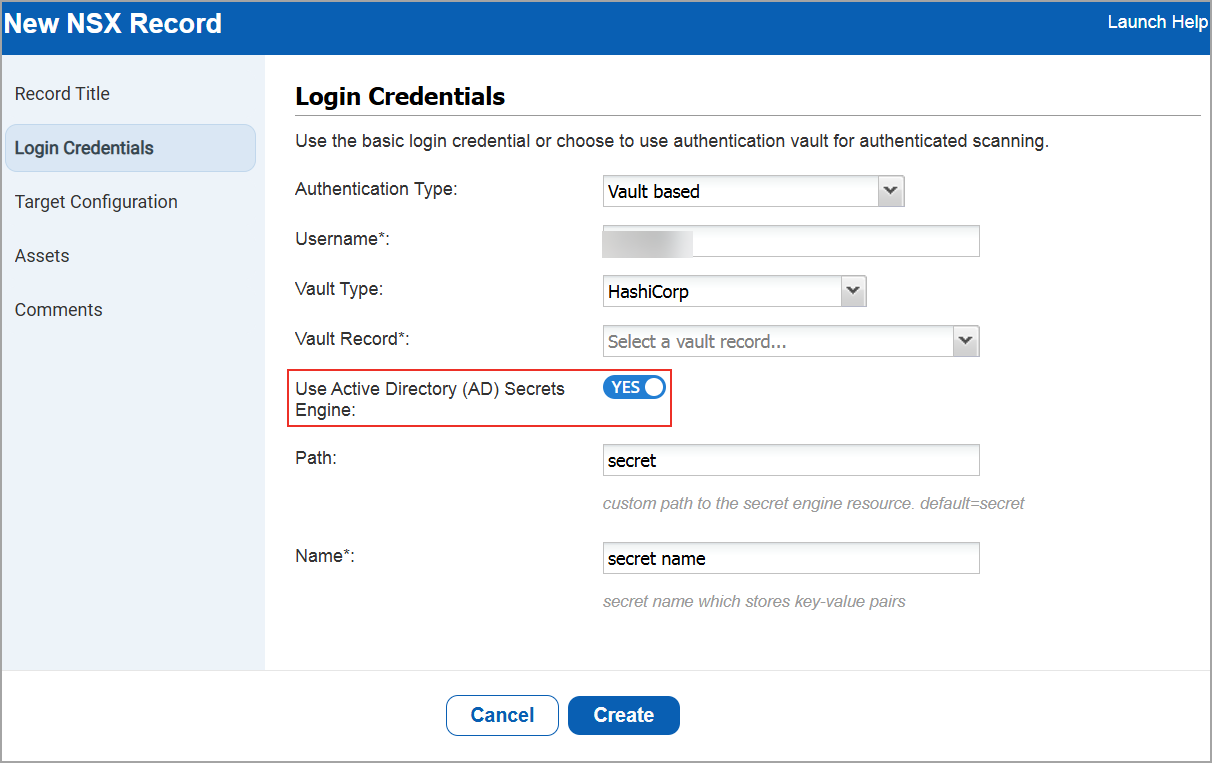
The New NSX Record window is displayed. - Go to Login Credentials > Select the Authentication Type as Vault based > Vault Type as Hashicorp.
Qualys API Support
For this enhancement, we have updated the Authentication API: /api/3.0/fo/auth/nsx.
For more information, refer to Policy Audit Release 1.11 API Release Notes.
Support for GCP Instance-Based Scans for IPv4
With this release, Cloud Internal Scan support is available for Google Cloud Platform (GCP).
This enhancement allows you to perform authenticated scans on private IP addresses of GCP cloud instances and provides deeper visibility into internal assets, along with improved overall security coverage. The scan is automatically initiated once the GCP connector is configured.
Previously, GCP supported only perimeter scans, while AWS EC2 and Azure supported both internal and perimeter scans.
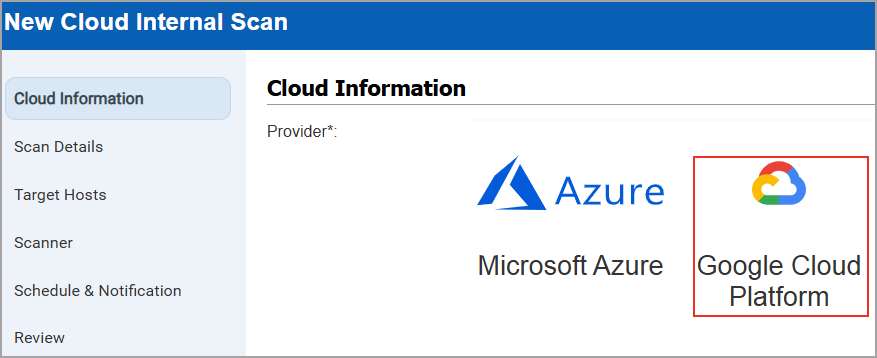
With this update, GCP now supports instance‑based internal scans and remains consistent with other major cloud providers. You can configure GCP Cloud Internal Scans by navigating to Scans > New > Cloud Internal Scan > Cloud Information > GCP. You can create or update GCP Cloud Internal Scans.
You can also apply a filter to view GCP scans on the scan list page, along with AWS EC2 and Azure (Scans > Filters > Cloud Internal Scan).
- GCP Internal Scan cannot be performed by SCA only subscriptions.
- GCP Internal Scan can be launched by Manager, Unit Manager, or Scanner roles.
- GCP Internal Scan does not support private DNS names or GCP metadata.
- Scanners must have network reachability to all VPCs and subnets included in the scan.
- GCP connector is required to launch instance-based scans.
Qualys API Support
For this enhancement, we have updated the Cloud Internal Scan API: /api/3.0/fo/scan/cloud/internal/job/.
For more information, refer to Policy Audit Release 1.11 API Release Notes.
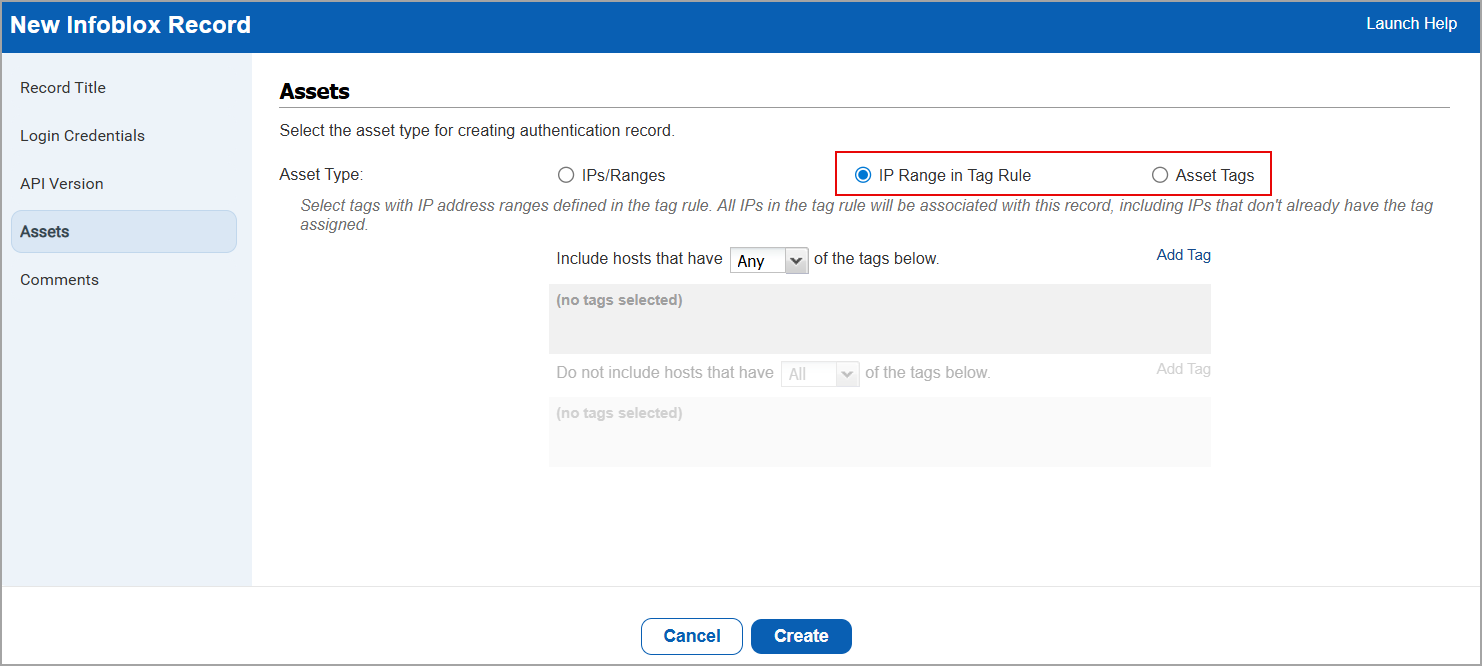
Support for Tag Rule and Asset Tag for Authentication Technologies
With this release, we have added support for adding IP Range in Tag Rule and Asset Tags for the following authentication technologies:
- Network and Security
- Infoblox
- Applications
- Apache Web Server
- BIND
- Docker
- IBM WebSphere App Server
- Kubernetes
- MS Exchange Server
- MS IIS
- MS SharePoint
- NGINX
- Oracle HTTP Server
- Databases
- Azure MS SQL
- InformixDB
- MS SQL
- Neo4j
- Pivotal Greenplum
- PostgreSQL
- SAP HANA
- SAP IQ
- Hypervisors and Virtualization
- OLVM
Previously, this support was limited to the Operating Systems authentication technologies, Unix and Windows.
To create a new authentication record with tag based support, navigate to:
Scans > Authentication > New > Select the type of authentication record > Assets.
To enable this feature for your subscription, contact your Technical Account Manager (TAM) or Qualys Support.
Download Compliance Controls for an Asset
With this release, we have added a new download icon that allows you to download the list of all compliance controls associated to an asset.
To download the compliance control, navigate to:
Posture > Assets > Select an asset from the list > Quick Actions > View Asset Details > Policy Audit > View Controls.
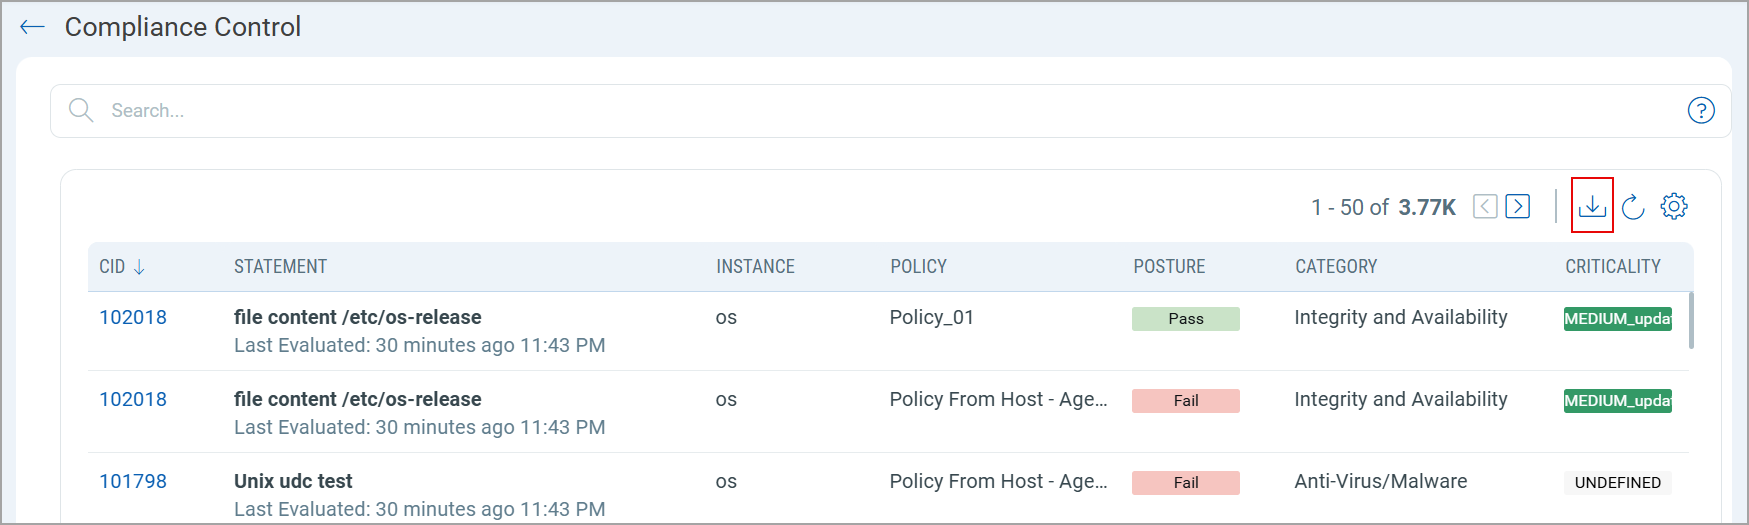
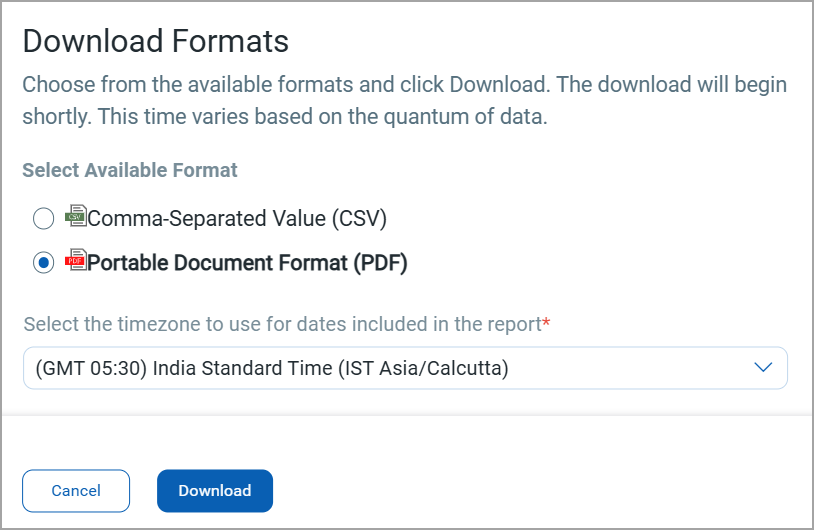
You can download the compliance controls in either CSV or PDF formats.
Navigate from Dashboard PA Widget to Posture Tab
With this release, you can now navigate directly from the Dashboard Policy Audit (PA) widget (for Controls and Assets) to the Posture tab. This enhancement enables you to access Posture details (for controls and assets) directly from the Dashboards tab.
Previously, to access control or asset details, you were to manually navigate to the Posture tab, re-enter the same QQL query shown in the widget, and then view the results.
With this enhancement, you can directly select an entry in the control or asset dashboard widget and be redirected to the Posture tab with the relevant details displayed.
This navigation correctly identifies the widgets data source and displays the correct tab (Controls or Assets):
- Control-based widgets open the Controls data list view in the Posture tab.
- Asset-based widgets open the Assets data list view in the Posture tab.
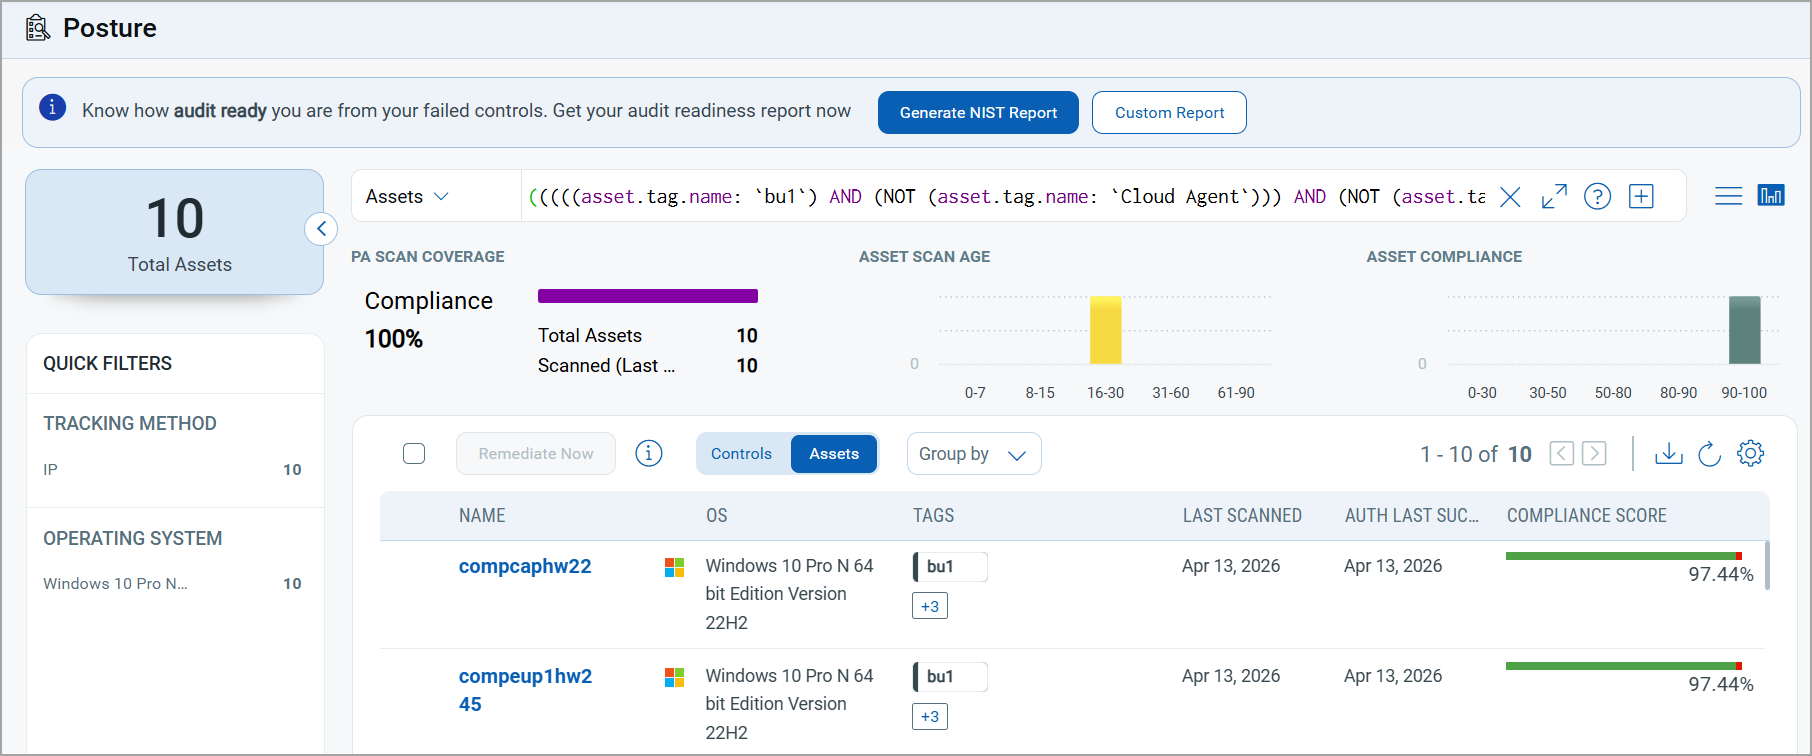
For example, in the widget shown below, there are a total of 10 assets with a Compliance score of 97.44%.
In the Count column, select 10.
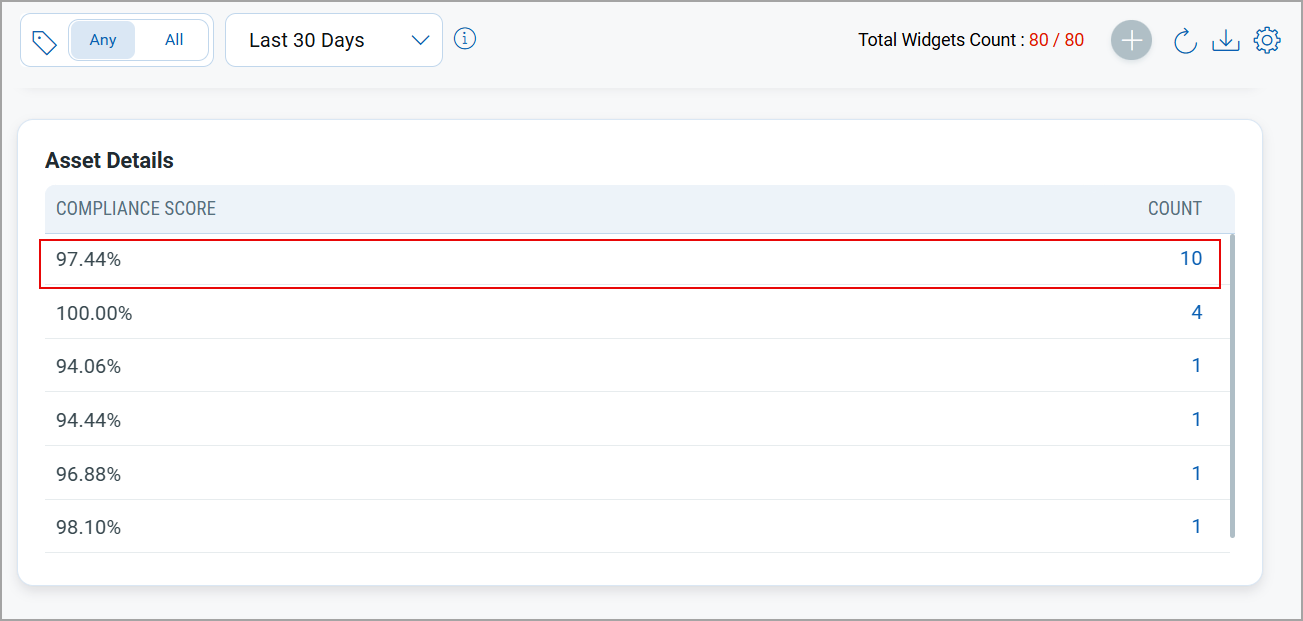
You are redirected to the Posture tab with the Assets tab selected (where asset query is a data source), and all assets with a compliance score of 97.44% are displayed.
Support for Sorting of Table Widget
With this release, you can now sort table widgets in ascending or descending order based on selected columns. Previously, table widgets did not support sorting, limiting your ability to organize data effectively.
You can sort the table widget by one column at a time.
Support for New Authentication Technologies
With this release, we have added support for the following new technologies:
ArubaOS 10.x
ArubaOS 10.x technology is now supported for Policy Audit authenticated scans using scanners. This technology is now available for use at the following places:
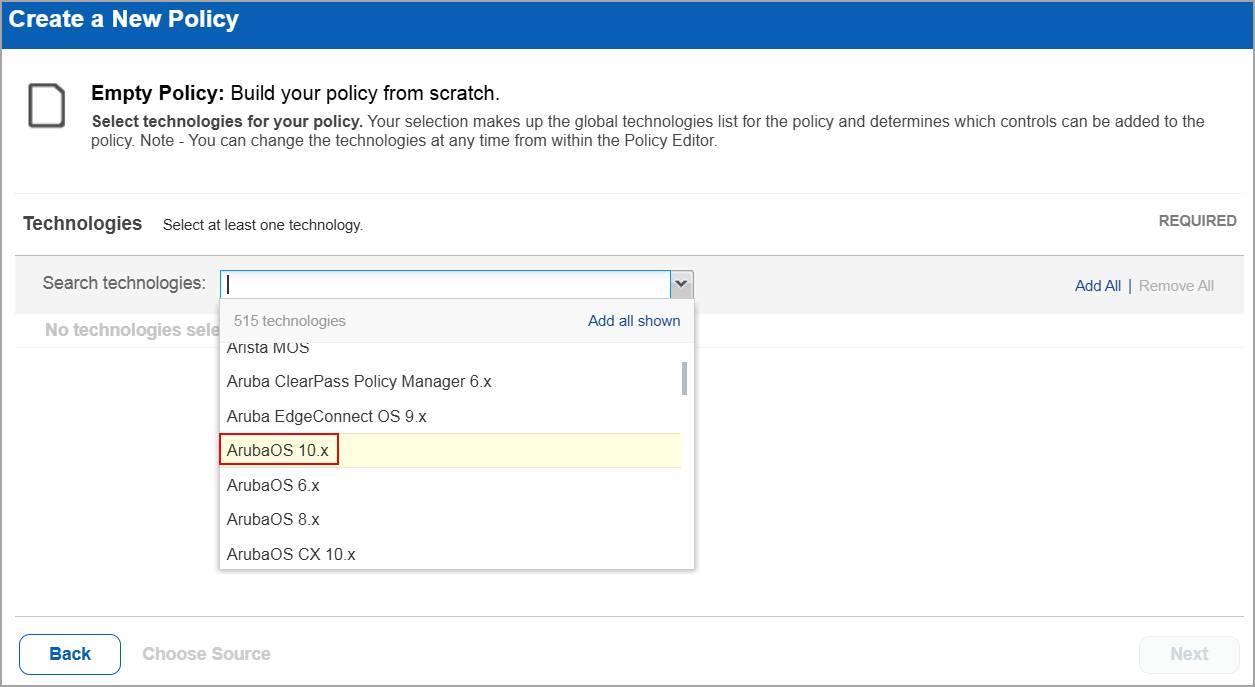
Policy Editor
When you create or edit a policy compliance, ArubaOS 10.x is displayed in the list of supported technologies.
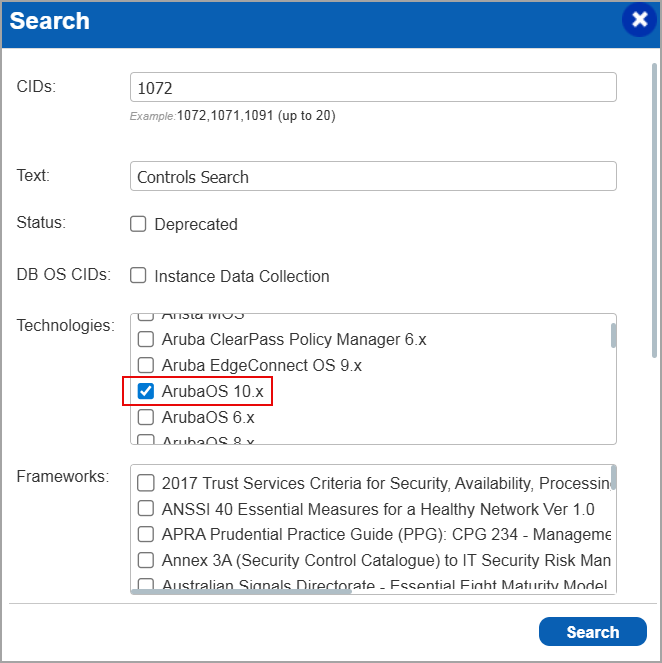
Search Controls
When you search for controls, you see ArubaOS 10.x in the list of technologies. Go to Policies > Controls > Search and under Technologies, select ArubaOS 10.x in the list.
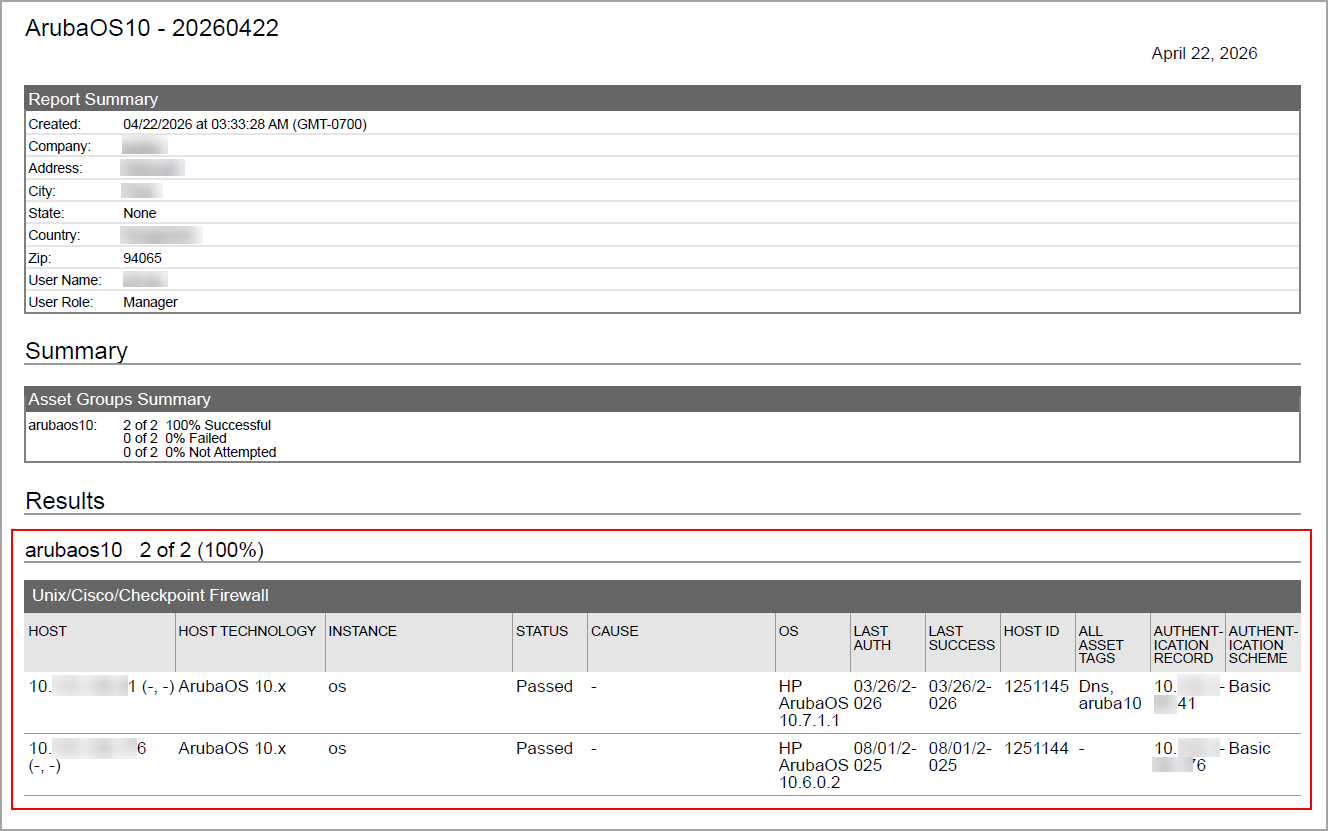
Authentication Report
You can view the ArubaOS 10.x in the authentication report. In the Results section of the report, the ArubaOS 10.x details are displayed.
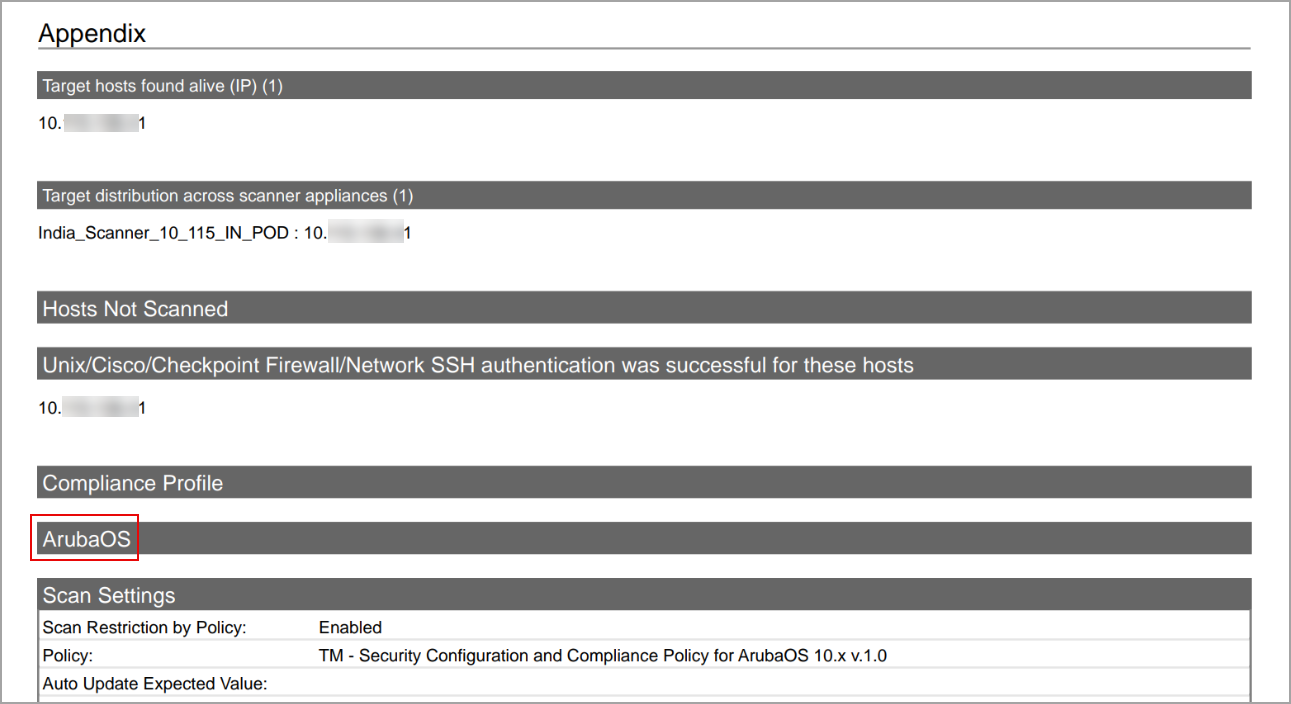
Scan Results
ArubaOS 10.x is now listed under Application technologies found based on OS-level authentication in the Appendix section of a compliance scan result.
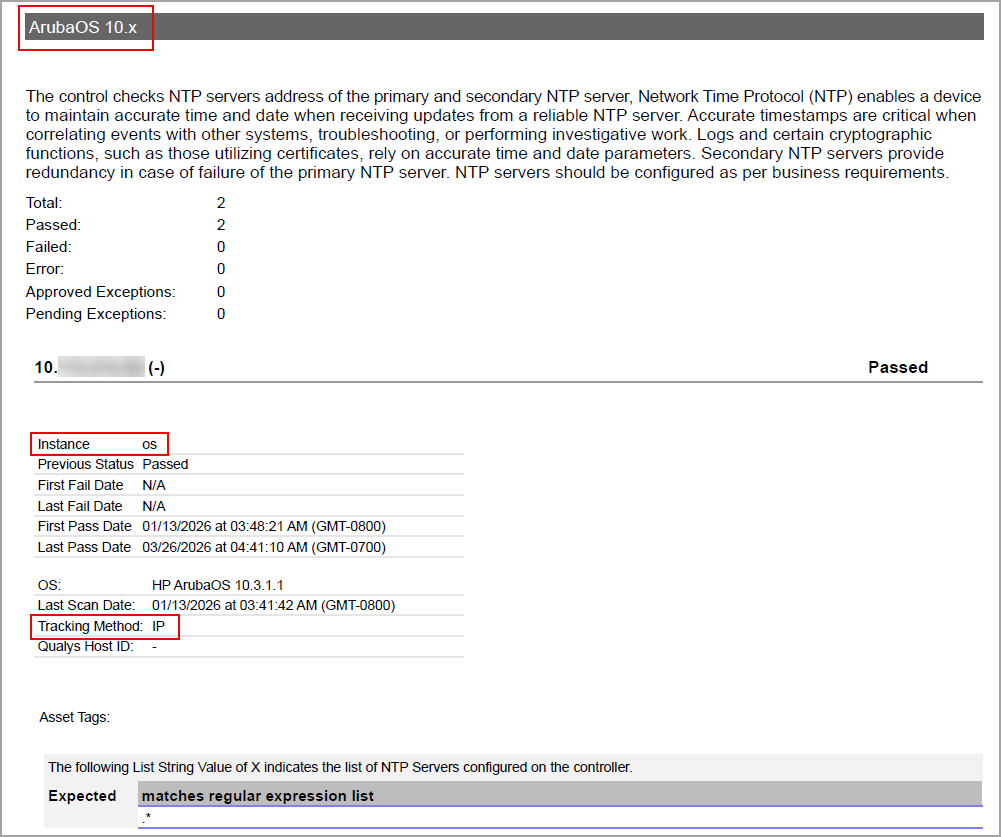
Sample Report
In sample compliance reports, you can view the instances of ArubaOS 10.x for scanned hosts. The sample report displays the scanners tracking method as IP for ArubaOS 10.x.
Google Chrome (macOS)
Google Chrome (macOS) technology is now supported for Policy Audit authenticated scans using agent and scanners. This technology is now available for use at the following places:
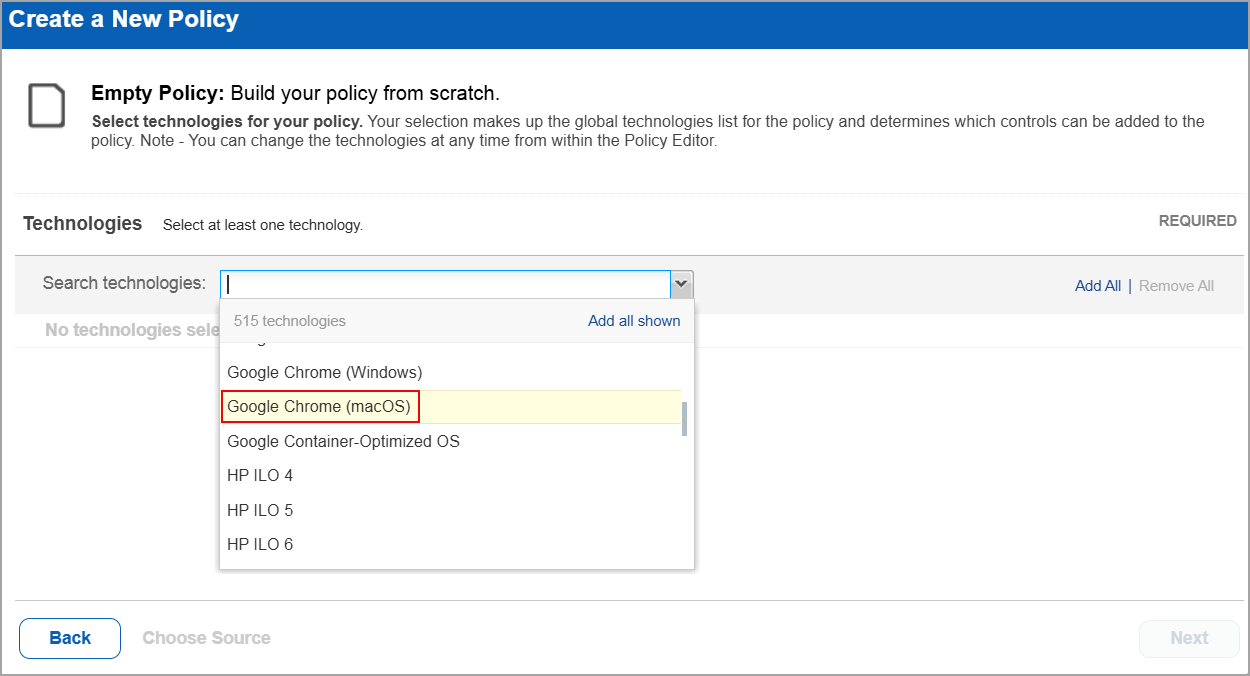
Policy Editor
When you create or edit a policy compliance, Google Chrome (macOS) is now available in the list of supported technologies.
Search Controls
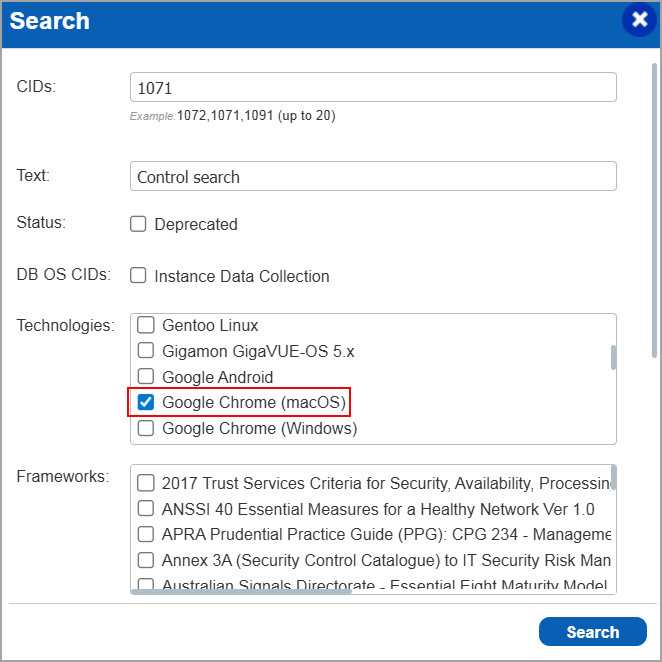
When you search for controls, you see Google Chrome (macOS) in the list of technologies. Go to Policies > Controls > Search and under Technologies, select Google Chrome (macOS) in the list.
Authentication Report
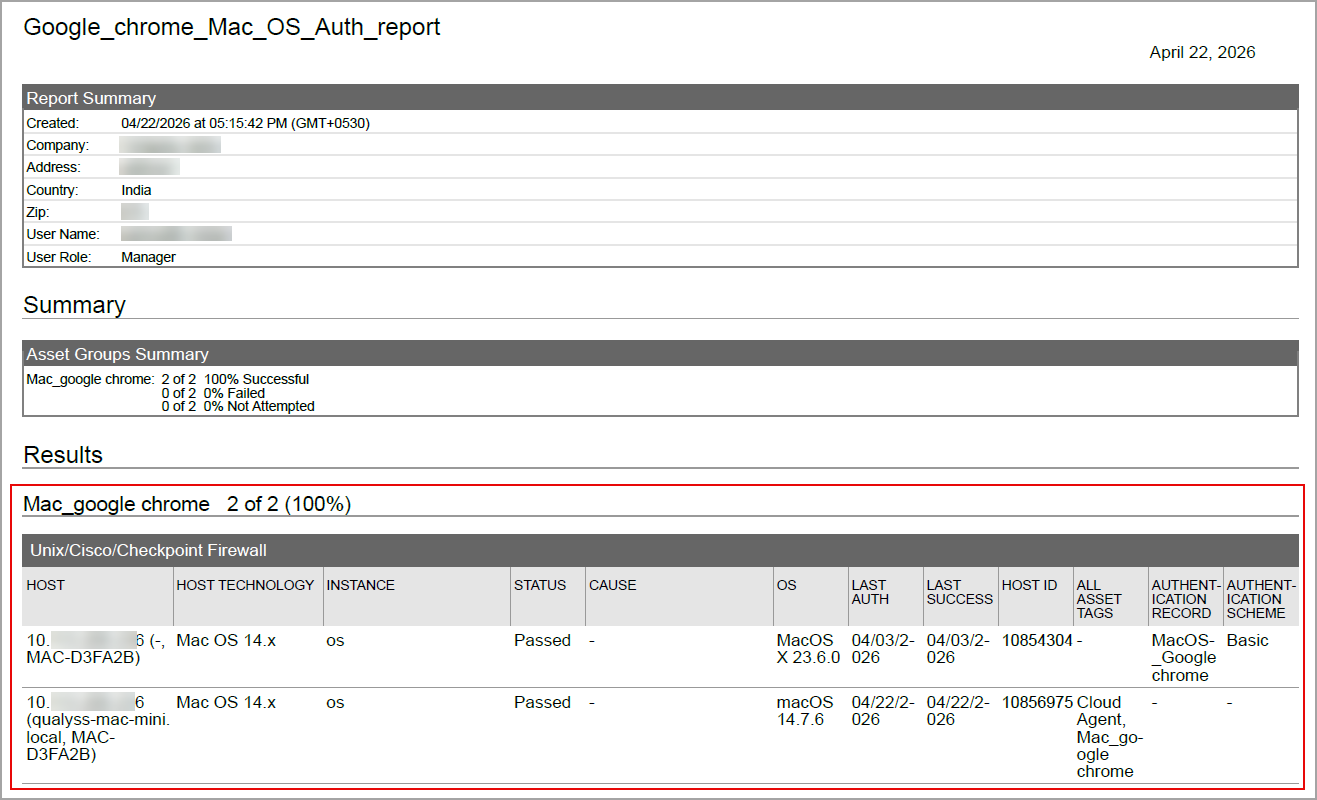
You can view Google Chrome (macOS) in the authentication report. In the Results section of the report, the Google Chrome (macOS) details are displayed.
Scan Results
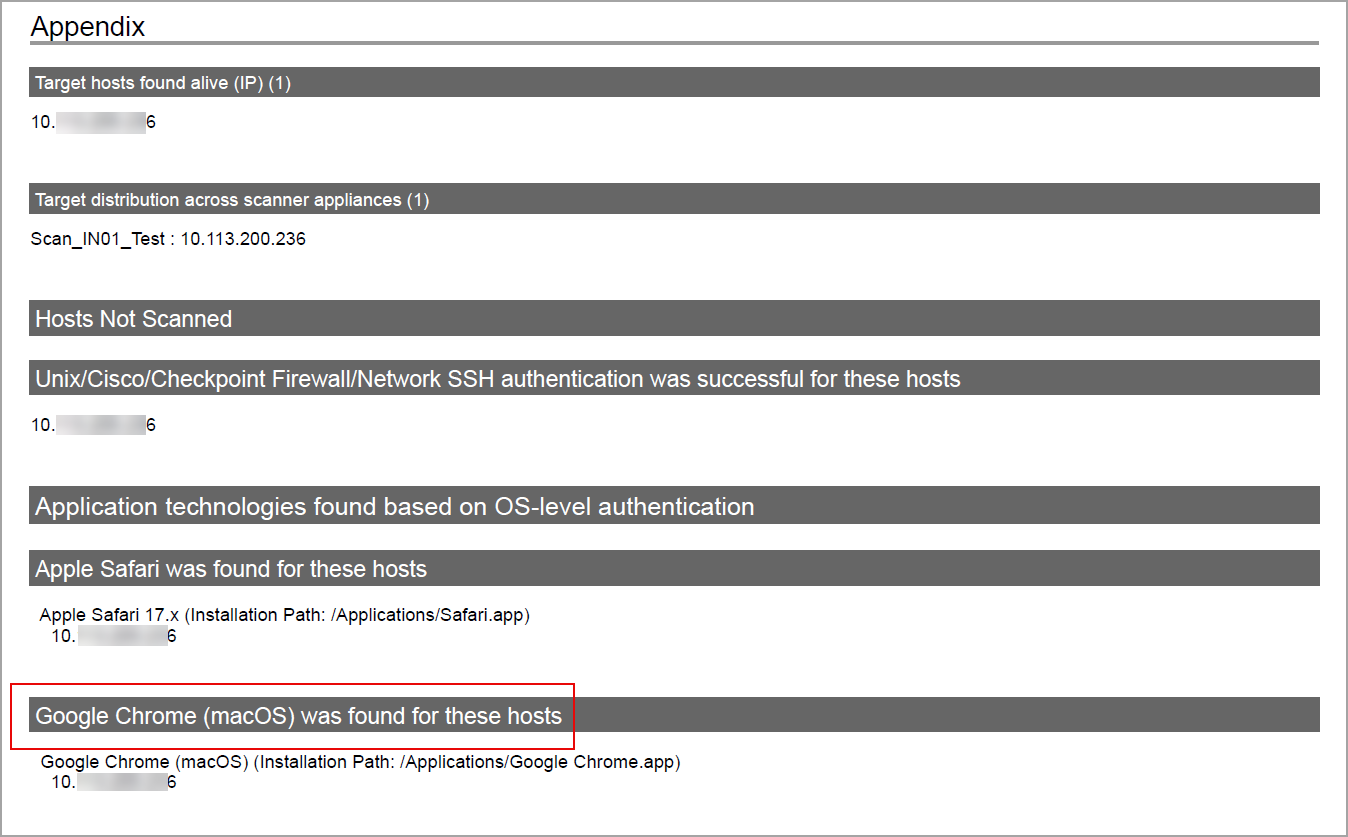
Google Chrome (macOS) is now listed under Application technologies found based on OS-level authentication in the Appendix section of a compliance scan result.
Sample Report
The sample report displays the tracking method and the instances for the scanner and the agent.
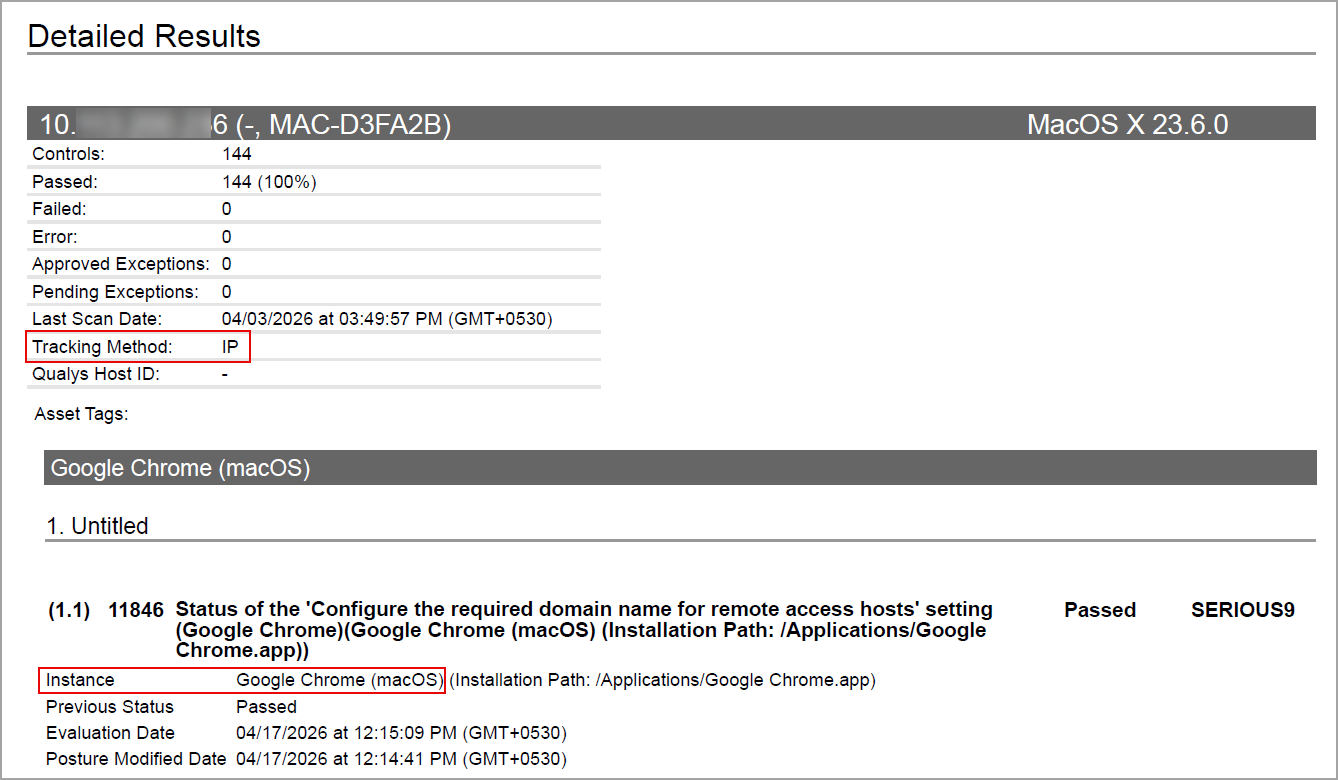
- Scanner
In Compliance Reports, you can view the instances of Google Chrome (macOS) for scanned hosts. The sample report displays the scanner's tracking method as IP with an instance of Google Chrome (macOS).
- Agent
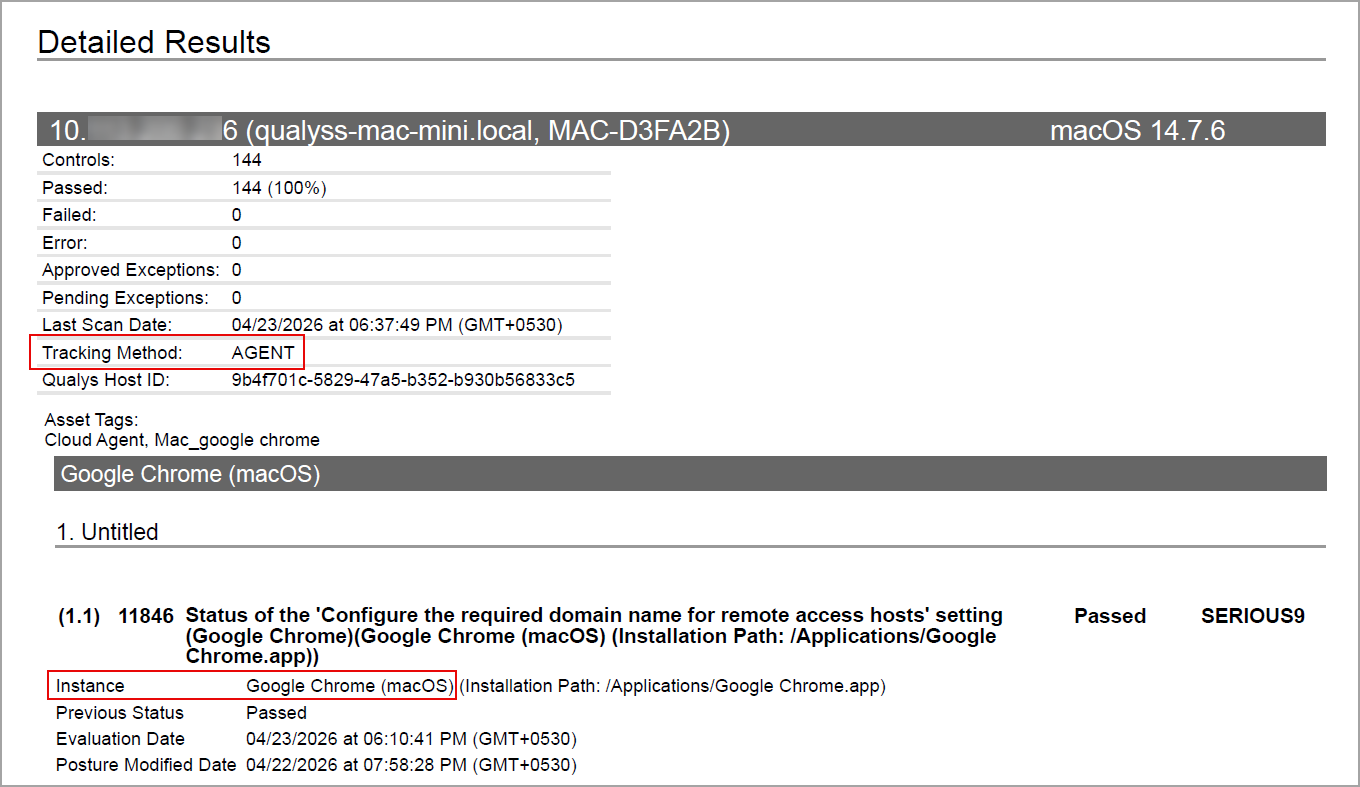
In Compliance Reports, you can view the instances of Google Chrome (macOS) for scanned hosts. The sample report displays the tracking method as AGENT with an instance of Google Chrome (macOS).
CrowdStrike Falcon Endpoint Protection
CrowdStrike Falcon Endpoint Protection technology is now supported for Policy Audit using Out-of-Band Configuration Assessment (OCA). This technology is now available for use at the following places:
Policy Editor
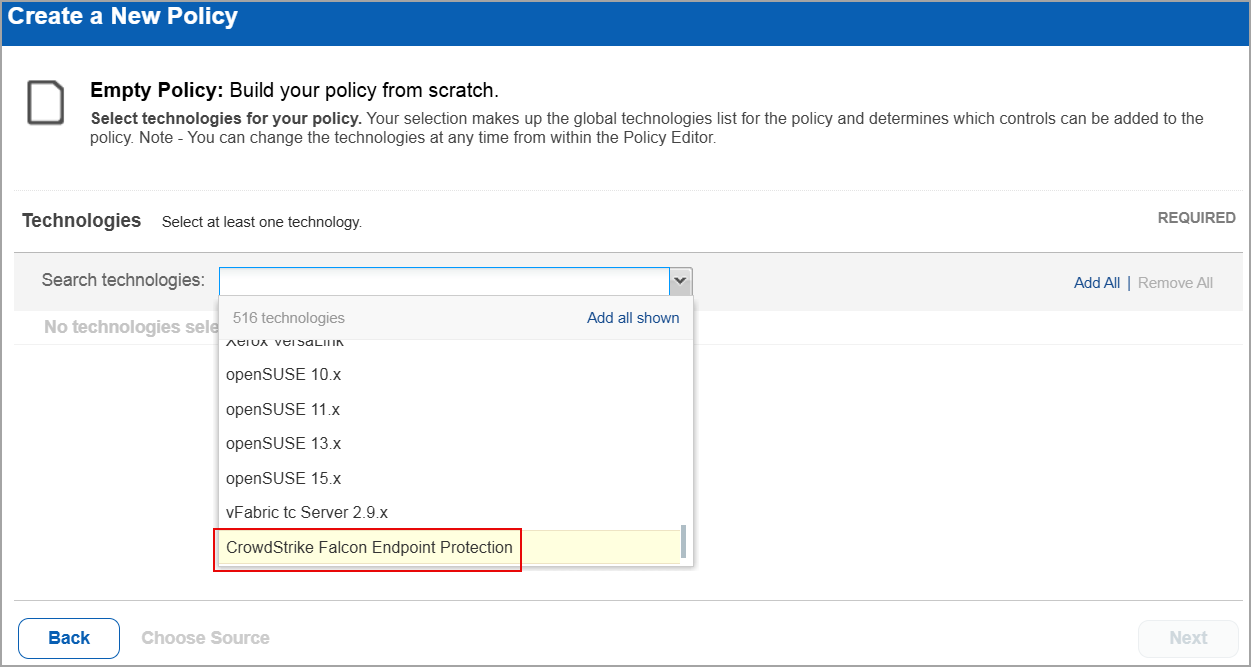
When you create or edit a policy, CrowdStrike Falcon Endpoint Protection is now available in the list of supported technologies.
Search Controls
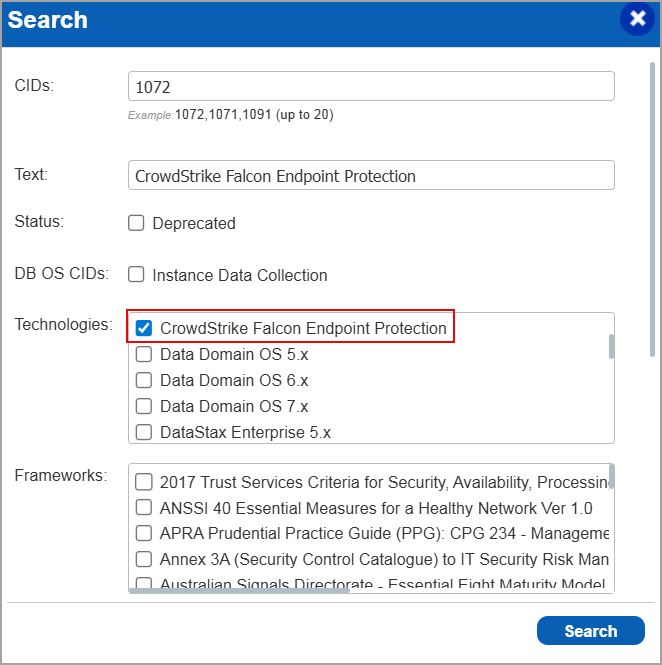
When you search for controls, you see CrowdStrike Falcon Endpoint Protection in the list of technologies. Go to Policies > Controls > Search and under Technologies, select CrowdStrike Falcon Endpoint Protection in the list.
Policy Report
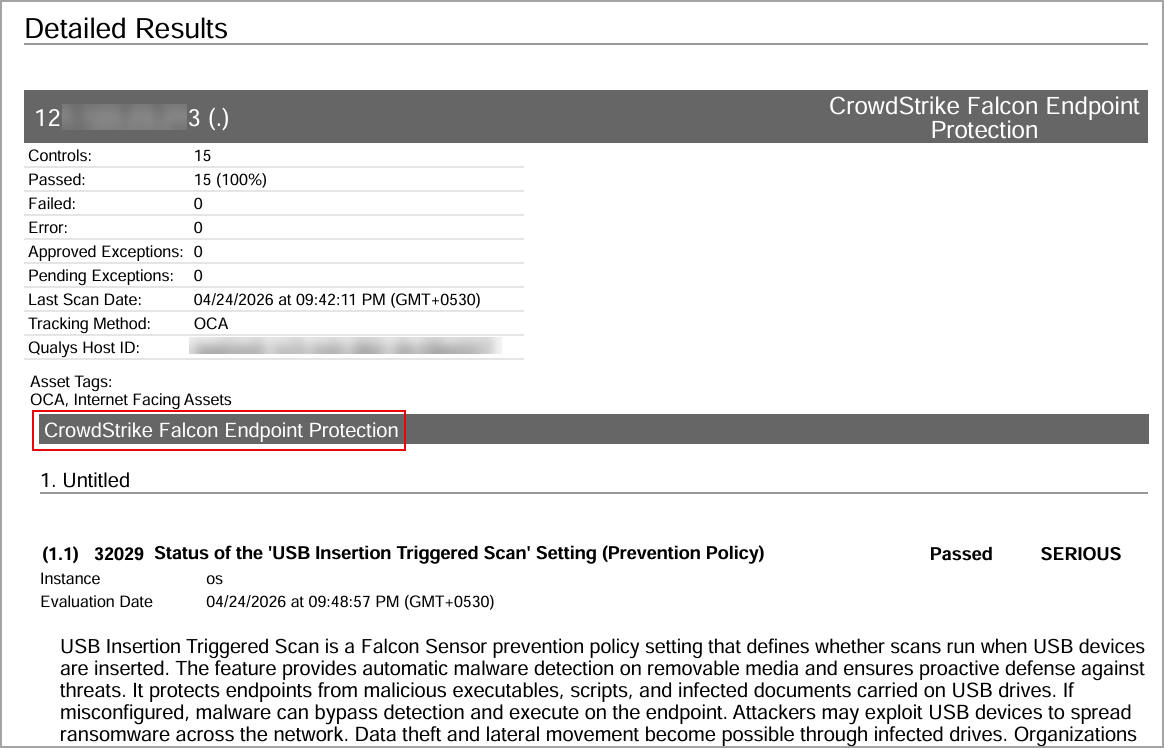
You can view the CrowdStrike Falcon Endpoint Protection in the policy report. In the Detailed Results section of the report, the CrowdStrike Falcon Endpoint Protection details are displayed.
Issues Addressed
The following reported and notable customer issues are fixed in this release:
| Component/Category | Description |
| PA - Reports | When the user updated a User Defined Control (UDC), existing host compliance posture data was incorrectly deleted during task processing, resulting in loss of historical compliance results and affecting reporting accuracy. Relevant code changes have been made to fix this issue. |
| PA - Reports | When the user edited a scheduled compliance scorecard report, they were unable to view any policies mapped to the report. However, the same generated scheduled report displayed multiple mapped policies. Relevant code changes have been made to fix the issue. |
| PA - New UI | When the user edited specific Network User Defined Controls (UDCs) in a policy, the window appeared blank. Relevant code changes have been made to resolve this issue. Users can now view network UDC details correctly and make the necessary edits. |
| PA - PCRS API | When the user retrieved posture data for policies through the Get Posture Info API (pcrs/4.0/posture/postureInfo), stale assets that were no longer associated with the policy were included in the results. This led to inaccurate reporting and outdated policy associations. Relevant code changes have been made to resolve this issue. |
| OCA - Config Upload | When the user performed a bulk upload of a configuration file associated with an asset, using the OCA application, the Last Accessed On date for that asset was displayed incorrectly. Relevant code changes have been made to resolve this issue. |
| PA - New UI | When the user viewed posture details on the Posture tab, the Evidence section under General Information, displayed no information. Relevant code changes have been made to fix this issue. |
| PA - New UI |
When the user selected Posture Criticality in the Group By option for a widget on the Dashboard tab, the pie chart representation was not displayed correctly. Relevant code changes have been made to fix this issue. |
| PA - New UI | When the user viewed the Top Failing Policies widget on the Dashboards tab, they observed that for some of the policies the audit score was missing. However, the score was correctly displayed for the same policies on the Posture tab. Relevant code changes have been made to fix this issue. |
| PA - New UI | When the user entered a Qualys Query Language (QQL) query on the Dashboards tab, they were redirected to the Posture tab and received the error - Invalid QQL specified. Please review QQL syntax. Additionally, extra query lines were automatically appended to the QQL after redirection. This issue has been resolved with the latest code changes. |
| PA - New UI | When the user viewed the Trends widget on the Dashboards tab, the graph displayed data only for the current day. For all historical entries in the graph, no data was displayed. Relevant code changes have been made to fix the issue. |
| PA - New UI | When the user selected the download icon to export the Posture details, they encountered the error - Failed to download the report. This error occurred because the number of Posture details exceeded the set limit of 10,000 entries. Relevant code changes have been made to fix the issue. |
| PA - New UI | When the user viewed posture details for Controls and Assets on the Posture tab, some redundant entries were displayed. Selecting these entries resulted in a 404 – Page not found error. Relevant code changes have been made to fix the issue. The redundant Posture entries are no longer displayed. |
| PA - PCRS Reports | When reports were either launched or scheduled to run at a specific time, they did not generate as expected. This occurred because the report expiration date was set similar to the creation date at the time of report creation. Relevant code changes have been made to fix the issue. Reports now retain their configured expiration date when created. This ensures that reports run as expected and remain available for the defined retention period. |