Process Integrity Monitoring in VMDR OT
Process Integrity Monitoring (PIM) enhances the security of Industrial Control Systems (ICS) by continuously monitoring your OT network for process-related events such as firmware downloads, configuration changes, PLC mode changes, and so on. This allows you to identify any deviations from the expected process behavior promptly. These events could be indicators of potential data breaches, system downtime, or other security incidents.
The Network Passive Sensors (NPS) deployed in your OT network continuously monitor and report any process-related events within your regular operations.
VMDR OT captures these events as Process Integrity events. These events are analyzed and categorized according to the operation.
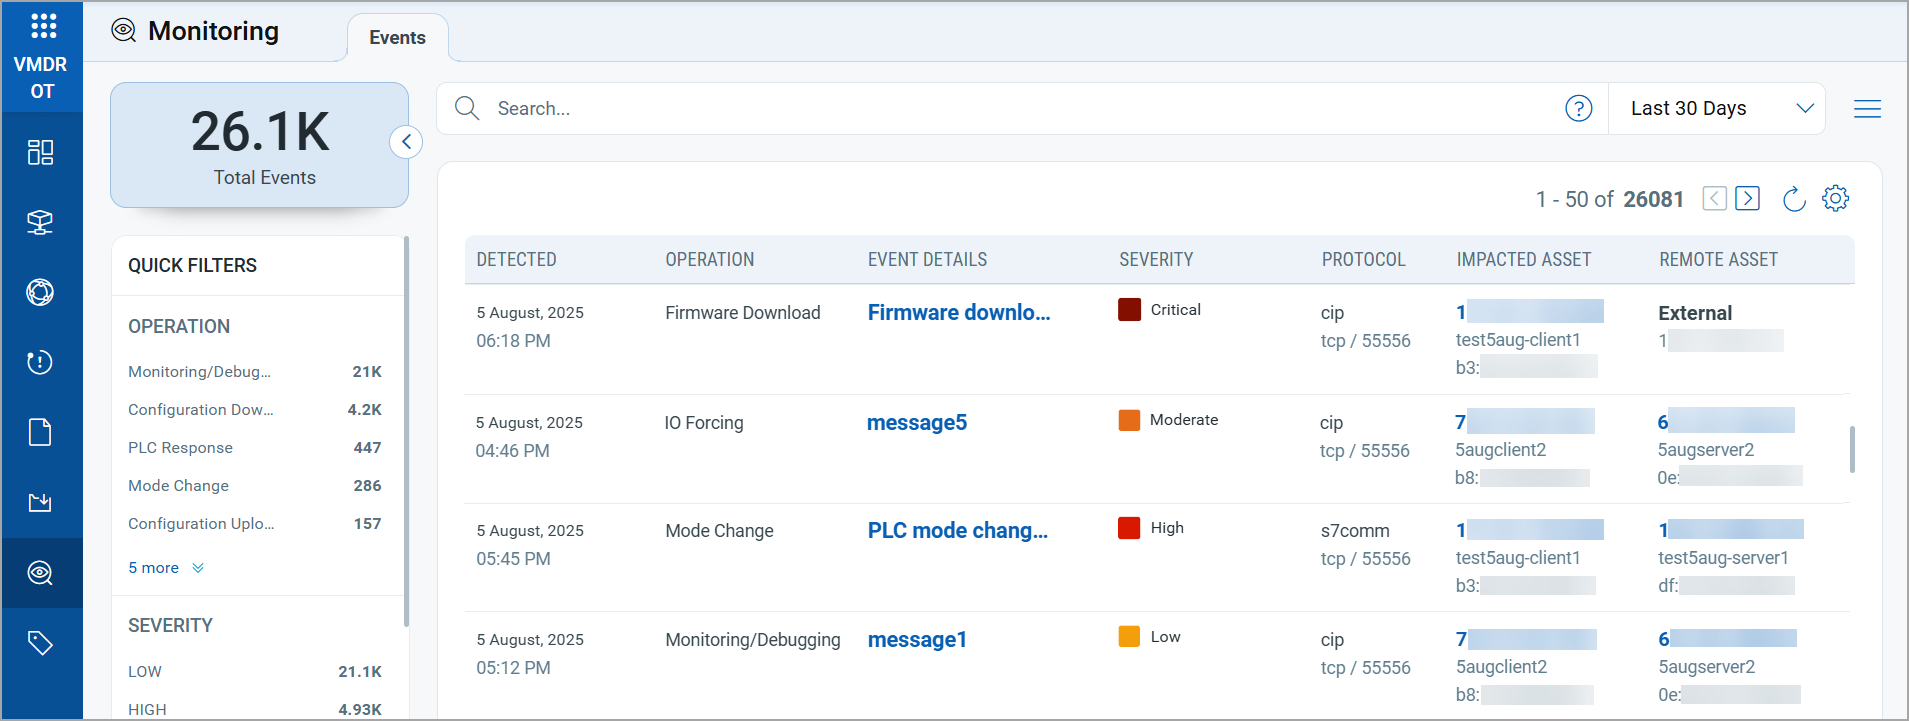
Process Integrity events are available to view in the Monitoring > Events tab.
VMDR OT stores these events for 90 days.
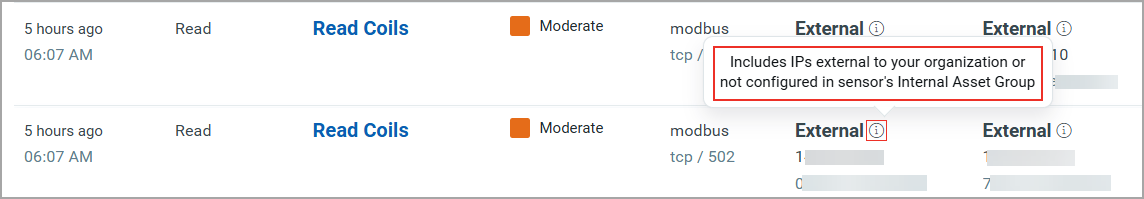
The special asset types listed below are either outside your OT network or not inventoried.
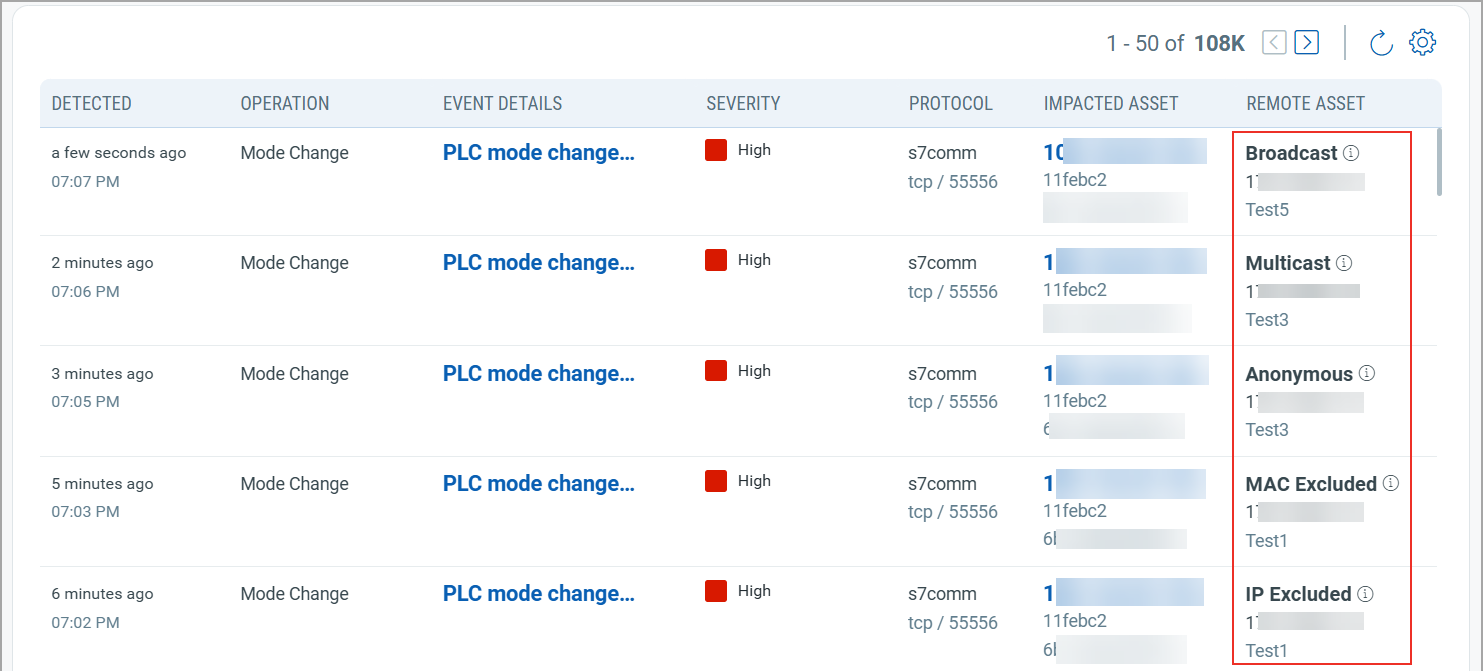
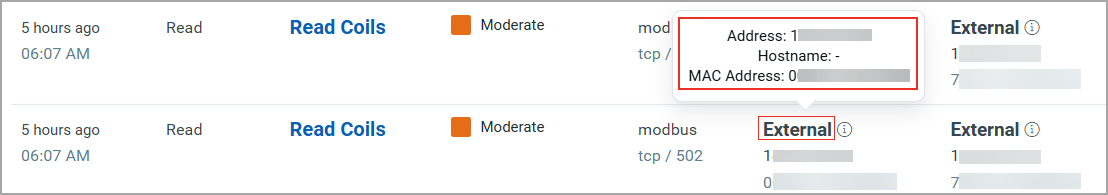
You can view more information about each asset by clicking the info icon next to it and hovering over the label. See the following images for example.
View Process Integrity Events
The VMDR OT records the following details:
| Column | Description |
|---|---|
| Detected | Displays the date and time when the event was detected. |
| Operation | Displays the operation detected on your network. These operations are categorized into different severity levels. To view the severity of operations, refer to the Severity Level of Operations. |
| Event Details | Displays the description of the event.
You can click the event to view more details. |
| Severity | Displays the potential security risk associated with the event (Critical, High, Moderate, Low). |
| Protocol | Displays the protocol used for the communication between assets.
VMDR OT supports the following protocols:
|
| Impacted Asset | Displays the OT asset IP address on which the operation is performed.
If the asset is within your OT network and inventoried, you can click the IP address to view asset details. If the asset is not inventoried, the IP address is displayed, but asset details are not accessible. Assets that are outside your OT network or non-inventoried are marked as External. |
| Remote Asset | Displays the remote asset IP address that performs the operation on the impacted asset.
If the asset is within your OT network and inventoried, you can click the IP address to view asset details. If the asset is not inventoried, the IP address is displayed, but asset details are not accessible. Assets that are outside your OT network or non-inventoried are marked as External. |
Severity Level of Operations
| Severity | Operation |
|---|---|
| Critical | All operations that involve External assets. |
| High | Configuration Download |
| PLC Response | |
| PLC Status | |
| Mode Change | |
| Configuration Upload | |
| Moderate | IO Forcing |
| Low | Monitoring/Debugging |
| Firmware Download | |
| Any other operation |
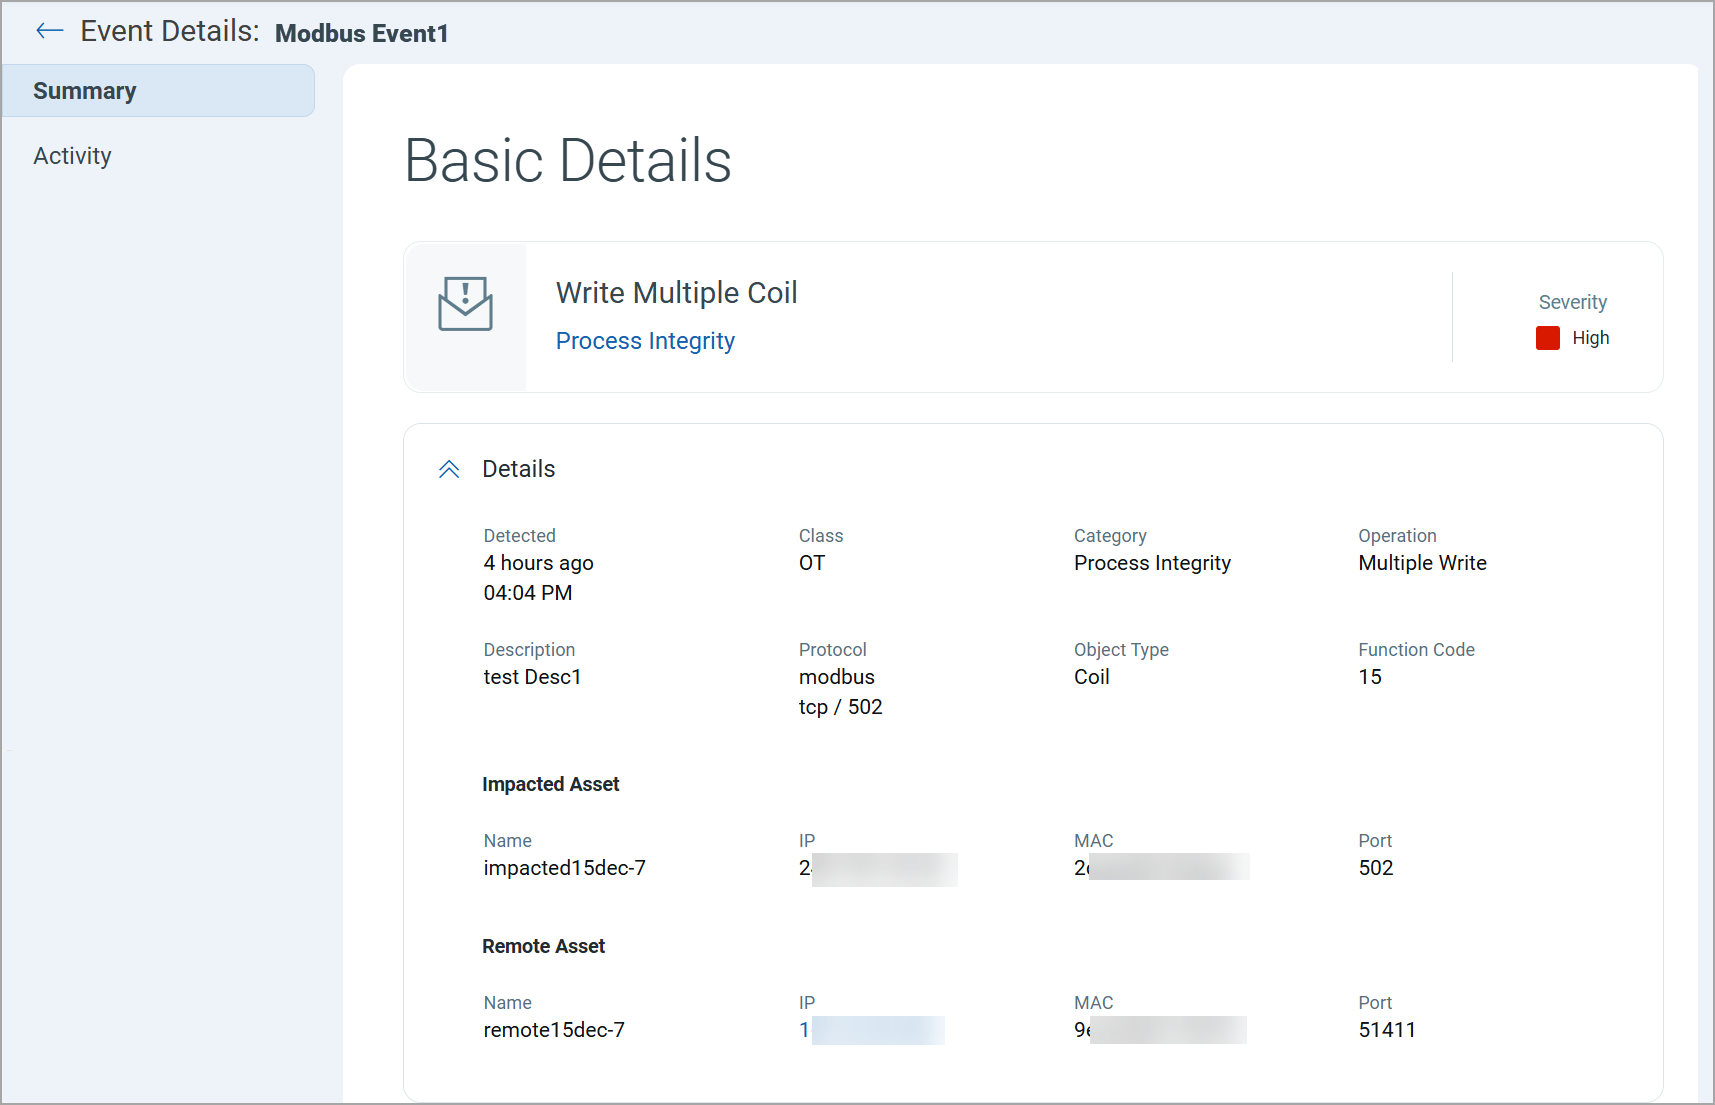
View Process Integrity Events Details
The following table explains each field displayed on the Event Details page:
| Section | Field | Description |
|---|---|---|
| Details |
Detected | Displays the timestamp when the event was detected. |
| Class | Displays the event class, such as OT. | |
| Category | Displays the category of the event. | |
| Operation | Displays the action captured based on the protocol.
For example:
|
|
| Description | Displays the description of the operation captured in the event. | |
| Protocol | Displays the communication protocol used between assets, such as s7comm, cip, and Modbus. | |
| Object Type | Displays the Modbus data object involved in the operation. | |
| Function Code | Displays the Modbus function used to execute the operation. | |
| Impacted Asset |
Name | Displays the name of the asset impacted by the operation. |
| IP | Displays the IP address of the impacted asset. | |
| MAC | Displays the MAC address of the impacted asset. | |
| Port | Displays the network port on which the impacted asset received the request. | |
| Label | Displays the type of special asset. For more information on these assets, refer to Special Asset Types. | |
| Remote Asset |
Name | Displays the name of the asset that initiated the operation. |
| IP | Displays the IP address of the remote asset. | |
| MAC | Displays the MAC address of the remote asset. | |
| Port | Displays the source port used by the remote asset. | |
| Label | Displays the type of special asset. For more information on these assets, refer to Special Asset Types. | |
| Passive Sensor Details | Displays network passive sensor details that monitor process integrity events in your network. | |
| Name | Displays the passive sensor's name. | |
| Location | Displays the location where the passive sensor is deployed. | |
| Sensor ID | Displays the passive sensor ID. | |
The Modbus Event Details also provide detailed visibility into Modbus activity, including read and write operations on the Event Details > Activity tab of any Modbus event. The number of activities displayed for each operation is as follows:
- Read: Maximum 100 activities.
- Write: Maximum 50 activities.
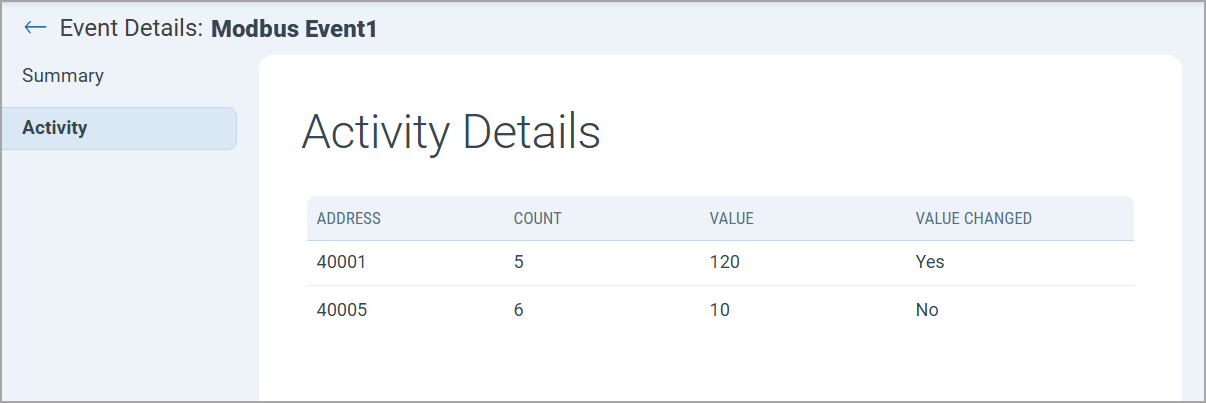
The following information is displayed on the Activity tab for a Modbus event:
| Field | Description |
|---|---|
| Address | The Modbus address identifies the specific data point in a device involved in the event. |
| Count | The number of times the event was captured for the specified address during the event timeframe. |
| Value | The value read from the address at the time the event was generated.
Value range depends on the object type:
|
| Value Changed | Indicates whether the value at the specified address changed compared to its previous captured value.
|
Quick Actions
The Quick Actions menu provides access to detailed event and asset information of an event. You can view the following details:
| Action | Description |
|---|---|
| Event Details | Displays a detailed view of the selected event, including all related assets and protocols. |
| Impacted Asset Details | Displays information about the asset affected by the operation, such as asset summary, network information, vulnerabilities, and the source of the asset.
If the asset is within your OT network and inventoried, you can click the IP address to view asset details. If the asset is not inventoried, the IP address is displayed, but asset details are not accessible. Assets that are outside your OT network or non-inventoried are marked as External. |
| Remote Asset Details | Displays details of the remote asset involved in the event.
If the asset is within your OT network and inventoried, you can click the IP address to view asset details. If the asset is not inventoried, the IP address is displayed, but asset details are not accessible. Assets that are outside your OT network or non-inventoried are marked as External. |
| View Surrounding Events | Displays events of impacted assets that occurred within a specific time window before and after the selected event. The following query is used to filter the surrounding events:
You can modify the duration of the event.lastDetectedDate token from the above query to view more surrounding events. |