TruRisk™ Score in the Qualys Ecosystem
The TruRisk™ Score provides a contextual measure of cyber risk for each vulnerability and asset. It combines vulnerability severity, exploit likelihood, threat intelligence, and asset importance to help prioritize what truly matters to your organization.
The following is the TruRisk™ Journey to the ROC:
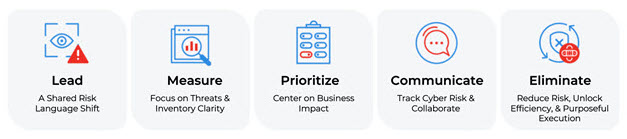
Within VMDR, TruRisk™ uses multiple inputs to calculate risk:
- Vulnerability data from detection (QIDs) across your assets.
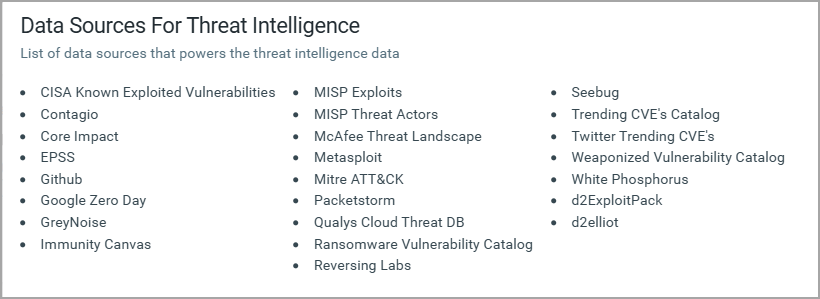
- Threat intelligence from over 25 global sources, covering exploit activity, malware associations, ransomware use, and known threat campaigns.
- Asset context, including criticality and exposure within your environment.
These factors are continuously evaluated to calculate a TruRisk™ Score (0–1000) for each asset reflecting both technical and business impact.
Higher scores indicate greater risk based on real-time exploitability and the importance of the affected asset.
By correlating vulnerability data with live threat indicators and asset context, TruRisk™ enables teams to prioritize vulnerabilities with the highest potential impact on business operations, thereby transitioning from traditional severity-based management to risk-based decision-making.
Interpreting Qualys TruRisk™ Scores
The following table lists the scores that can be queried individually for insights via our dedicated API endpoint.
| QDS/QVS Range | Description |
| >95 |
Vulnerability Detected by Qualys with a CVSS rating of Critical, High, or Medium AND has functional exploit code available AND exploit code is actively leveraged by threat actors, malware, and ransomware groups to compromise systems AND trending in the wild, dark web. And, High likelihood of exploitation in the next 30 days (EPSS) And, Evidence of exploitation in the wild |
| 90-95 |
Vulnerability Detected by Qualys with a CVSS rating of Critical, High, or Medium AND has functional exploit code available AND exploit code is actively leveraged by threat actors, malware, and ransomware groups to compromise systems. And, Evidence of exploitation in the wild And, High likelihood of exploitation in the next 30 days (EPSS) |
| 70-89 |
Vulnerability Detected by Qualys with a CVSS rating of Critical, High, or Medium AND has functional exploit code available, with no evidence of exploitation. And, CVSS rating of Critical, High, or Medium with evidence of exploitation, and mitigation in place. |
| 60-69 | Vulnerability Detected by Qualys with a CVSS Critical rating, AND a Proof of Concept (PoC) exploit is available. |
| 50-59 | Vulnerability Detected by Qualys with a CVSS High, AND a PoC exploit is available. |
| 40-49 | Vulnerability Detected by Qualys with a CVSS Critical, High, AND no exploit available. |
| 1-39 | Vulnerability Detected by Qualys with a CVSS Critical, High, Medium, AND low risk of exploitation. |
Understanding Your TruRisk™ Score
TruRisk™ Score is the overall risk score assigned to the asset based on the following contributing factors:
- Asset Criticality Score (ACS)
- Asset's Exposure
- Qualys Detection Score (QDS) scores for each QID level
- Auto-assigned weighting factor (w) for each criticality level of QIDs
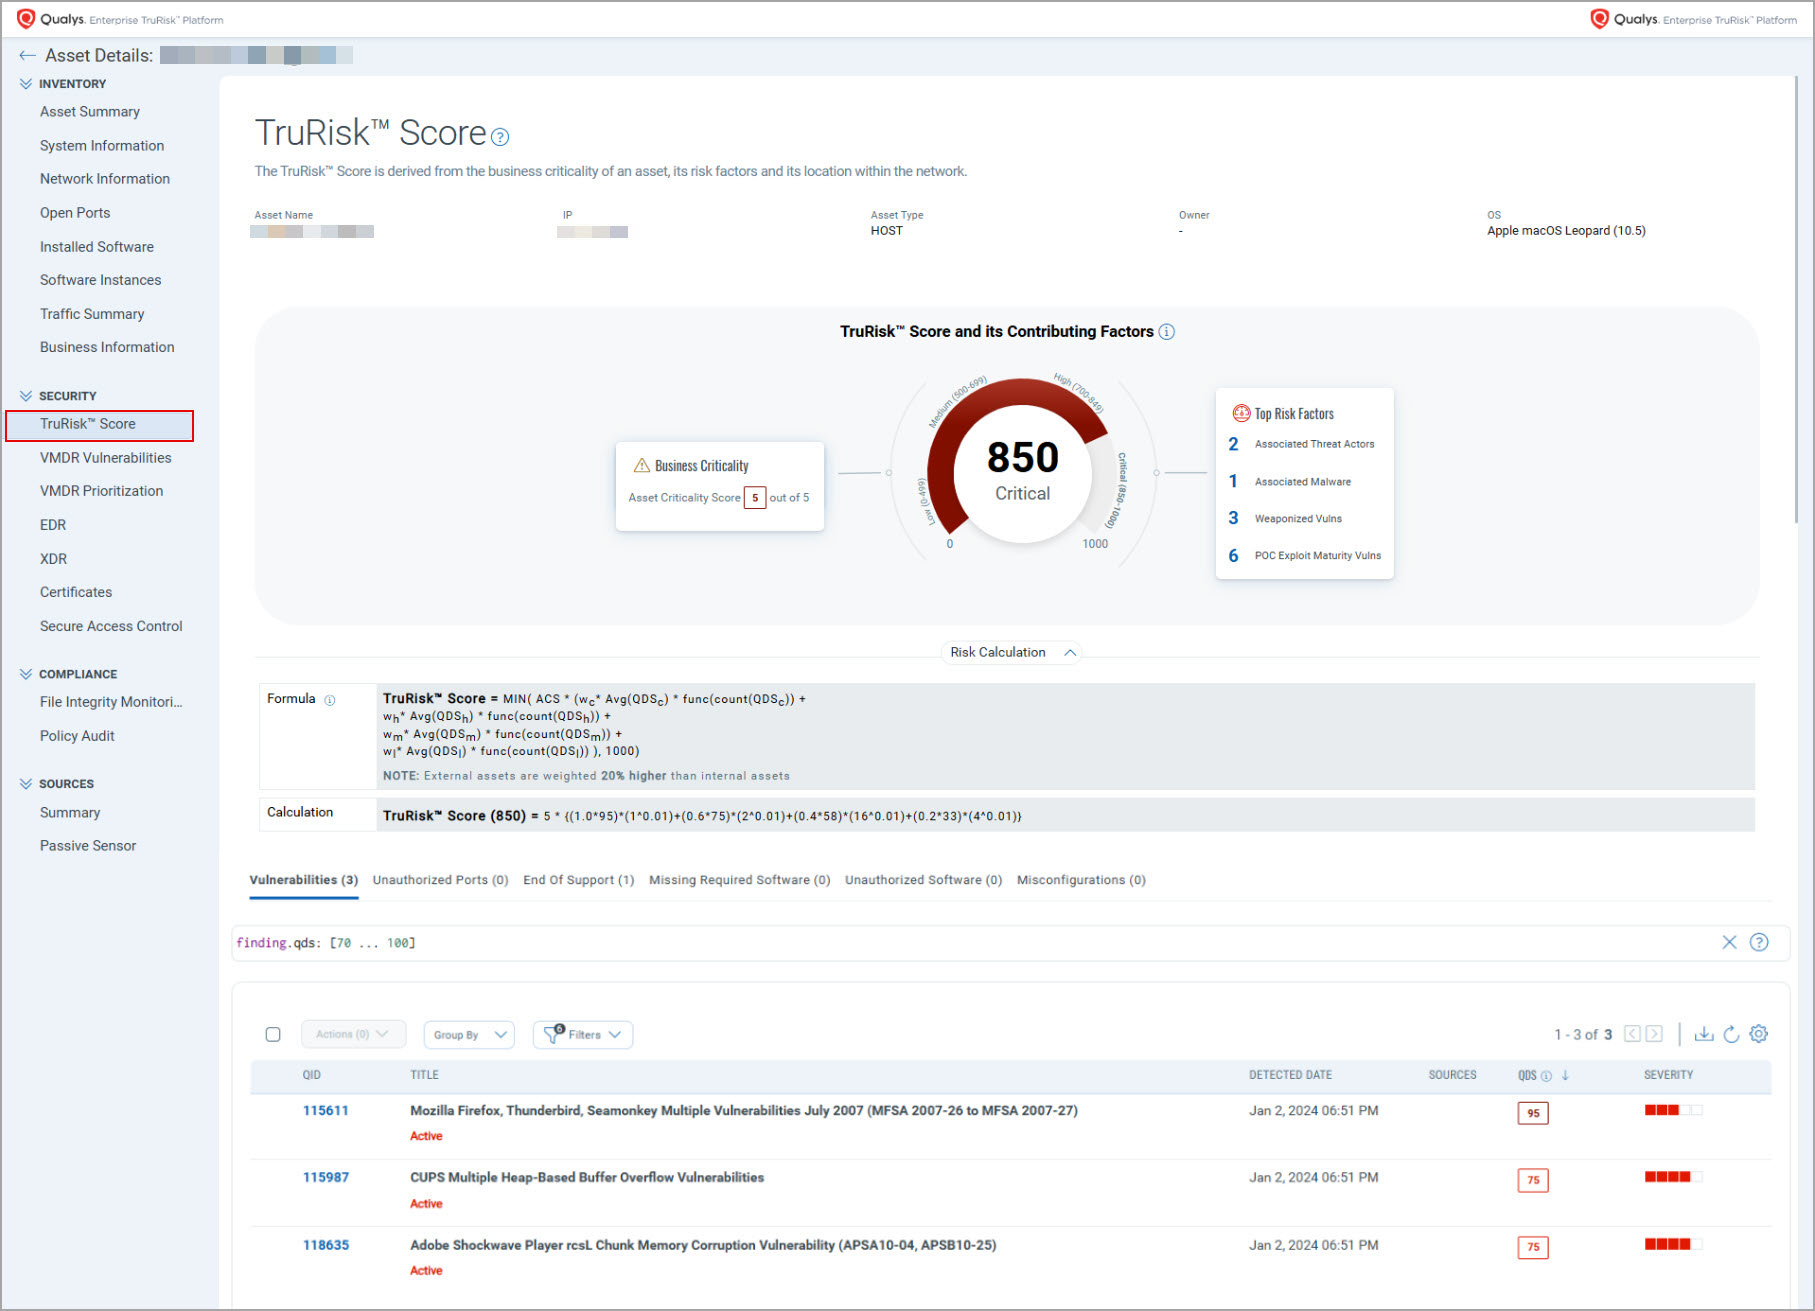
The Qualys TruRisk™ Score quantifies asset risk using a comprehensive formula that combines asset criticality, vulnerability severity, and external exposure factors.
| TruRisk™ Range | Severity | Description |
| 850-1000 | Critical | Critical assets with multiple critical or high vulnerabilities exposed to the internet |
| 700-849 | High | High-value asset with multiple number of high vulnerabilities or is exposed to the internet |
| 500-699 | Medium | Moderate-value assets with critical or high vulnerabilities |
| 0-499 | Low | Low-value asset with multiple vulnerabilities |
Core Formula Components
Basic TruRisk™ 1.0 Formula Structure
|
|
where,
- ACS: Asset Criticality Score
- w: Weighing factors fine-tuned by Qualys TruRisk™ algorithm for each severity level [critical(c), high(h), medium(m), low(l)]. Where 1.0 is critical, 0.6 is High, 0.4 is medium, and 0.2 is low.
- f(): Non-linear function that increases exponentially as the number of vulnerabilities increases.
- I(External): If an asset is External (Internet Facing), the score gets a 20% higher weight.
- Factor for external-facing assets or assets discoverable by Shodan, which increases the score appropriately.
TruRisk™ Formula for Unmanaged Assets
The TruRisk™ formula for managed assets considers the number of vulnerabilities; assets with greater vulnerabilities receive a higher score. The TruRisk™ formula for managed assets has the following features:
- The weighing factor (w) is based on the severity of the vulnerability.
- The maximum risk score is restricted to 1000.
- The new formula lists the External Tags.
- In case of an external asset, the entire TruRisk™ Score value is multiplied by 1.2
|
|
where,
- ACS: Asset Criticality Score
- w: weighing factor for each severity level of QVS [critical(c), high(h), medium(m), low(l)]
- Avg(QVS): Average of Qualys Vulnerability Score for each severity level of CVEs
TruRisk™ Formula Use Case
TruRisk™ Formula
|
|
Business Impact Considerations
The TruRisk™ Score calculation uses averages of critical, high, medium, and low detection. However, using averages has inherent implications: if a lower-score detection is fixed in the critical bucket, the average score increases even though risk was actually reduced. This design ensures that the formula reflects the overall risk landscape of an asset rather than being skewed by individual vulnerability fixes.
Use Case Examples
Asset 1: Internet-Facing Asset
Asset Details
- Asset Criticality Score: 5
- External facing: Yes (multiplier 1.2)
Vulnerability Profile
| Severity | Count | Average QDS |
| Critical | 2 | 95 |
| High | 10 | 84 |
| Medium | 40 | 65 |
| Low | 30 | 31 |
Result: TruRisk Score = 1000
Contributing Factors
- High Asset Criticality Score (5)
- Average QDS scores across all severity levels
- External asset weighing factor (1.2)
If the asset is external-facing, it is assigned a weight that is higher than that of internal assets. This increased weighting reflects its greater exposure and potential impact, as external-facing assets present significantly higher security risks if compromised.
Asset 2: Non-Internet-Facing Asset
Asset Details
- Asset Criticality Score: 4
- External facing: No (multiplier 1.0)
Vulnerability Profile
| Severity | Count | Average QDS |
| Critical | 3 | 95 |
| High | 0 | 0 |
| Medium | 50 | 65 |
| Low | 20 | 30 |
Result: TruRisk Score = 518
Contributing Factors
- High Asset Criticality Score (4)
- Average QDS scores across all severity levels
- Internal asset weighing factor (1)
Alternative Formula Version
There is also another version of the TruRisk™ calculation formula for calculating the TruRisk™ Score of managed and unmanaged assets. Instead of using average values of critical, high, medium, and low detections, this formula uses the maximum detection value and detection count across these categories.
This formula is not available by default. If you want to use the 2.0 formula version, contact your TAM to enable ETM.
TruRisk™ 2.0 Formula Structure
The Asset Risk Score (ARS) is calculated using two primary components: Asset Context and Threat or Vulnerability Context.
- Asset Context: represents the characteristics of an asset, such as its criticality, whether it is externally facing, and the highest threat detected on the asset.
- Threat or Vulnerability Context: is based on vulnerability detections on the asset, such as those identified by VMDR.
|
|
Contributing Factors
- ACS: Asset Criticality Score (ranging from 1 to 5)
- External: If an asset is externally facing then it's value is 1.2 otherwise 1
- MaxQVS: Maximum of QVSCrit, QVSHigh, QVSMed, QVSLow
- g(MaxQVS):
- g(MaxQVS)=1.4 when QVS is between 90 and 100
- g(MaxQVS)=1.2 when QVS is between 70 and 89
- g(MaxQVS)=1.0 when QVS is between 0 and 69
- numCriticalDetections: Number Critical severity detections (vulnerabilities/detections) found, 90<=QVS<=100 i.e. QVS between 90 and 100
- numHighDetections: Number High severity detections (vulnerabilities/detections) found, 70<=QVS<=89 i.e. QVS between 70 and 89
- numMediumDetections: Number Medium severity detections (vulnerabilities/detections) found, 40<=QVS<=69 i.e. QVS between 40 and 69
- numLowDetections: Number Low severity detections (vulnerabilities/detections) found, 1<=QVS<=39 i.e. QVS between 1 and 39
- WtCrit: 0.7, Weight applied to Critical vulnerabilities/detections
- WtHigh: 0.2, Weight applied to High vulnerabilities/detections
- WtMed: 0.05, Weight applied to Medium vulnerabilities/detections
- WtLow: 0.05, Weight applied to Low vulnerabilities/detections
Use Case Example
Asset: Internet-facing Asset
|
|
Asset: Internal Asset
|
|