Report Template - Display
On this page, define how the report is to be displayed.
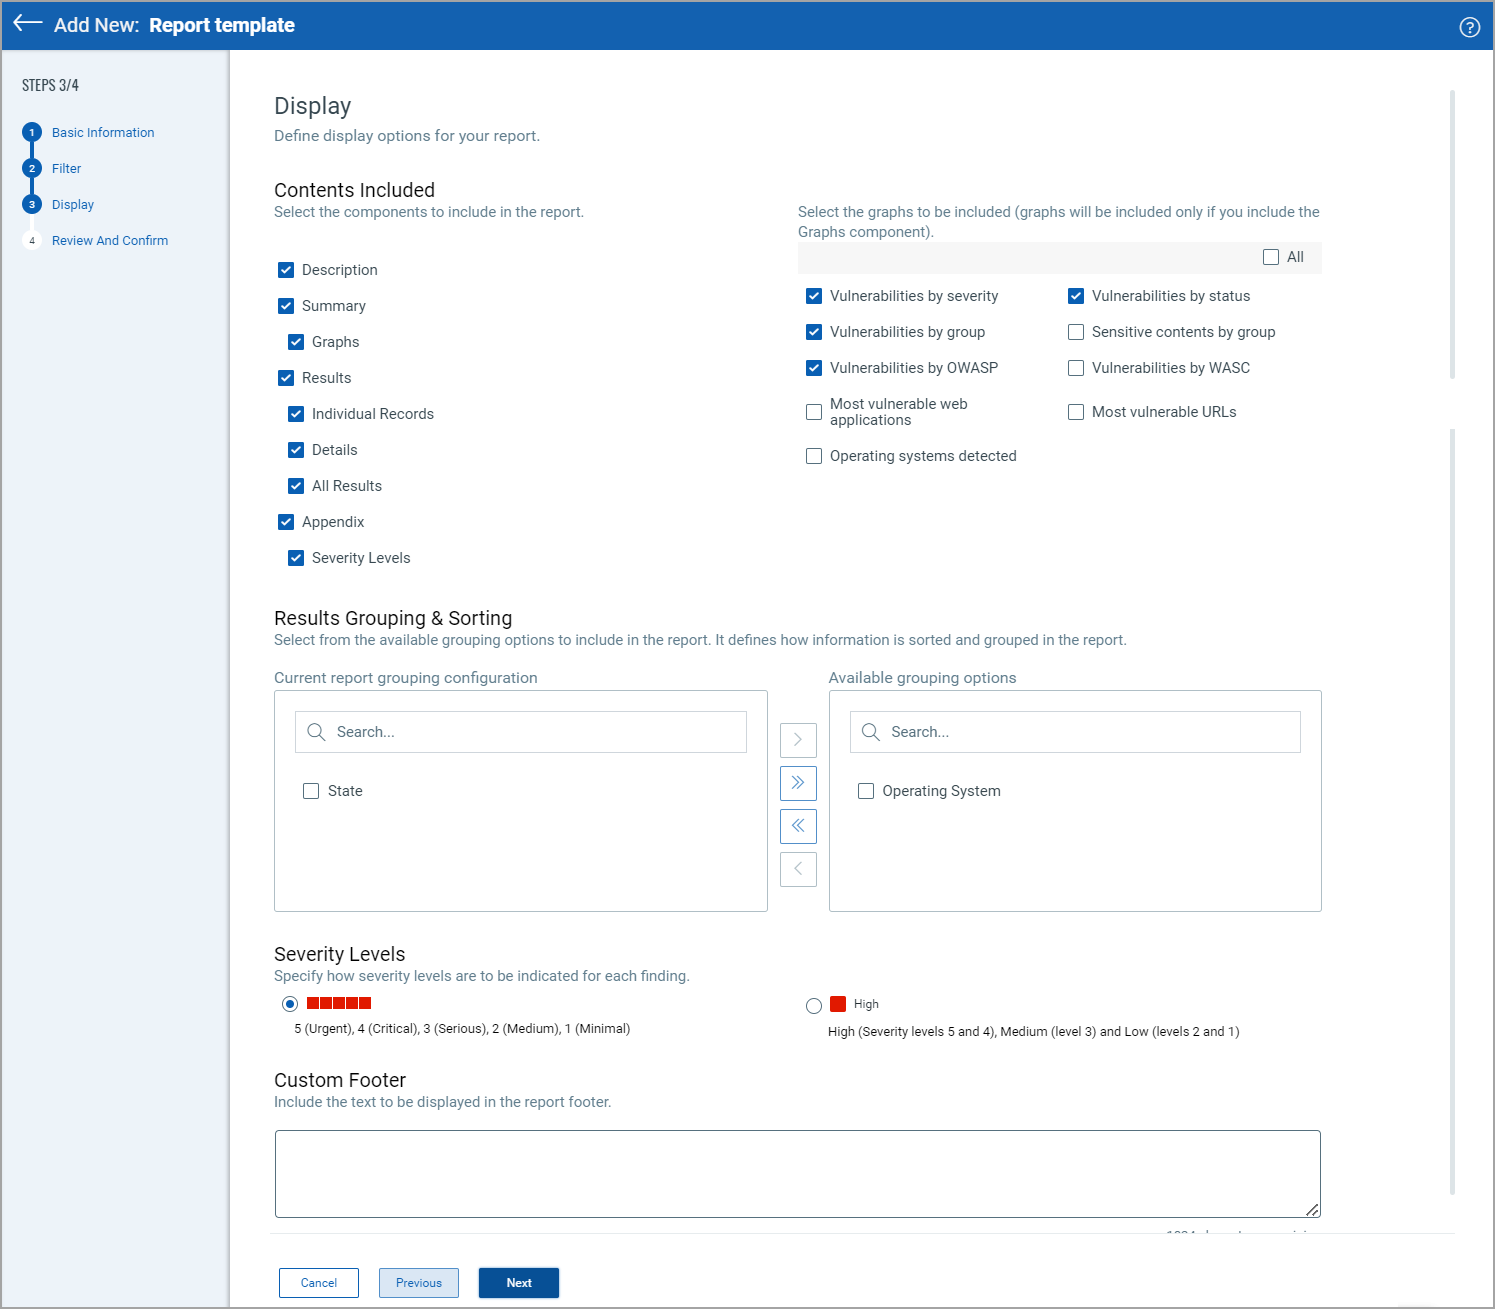
Contents Included
Select the check boxes under Contents Included to include respective sections in the report that is generated using this template.
If you want to include graphs in the report, click Graph check box in the Contents Included and select the type of graphs to be included from the Graphs component. For example, Vulnerabilities by severity, Vulnerabilities by OWASP, and so on.
scorecard report template - filter: The check boxes in the Content Included section are different based on the type of report.
Results Grouping & Sorting
The left column displays the included vulnerability groups and the order in which they appear in reports created with this template.
The right column displays vulnerability groups available to be included in the report. Select the groups from the right column and add them to the list of included vulnerability groups.
By default, the groups get added to the bottom of the list. You can redefine the sorting order by removing the groups and adding them in the order of preference.
Note: The columns available for selection are different based on the type of report.
Severity Levels
By default, severity levels 1 to 5 (Lowest to Critical) are displayed in reports created with this template. You can select Low, Medium, and High.
Note: This field is not available for the Catalog report template.
Custom Footer
Define a customized footer, and it is displayed in the WAS report: Web application report and scan report (HTML and PDF formats). Use the report template when you generate the report, and the custom footer is displayed in the reports.
Next step: Report Template - Review and Confirm