View Scan Details
To view the details of a scan, select a scan from the list, and from the Quick Actions menu, click View.

View Scan Details page displays the following tabs:
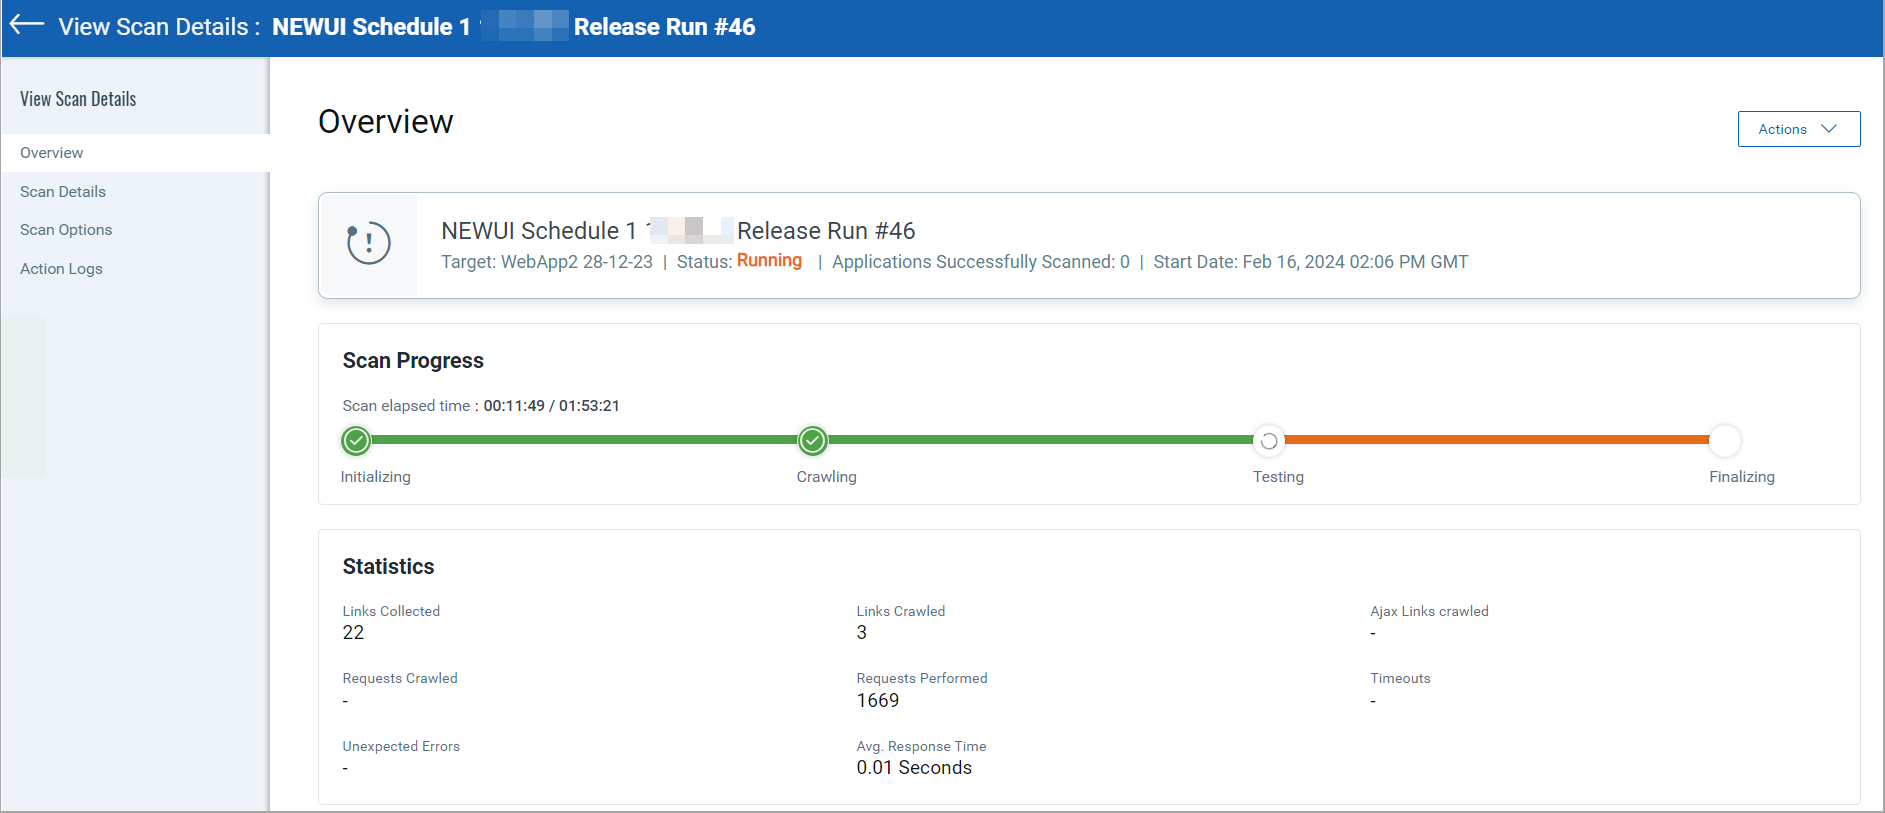
The Overview tab shows basic information about the scan—scan type, number of web applications scanned, status, start date, and duration of the scan.
The Scan Progress shows the scan progress line. The Green color on the line indicates the completed status and the Orange color shows the in-progress status.
The Statistics section on the Overview page displays the operating system, crawling time, response time, and so on.
The Authentication Information section on the Overview page displays the server name, server type, server authentication type, authentication status, and so on.

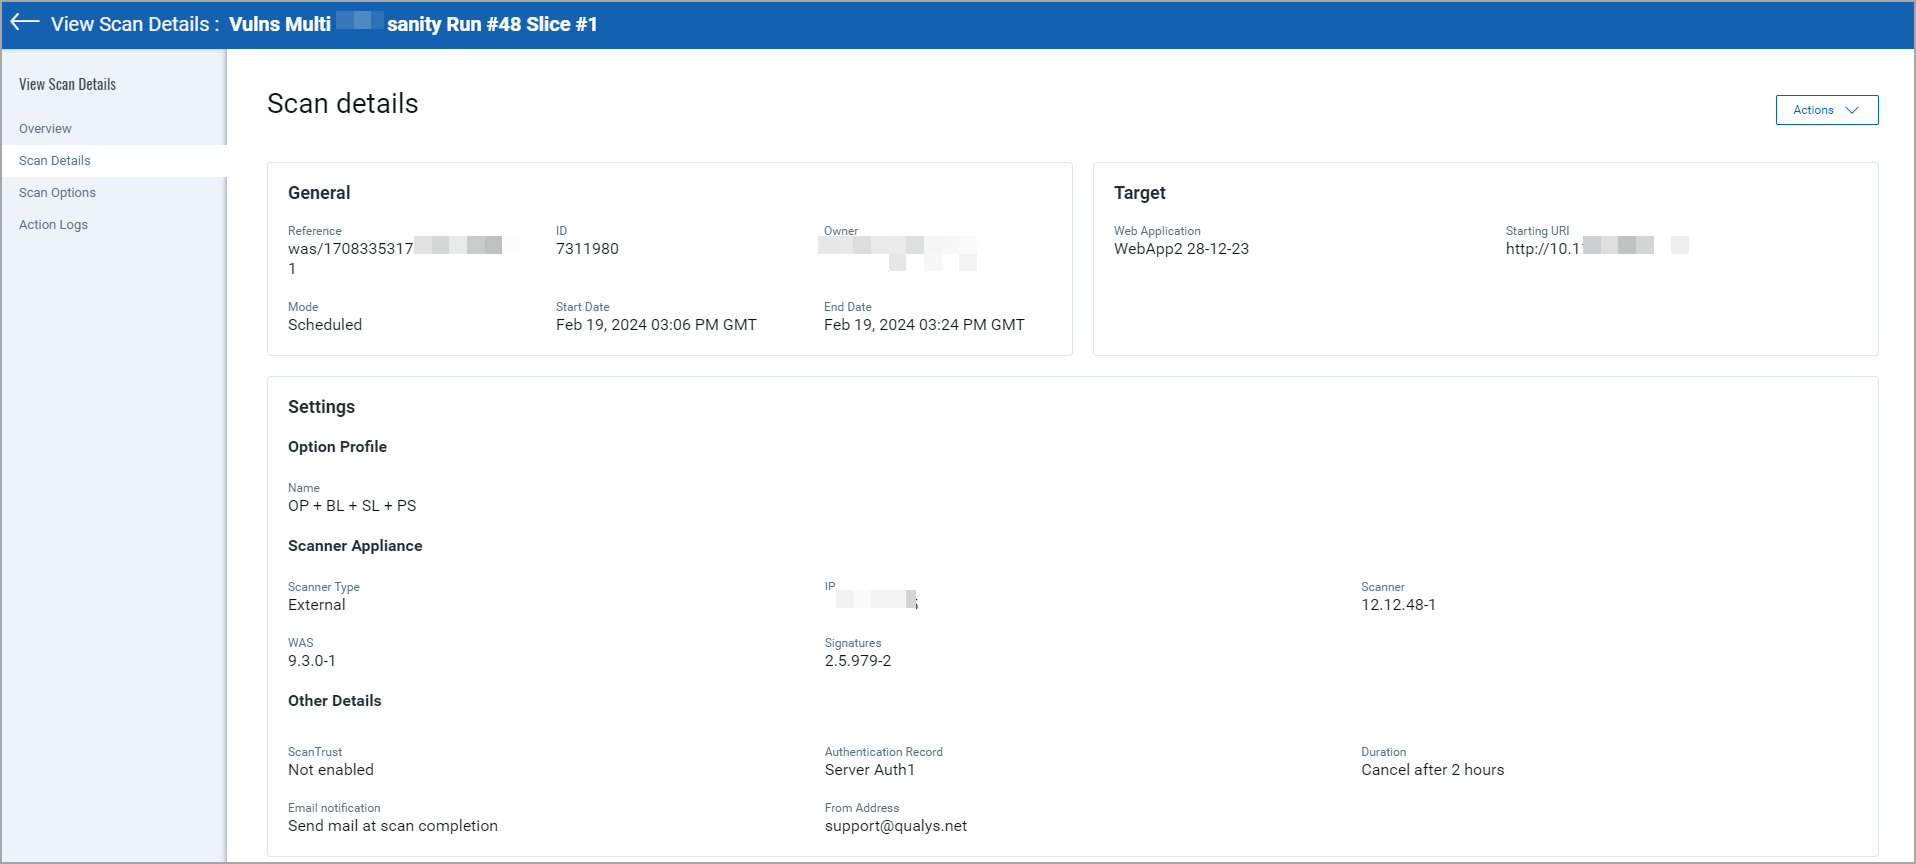
The Scan Details tab shows the details of the scan, such as General information, Target, start and end date, scan mode, owner of the scan, and other settings defined for the scan.

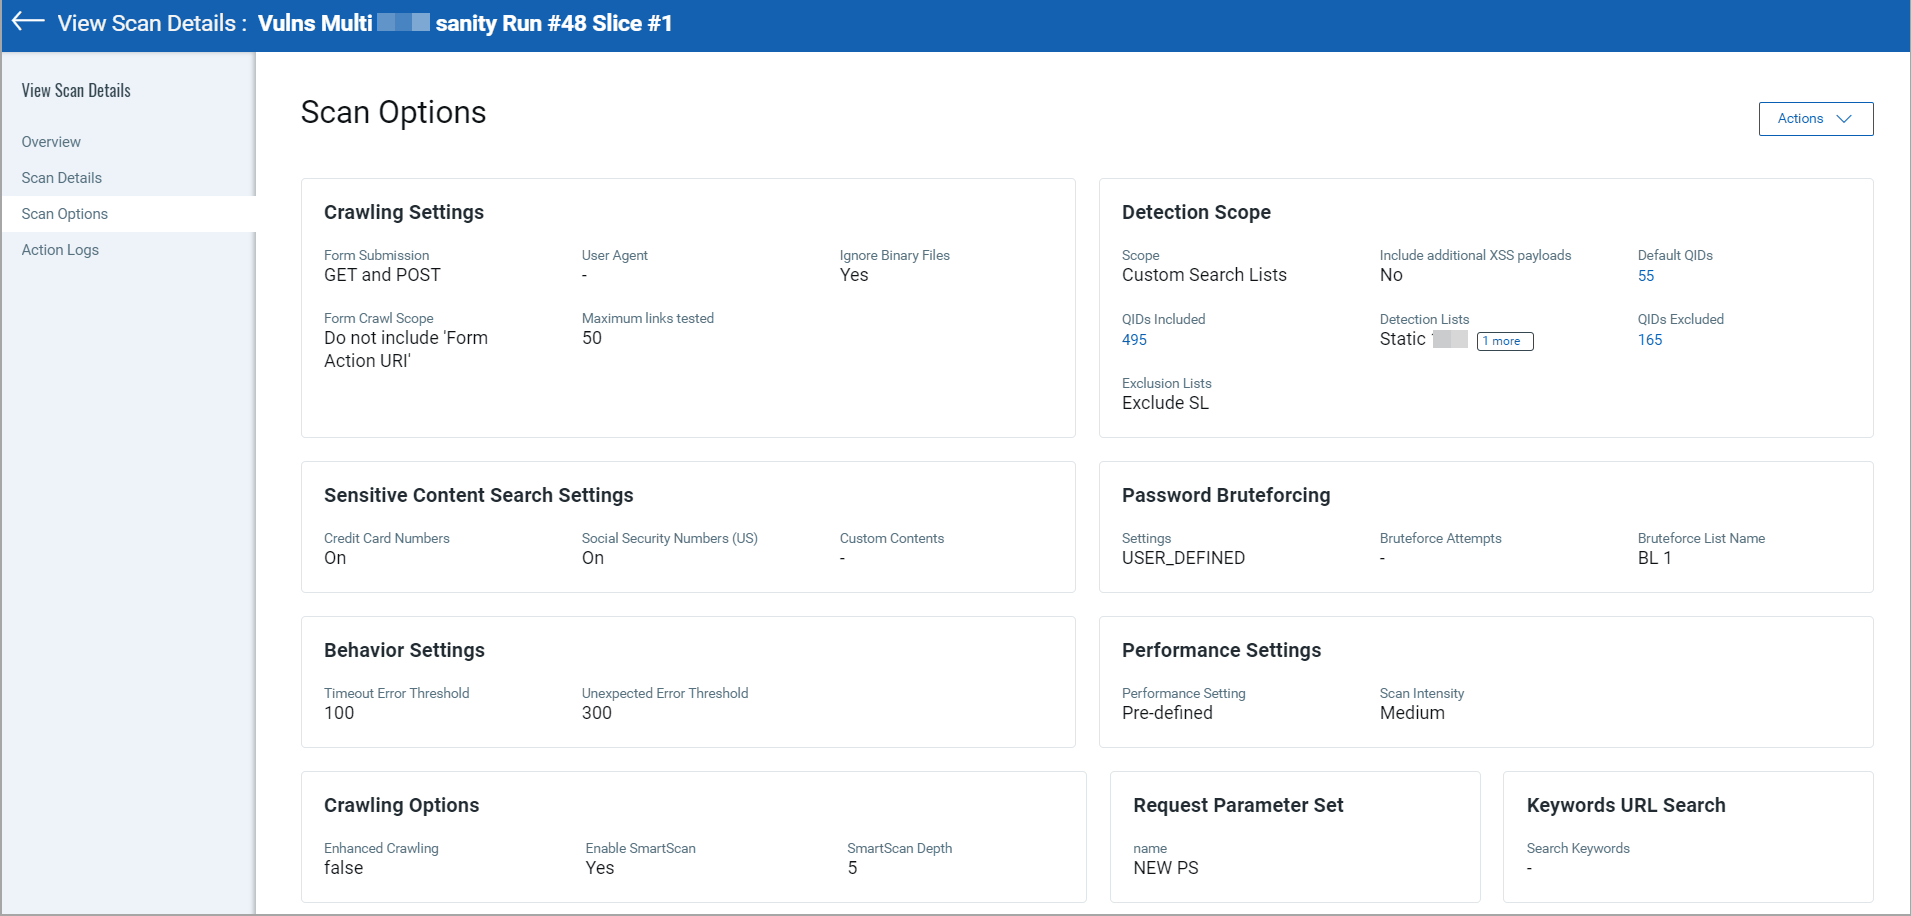
The Scan Options tab shows configurations defined for the scan, such as Crawling Settings, Detection Scope, Password Bruteforcing, Sensitive Search Settings, Behaviour Settings, Performance Settings, Crawling Options, Request Parameter Set, and Keyword URL Search.

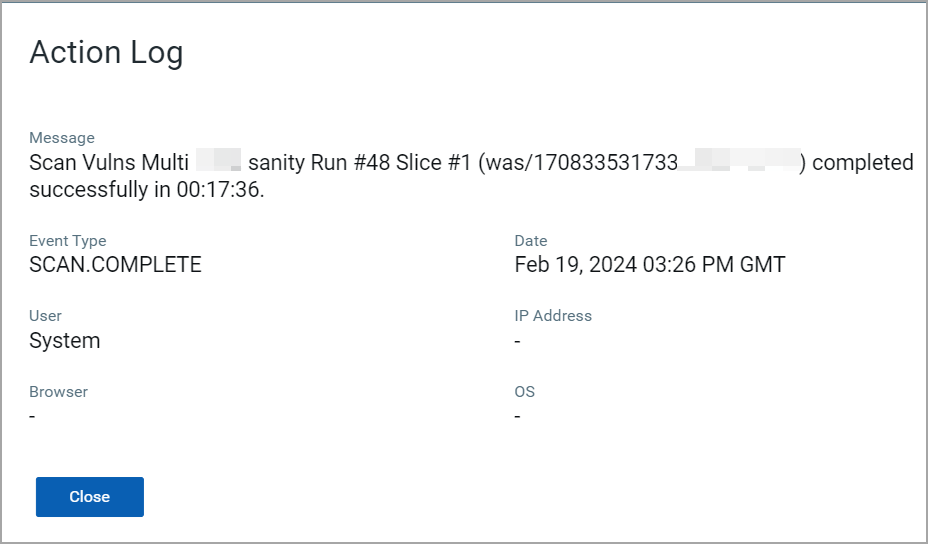
The Action Logs tab shows the actions performed on scans—launching and relaunching of the scan.

Click on a message from the list on the Action Logs page to see the detailed Action Logs.
With the Actions menu at the top, you can perform the following actions:
- View Sitemap
- View Report
- Cancel
- Cancel Scan with Results
- Scan Again
- Delete