Detections
The Detections page offers a complete interface for monitoring and managing security threats detected in real-time by Cloud Detection and Response across your infrastructure. This dashboard allows security analysts and IT professionals to track, analyze, and respond to security findings in real-time from a single view.

The Detections page consists of the following components:
Summary Cards
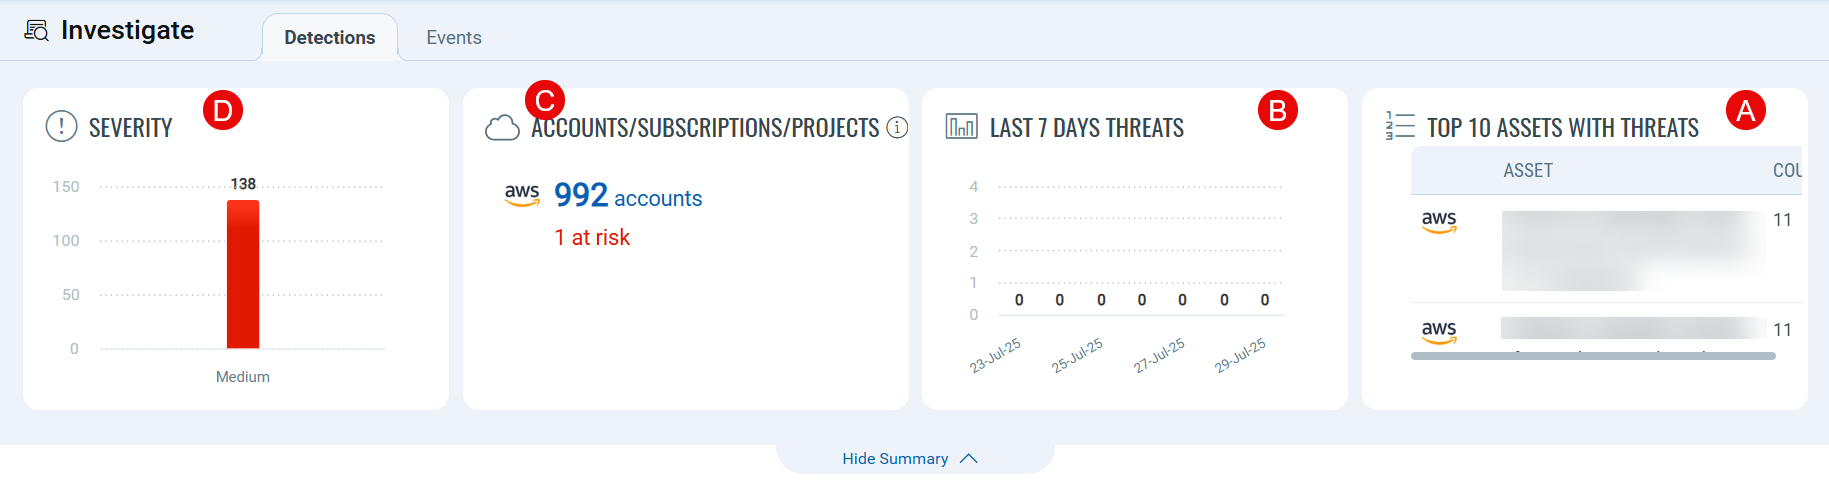
The dashboard header contains four key metric cards:
- Top 10 ASSETS WITH THREATS: It lists the most vulnerable or targeted assets and helps prioritize security responses.
- 7 DAYS THREATS: Presents a weekly overview of security threats while enabling trend analysis and pattern recognition.
- ACCOUNTS/SUBSCRIPTIONS/PROJECTS: Shows security findings across different organizational units and helps identify affected resources.
- SEVERITY: Shows the severity distribution of security findings and offers quick insight into critical issues.
Data Lists

On the main data list screen, you can find multiple columns that presents security findings collected from CDR.
The available columns are:
- Duration: The duration for which you would like to see the CDR findings. Example:
Today, Last 24 Hr, Last 7 days - Search for CDR findings: Use detection-specific QQL tokens to search for specific findings, or filter results based on a specific search criterion. For more information, refer to "Detections Tokens" for the Investigate tab.
- Search filters: The search filters let you filter the security findings by type, group, and resource type.
- TITLE: A descriptive name of the security finding.
- DETECTED ON: Shows the precise date and time when the threat was detected.
- SEVERITY: Shows the severity level associated with the threat.
- MITRE: The MITRE tactic name and ID linked to the threat.
- AFFECTED RESOURCE: Shows the assets affected by these findings.
- CLOUD IDENTIFIER: Shows which cloud provider is affected by this finding.