Registries in Your Account
The Assets > Registries tab shows the registries in your account.
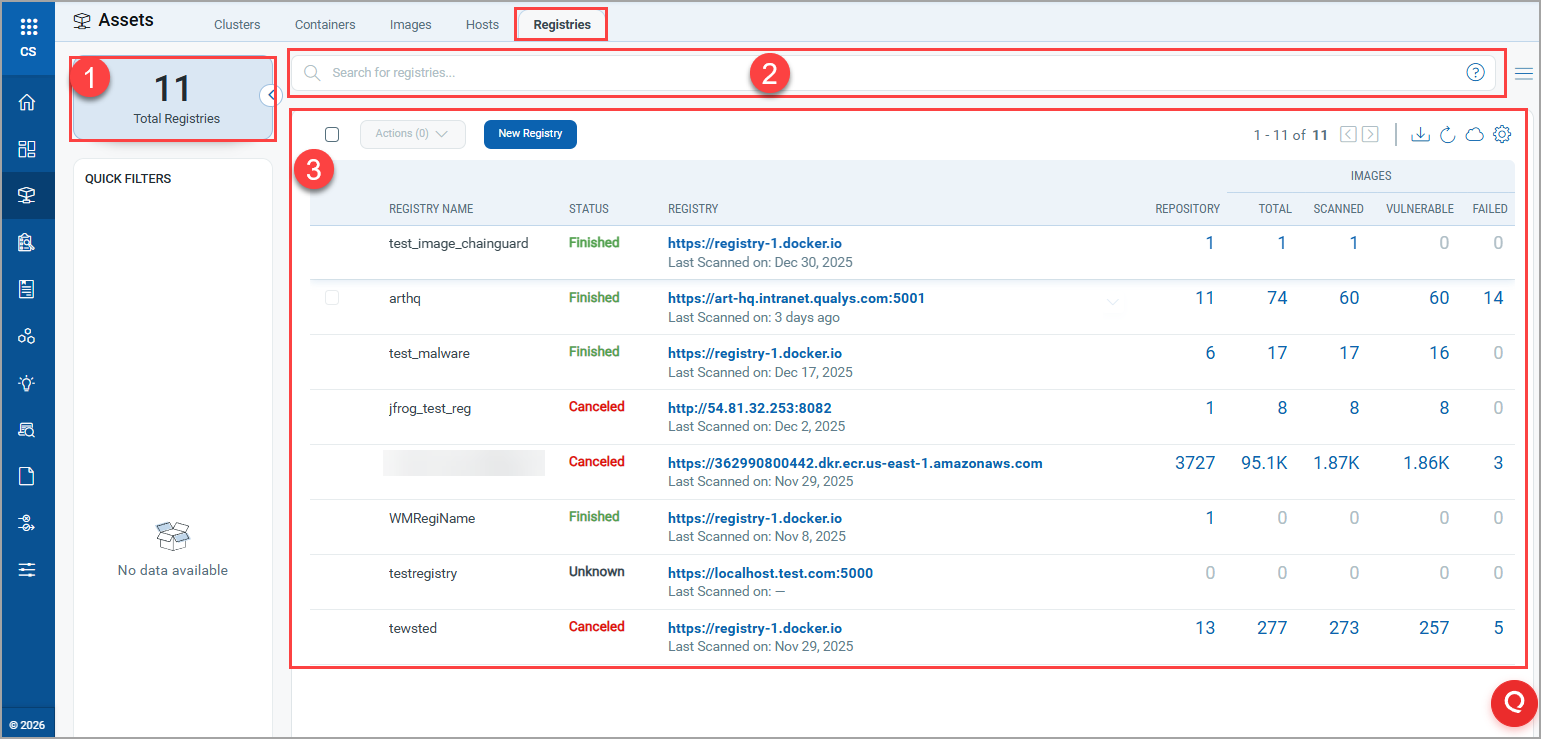
See Adding a new registry to scan to learn how to add and scan registries.
View Details of a Registry
Select View Details from the Quick Actions menu for any registry in the list to get comprehensive information about the registry. You can view detailed information about the registry: number of repositories, total number of images and number of vulnerable images within that registry. The Scan Jobs panel lists the On Demand and Automatic scan jobs created for that registry.
For more information, see Vulnerability Scanning of Registries.
Image counts on the Registry page (total, scanned, failed, vulnerable) reflect Vulnerability Scan results only. Policy Compliance (PC) scan statuses are not included in these counts.
Parallel Listing in Registry Scans
The registry sensor uses parallel listing by default to improve scan performance. In this mode, a dedicated set of sensor threads list tags and manifests while the remaining threads simultaneously begin listing and scanning images as they become available. This reduces the total time to surface scan results compared to the previous sequential approach.
Parallel listing also improves the accuracy of the scan job queue. Only one listing job is sent to the sensor at a time, so the queue accurately reflects the currently running job rather than showing multiple jobs as pending.
Parallel listing is enabled by default. Scan jobs are processed as soon as their corresponding listing is complete, so scan results appear faster in the Qualys Enterprise TruRisk™ Platform.
Disable or Re-enable Parallel Listing
If needed, you can disable parallel listing and revert to the sequential listing mechanism using a POD-level configuration parameter. This change takes effect without redeploying the sensor.
Set the following parameter in the registry sensor POD configuration:
- To disable parallel listing:
@DisableParallelListing: true - To re-enable parallel listing:
@DisableParallelListing: false(default)
After you update the configuration, the sensor detects the change at the next configuration fetch and switches to the appropriate listing mechanism.
Viewing Scan Job Executions
You can view detailed execution logs for each scan job from the Schedule Details page. This page provides insight into which sensor performed the scan, the listing timeline, and a per-image status breakdown.
To view scan job executions:
- Go to Assets > Registries and select Edit for a registry.
- Open the Schedules tab and click the name of a scan schedule.
- On the Schedule Details page, select Executions from the left panel.
The Executions list shows the following information for each scan job execution.
| Column | Description |
|---|---|
| Created Time | The date and time the scan job was created. |
| Listing Start Time | The date and time the sensor started listing images in the registry. |
| Listing End Time | The date and time the sensor finished listing images in the registry. |
| Listed By | The UUID of the sensor that listed and scanned the images. Click the UUID to view sensor details. |
| Listing Error | Any error encountered during the listing phase. Shows 0 when no errors occurred. |
| Status | The overall status of the scan job execution. Valid values: Finished, Running, Failed, Queued, Canceled. |
| Image Status | Breakdown of image scan results for this execution:
|
You can also select Activities from the left panel to view a history of all actions taken on the scan schedule.
Viewing Image Details for an Execution
Click any row in the Executions list to view scan details for individual images in that execution.
The image details page shows the following information for each image.
| Column | Description |
|---|---|
| Image ID | The SHA digest of the image. |
| Repository | The repository where the image is stored. |
| Tags | Tags associated with the image. |
| Scanned By | The UUID of the sensor that scanned the image. |
| Scan Start | The date and time the scan started for the image. |
| Scan End | The date and time the scan completed for the image. |
| Scan Errors | Error details if the image scan failed. Shows the error code, message, and context such as image name and sensor ID. |
| Status | The scan status of the image:
|