Assets
Devices or Assets are the entry points for attackers who can gain access to gather sensitive information on the assets or run malicious programs to control your organization's network. Use the Assets tab to secure your devices, such as laptops and desktops and monitor the system information. To ensure all the devices, servers, and networks are secure, you need options to provide robust protection for your assets.
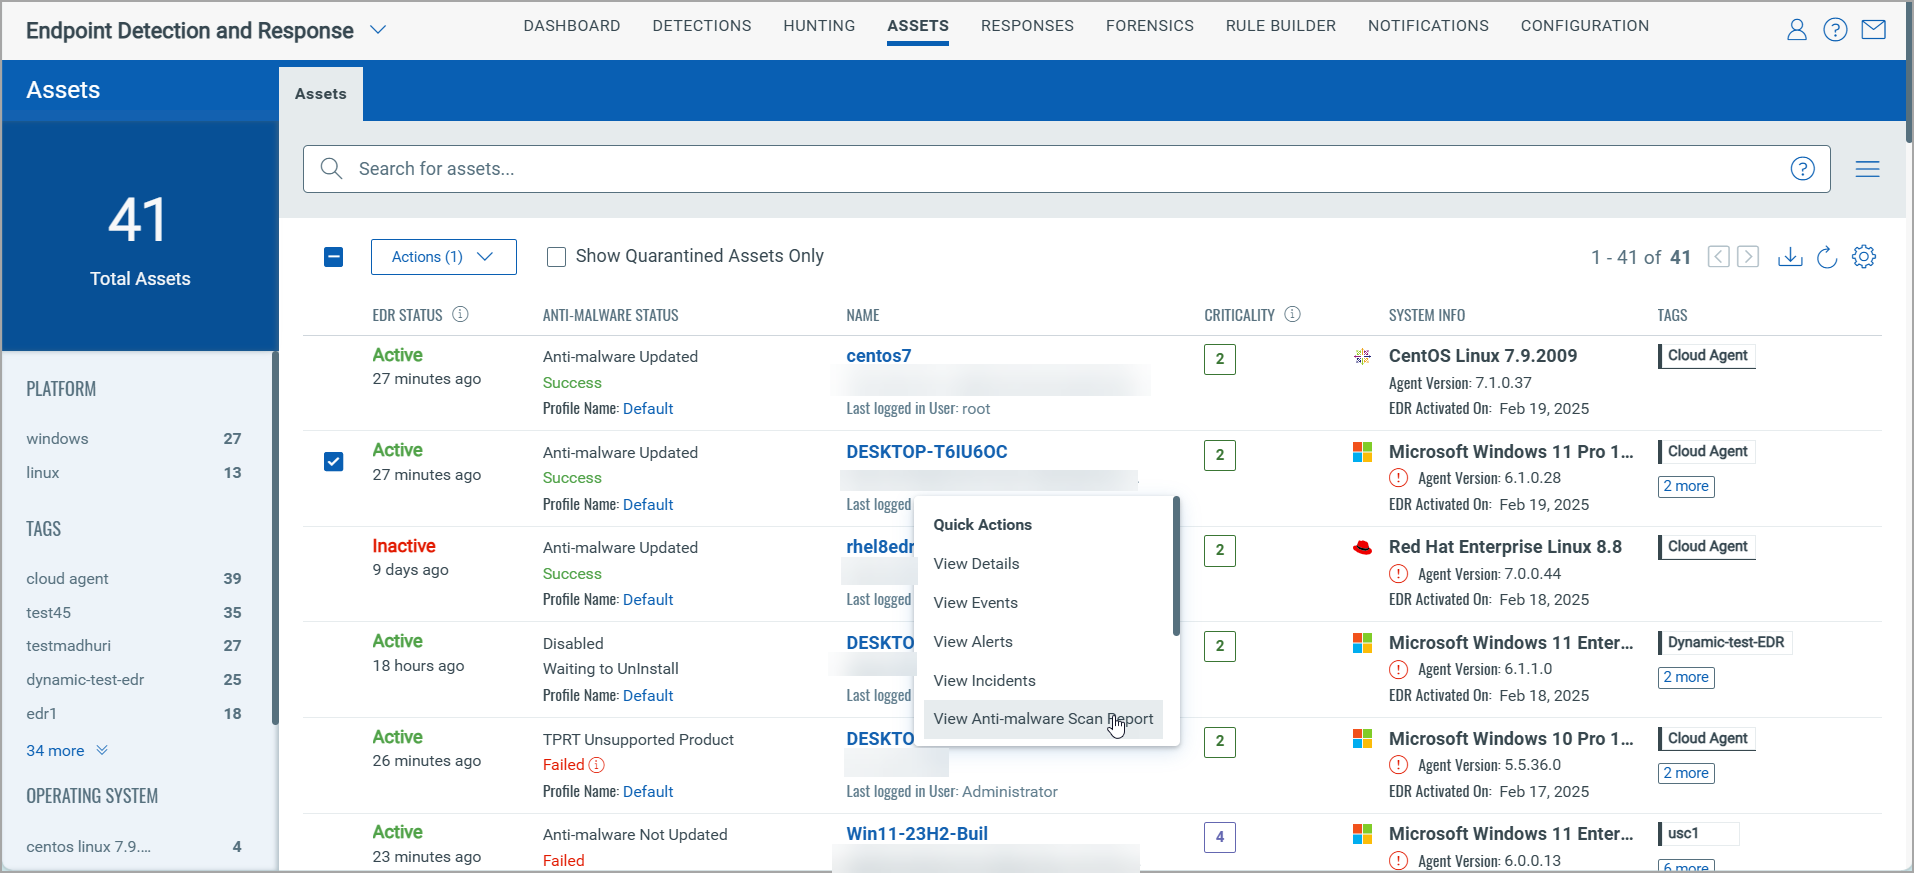
Columns on the Assets Page
The following Assets page screenshot displays EDR Status, Anti-Malware Status, Asset Name, Criticality, System Info, and Tags columns:
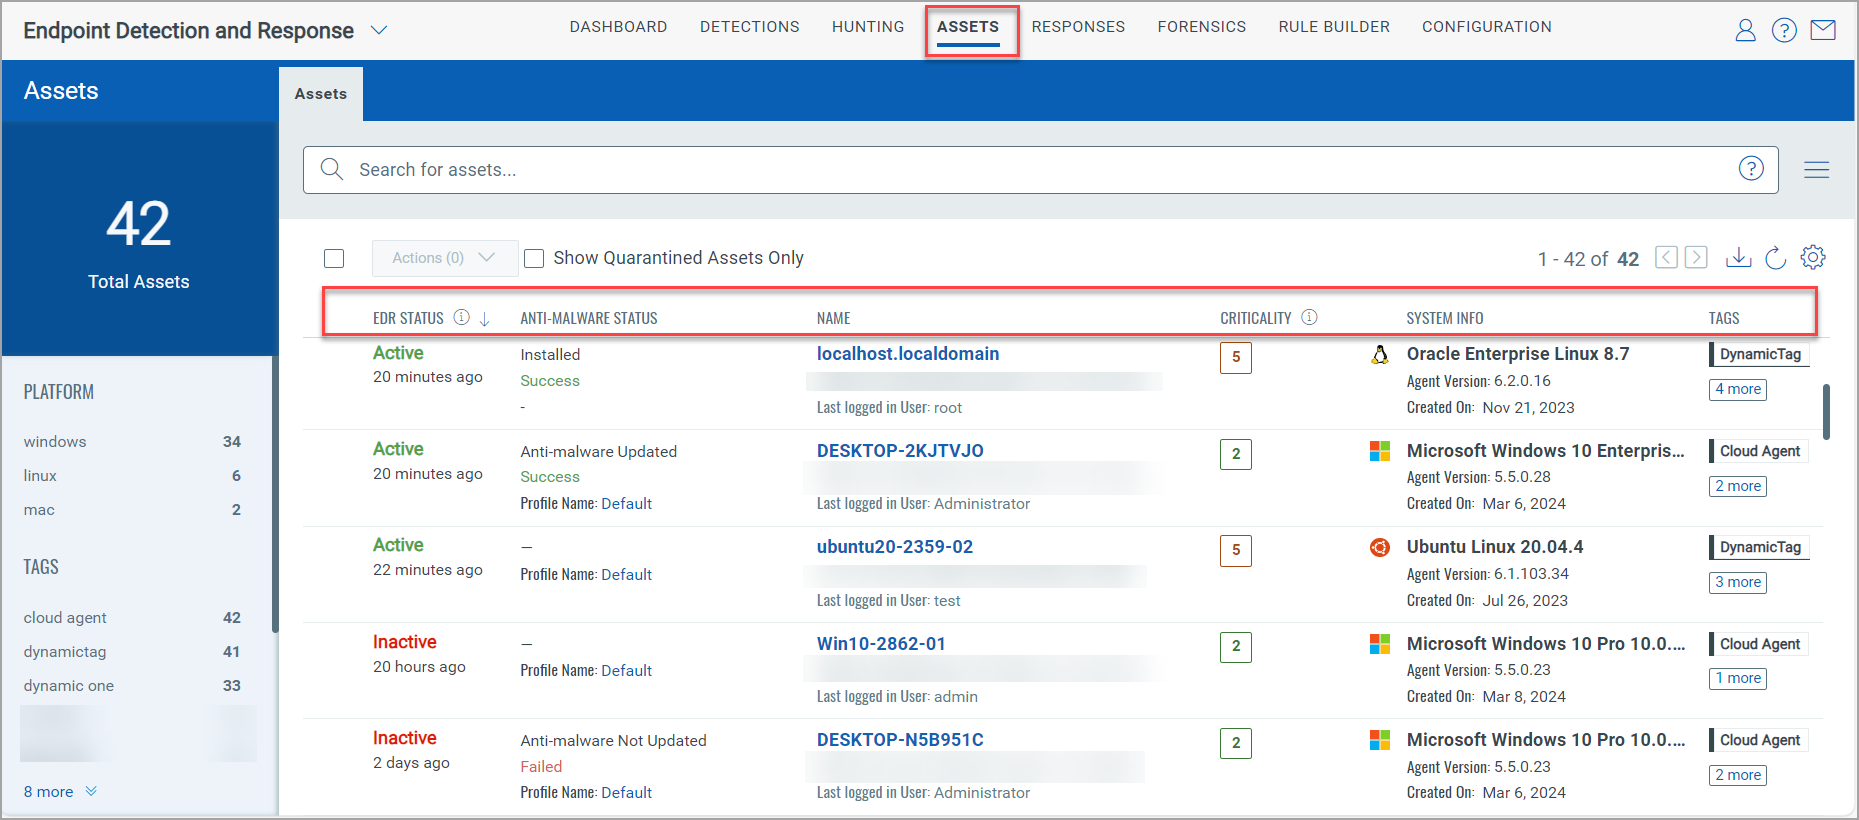
The following table lists the column names and their descriptions:
| Column Name | Description |
| EDR Status | Displays one of the following EDR Status for each asset:
|
| Anti-Malware Status | Displays the anti-malware status for each asset. If the anti-malware status is disabled, you can enable it from the Qualys Cloud Agent application. |
| Name | Displays the asset name, last logged-in user, and the asset hardware information. |
| Criticality | Lists the Criticality value of an asset. |
| System Info | Displays the agent information, including the agent OS, version, and the created date. |
| Tags | Lists the tags assigned to assets. |
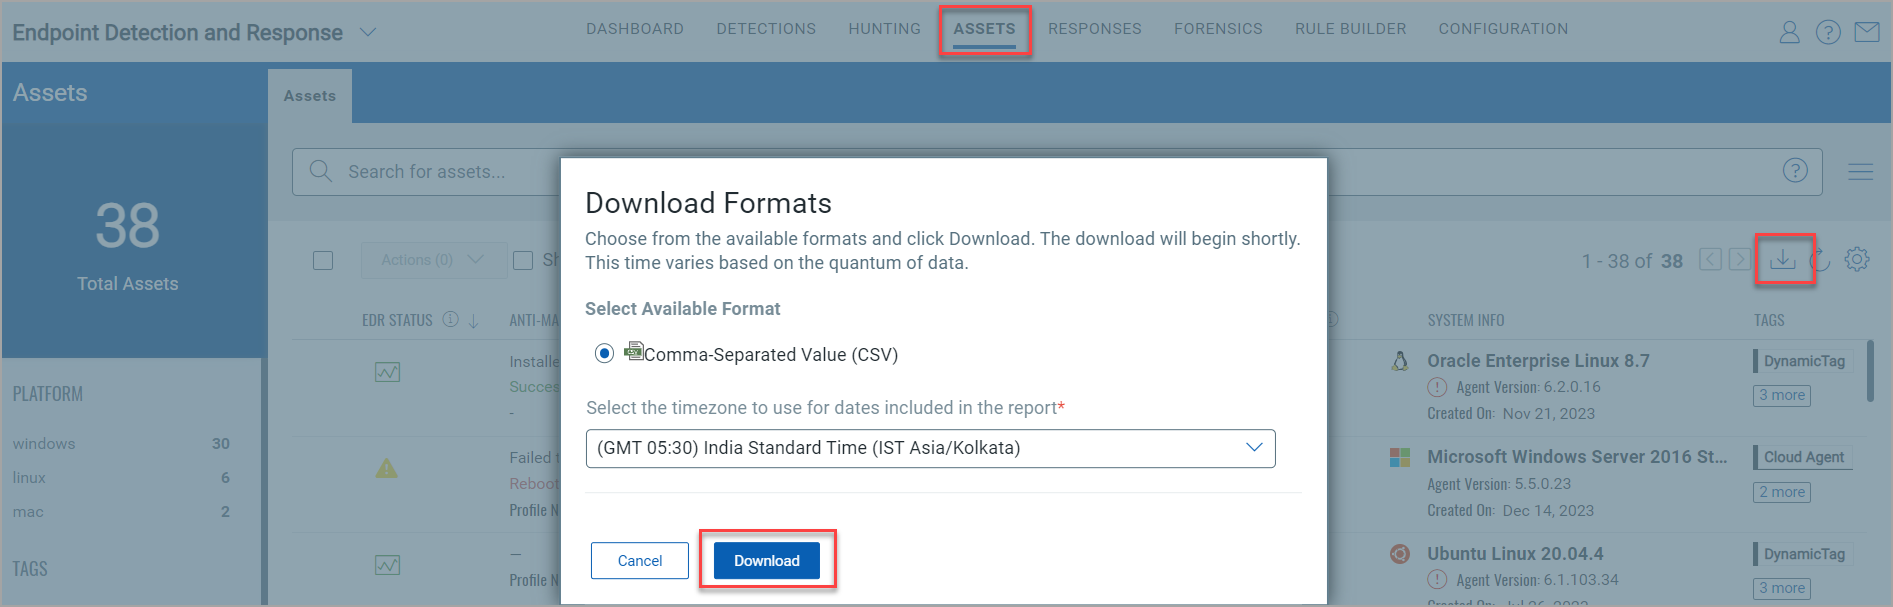
Download Asset Information in CSV Format
You can download the asset information using the Download icon ![]() in CSV format on your local system. The CSV report contains HostName,IP Addresses,Agent Version,Criticality Score,Modules, OS, Last Logged-In User, Tags, and AV Status.The following screenshot is an example of the Download Format window when you click the download icon:
in CSV format on your local system. The CSV report contains HostName,IP Addresses,Agent Version,Criticality Score,Modules, OS, Last Logged-In User, Tags, and AV Status.The following screenshot is an example of the Download Format window when you click the download icon:
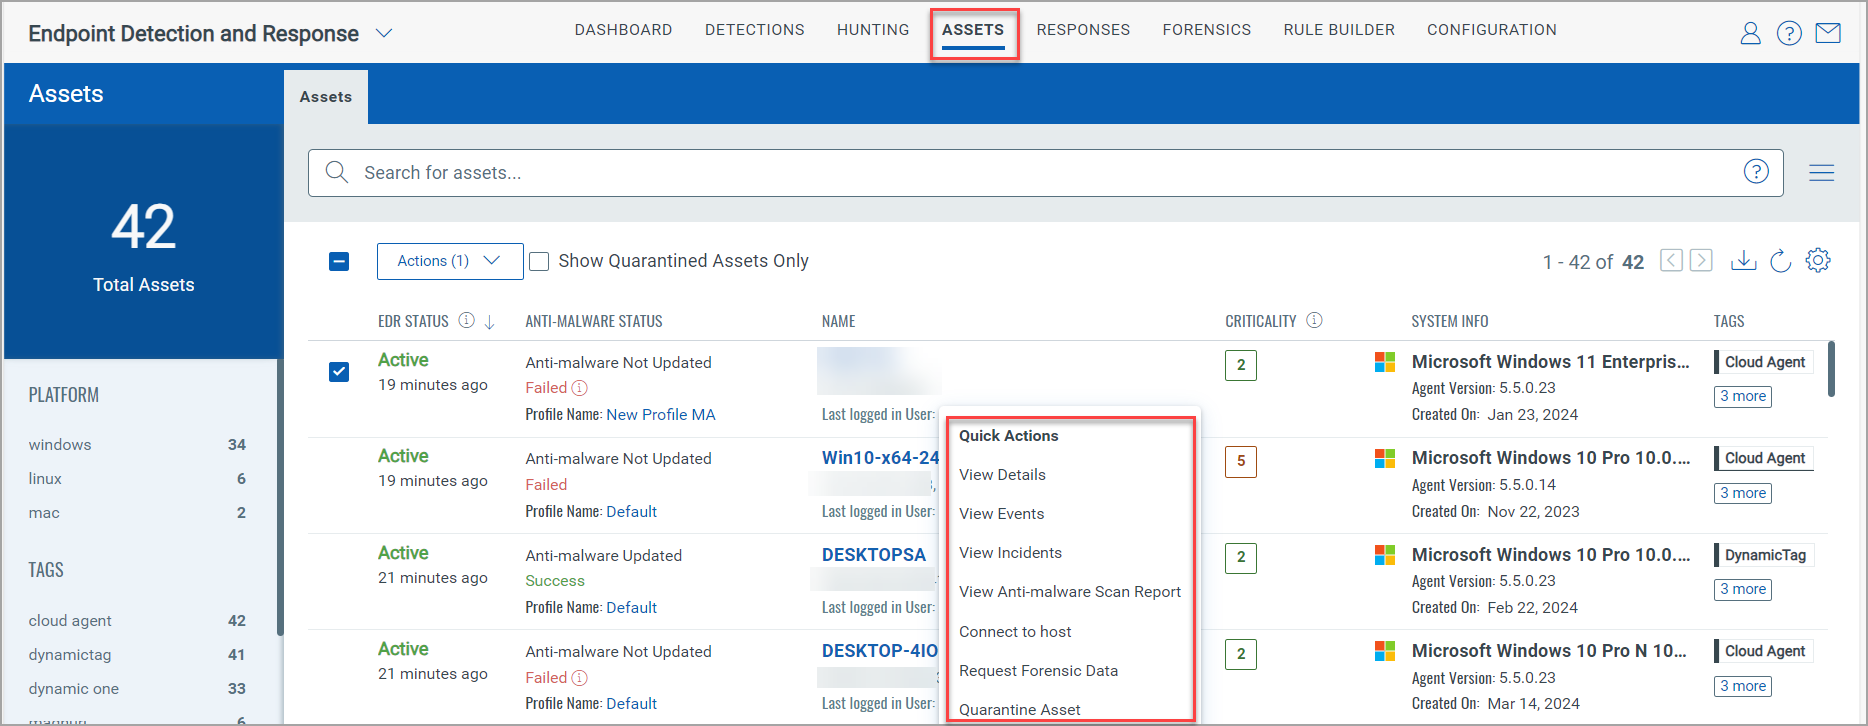
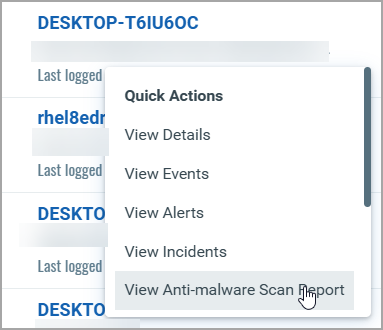
Assets Quick Actions Menu
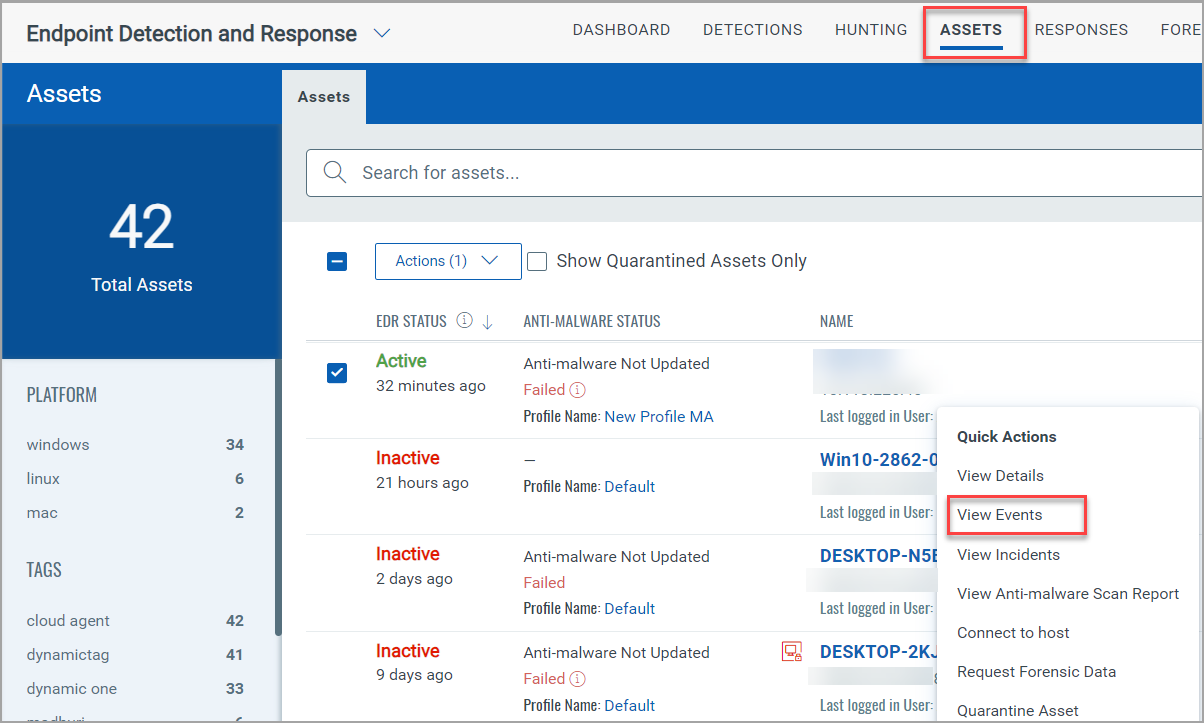
Using the Quick Actions menu in the Assets tab allows you to perform common actions from the same page that can also be performed from different tabs. You can perform actions such as View Details, View Events, View Incidents, View Anti-malware Scan Report, Connect to host, Request Forensic Data, Quarantine Asset, and Override Quarantined Host Configurations.
The following screenshot represents the Quick Actions menu of the Assets page:
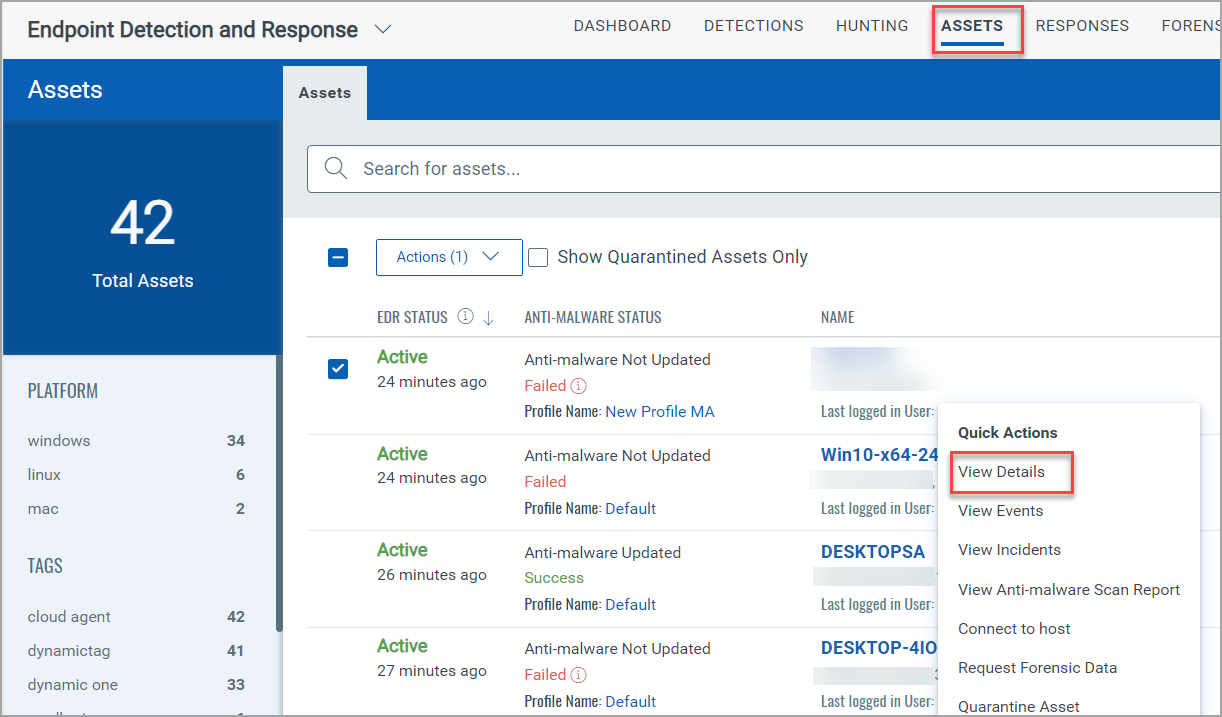
View Details
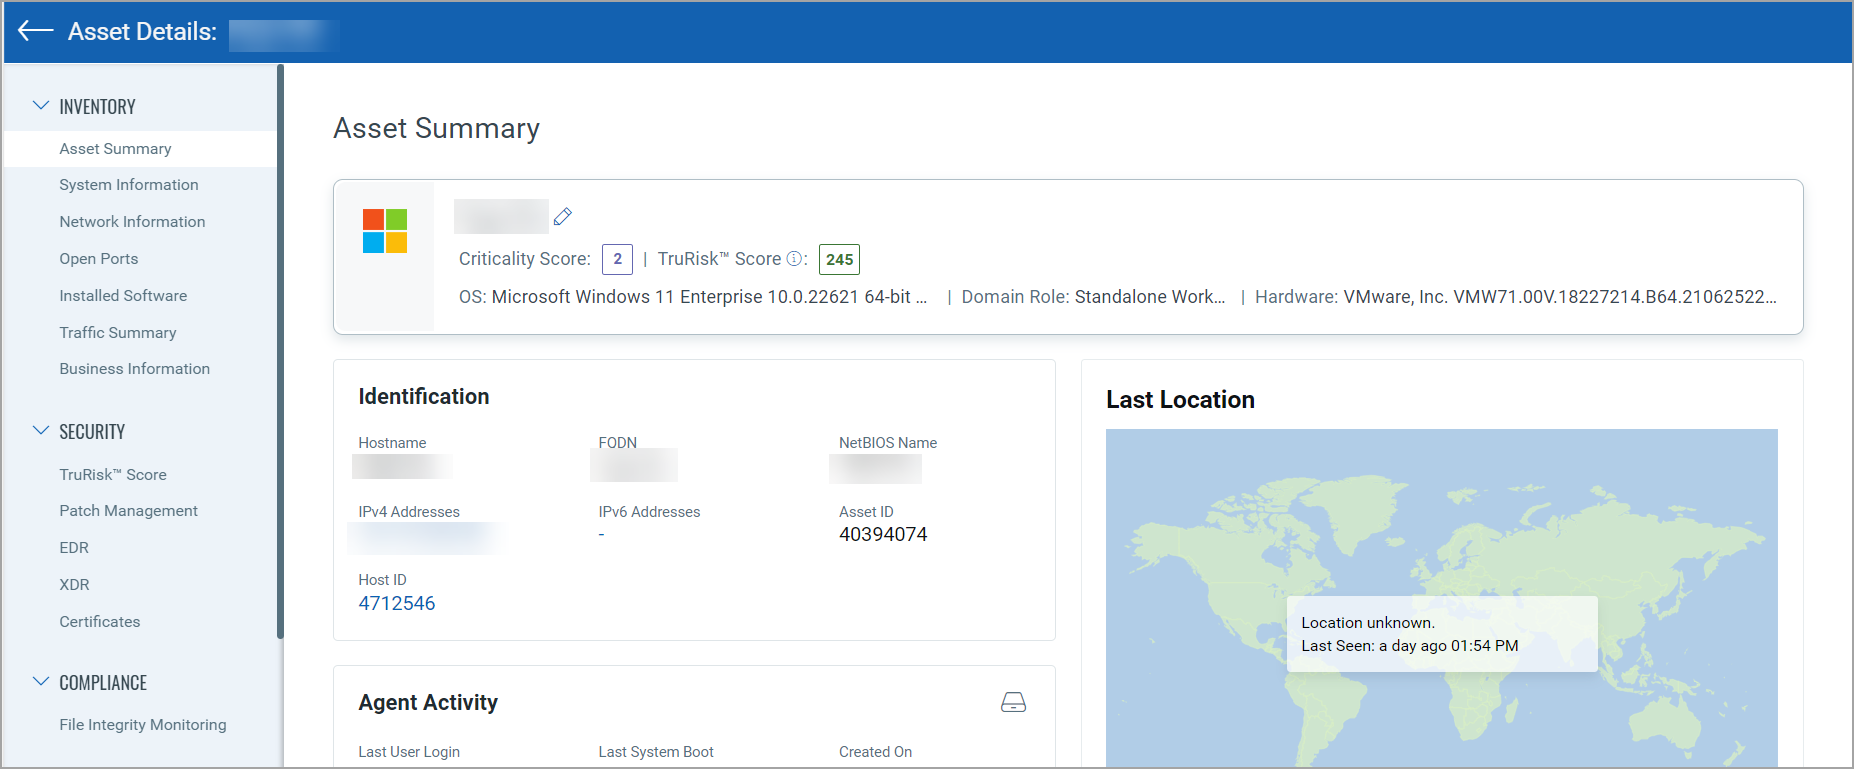
The View Details action in the Assets tab provides the asset details, which includes the asset summary, system and network information, open ports, criticality score, and much more. Perform the following steps to view the listed details available in View Details:
- From the Assets tab, hover the mouse on any of the assets to view the Quick Actions menu.
- Click View Details.
The following screenshot is the Asset Details Summary page that lists the information about the asset:
View Events
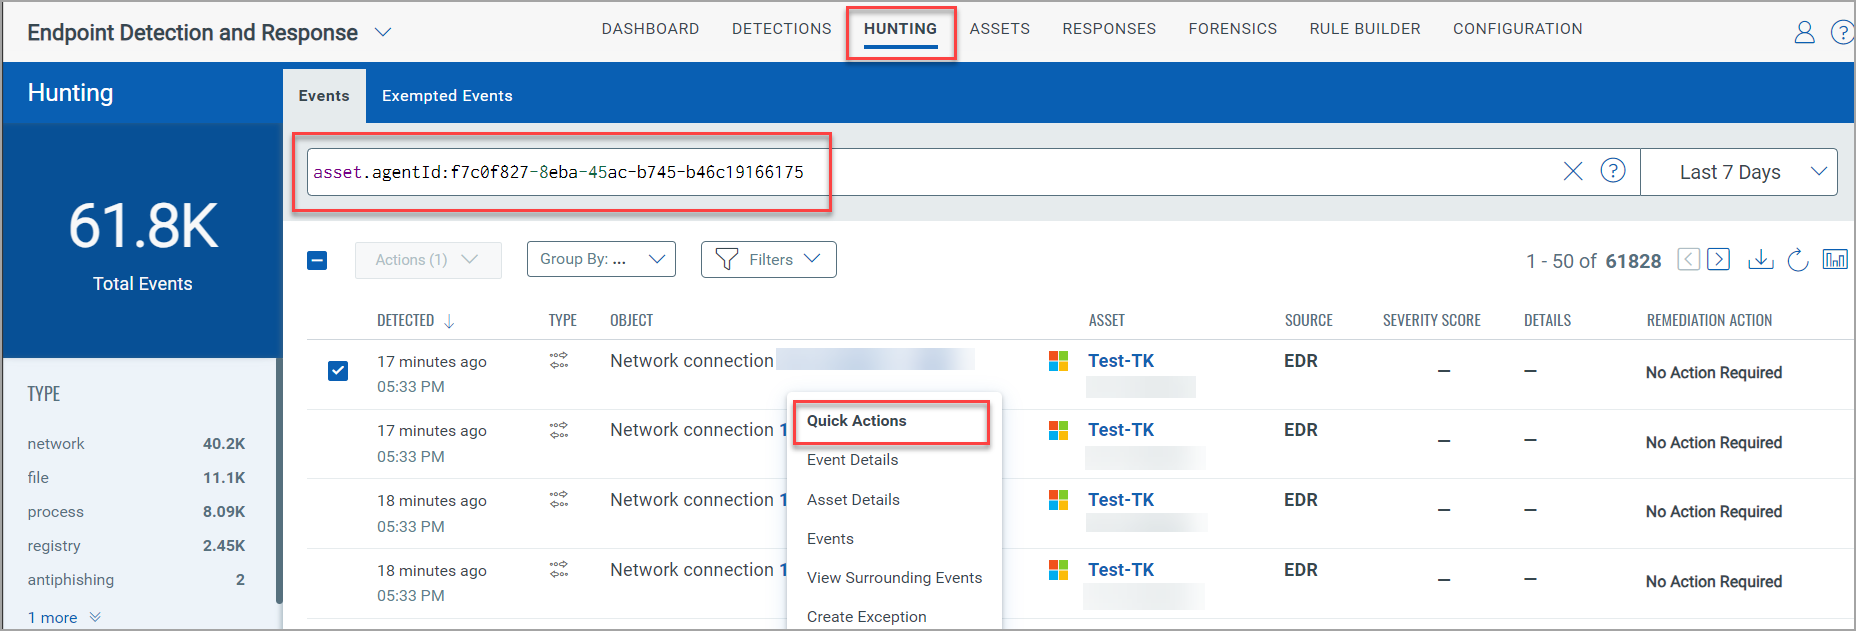
The View Events actions in the Assets tab provides the events list of the asset. Perform the following steps to view the listed details available in View Events:
- From the Assets tab, hover the mouse on any of the assets to view the Quick Actions menu.
- Select View Events. You are redirected to the Events page of the Hunting tab.
The Events page lists all the events registered and executed on the asset. The listing of events is based on the token asset.agentId. The following screenshot lists the events and the Quick Action menu:
View Incidents
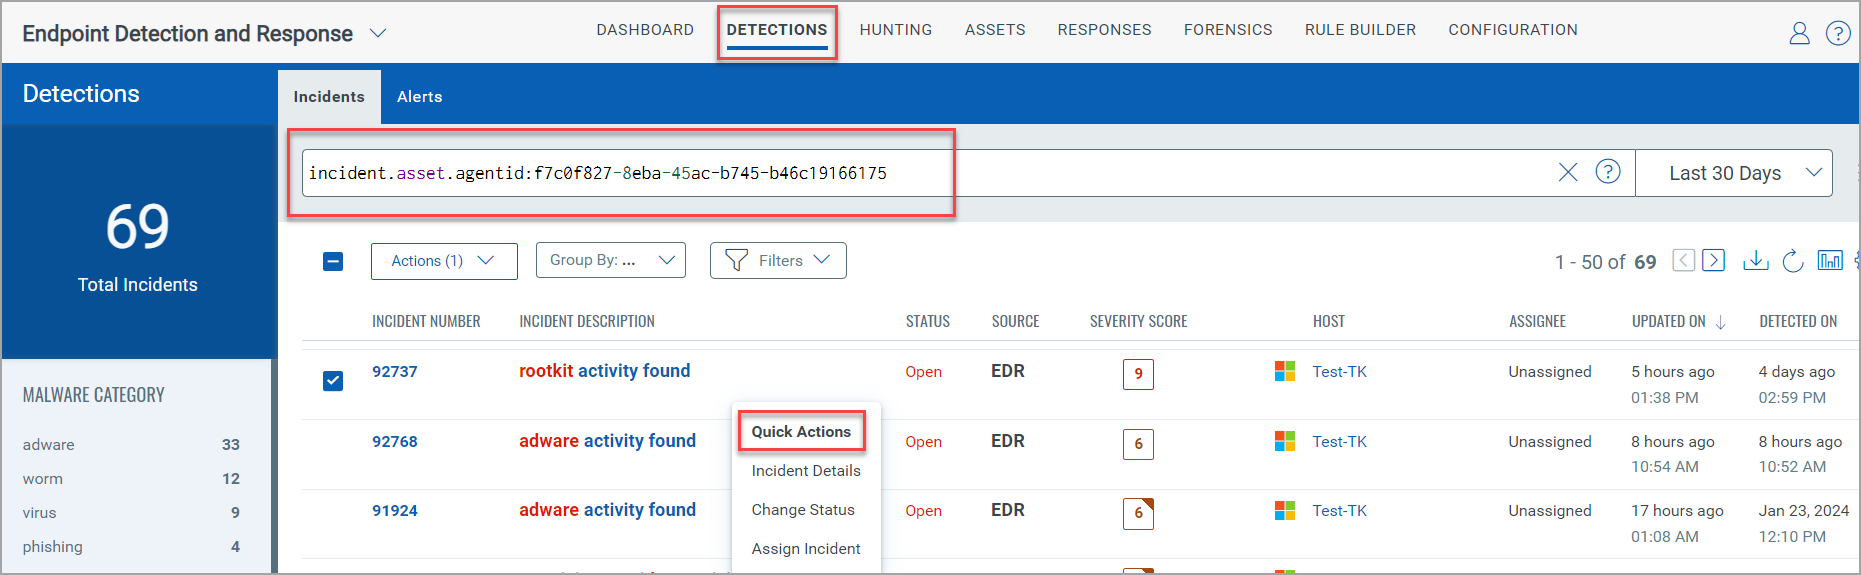
The View Incidents action in the Assets tab provides the incidents list of the asset. Perform the following steps to view the listed details available in View Incidents:
- From the Assets tab, hover the mouse on any of the assets to view the Quick Actions menu.
- Select View Incidents. You are redirected to the Incidents page of the Detection tab.
The Incidents page lists all the incidents detected on the asset. The listing of incidents is based on the token incident.asset.agentId. The following screenshot lists the incidents and the Quick Action menu:
Connect to Host
The Connect to host option in the Assets tab allows you to execute the Windows shell command on the selected endpoint for investigation purposes.
Prerequisites
- Windows Agent version 5.2.1 and above.
- Linux Agent version 6.3.0 and above.
- GAV agent version 5.3.0 and above.
User Role Permissions
- Kill Process
- Delete File Permission
By default, the file path in the remote shell executes in the C drive. Use the help command to view the list of supported commands. You can also use the help command and the supported command to view the syntax and description of the command. For example, to view the syntax and description of users command, use: help users.
Each user can establish only 10 connections at a time. Contact Qualys Support if you need more information for the connection request.
Accessing Connect to Host
Perform the following steps to access Connect to host option:
- In the Assets tab, hover the mouse on any of the assets to view the Quick Actions menu.
- Click Connect to host.
The command prompt takes a few minutes to establish the host connection. If the remote shell fails to connect after three consecutive attempts within the timeframe of 10 minutes, your access gets blocked for 10 minutes. In such a scenario, a message notifies that - Agent is not reachable. Please try after some time.
- Once the remote shell is connected, it lists the supported command. Type the command in the Enter command window and click Run to execute the command.
In the following screenshot, we used the users command as an example:
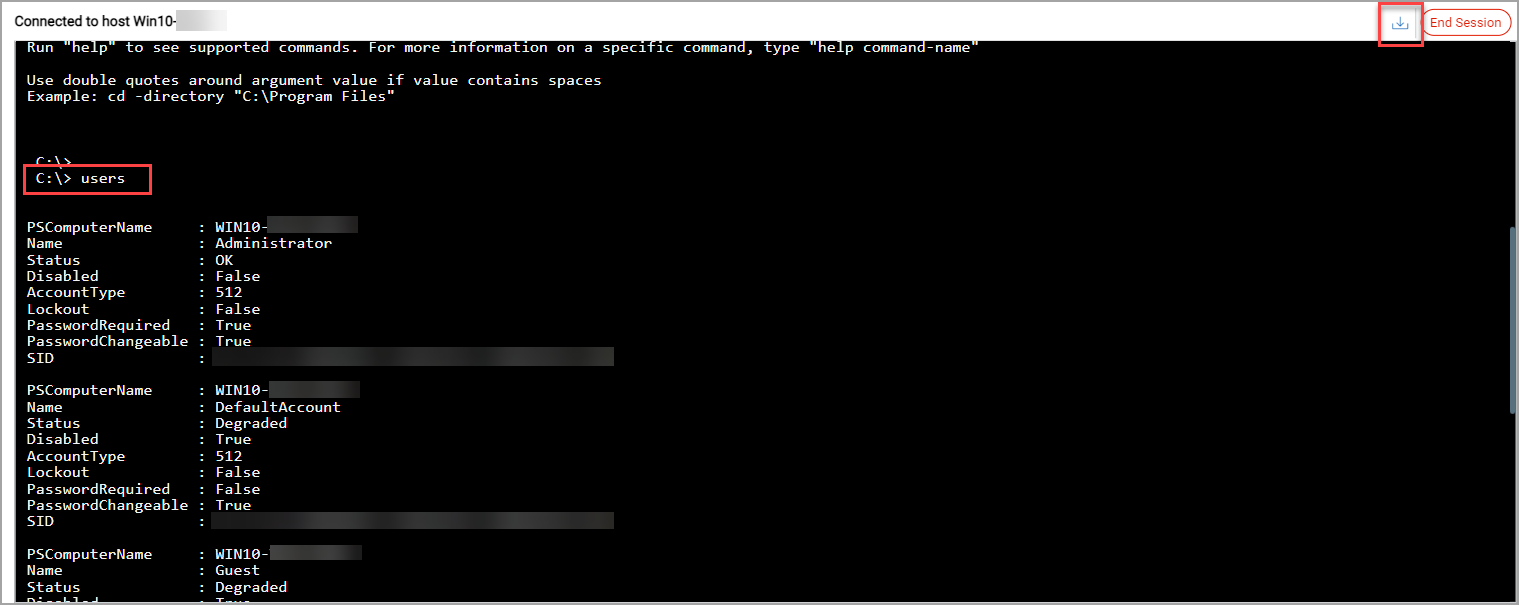
-
Click the download button
 in the shell prompt to download the logs.
 -
Click End Session to close the Remote shell window.
If there has been no activity for 5 minutes, a confirmation message is displayed. Click Yes, to stay connected.
Retry Failed Anti-Malware Installation
You can retry failed Antimalware Protection (EPP) installations. You can retry the anti-malware installation on individual assets or install it on multiple assets using the Actions drop-down menu.
This option is available:
- For Assets with the following Anti-Malware Status: TPRT Unsupported Product | TPRT Failed | Failed to Install | Competitor Software Block | Reboot Required | Disk Full
- On Windows Agent version 6.1.0 and later and is supported on assets where EPP installation has failed.
Perform the following steps to retry the anti-malware installation on selected assets:
- In the Assets tab, select the assets where to you want to retry the anti-malware installation. Ensure, the assets selected are those where EPP installations failed previously, as this option does not appear for other assets.
You can also useantimalware.status:`Failed to Install`QQL to filter such assets.

- In the Confirmation pop-up, click Yes to confirm you action.
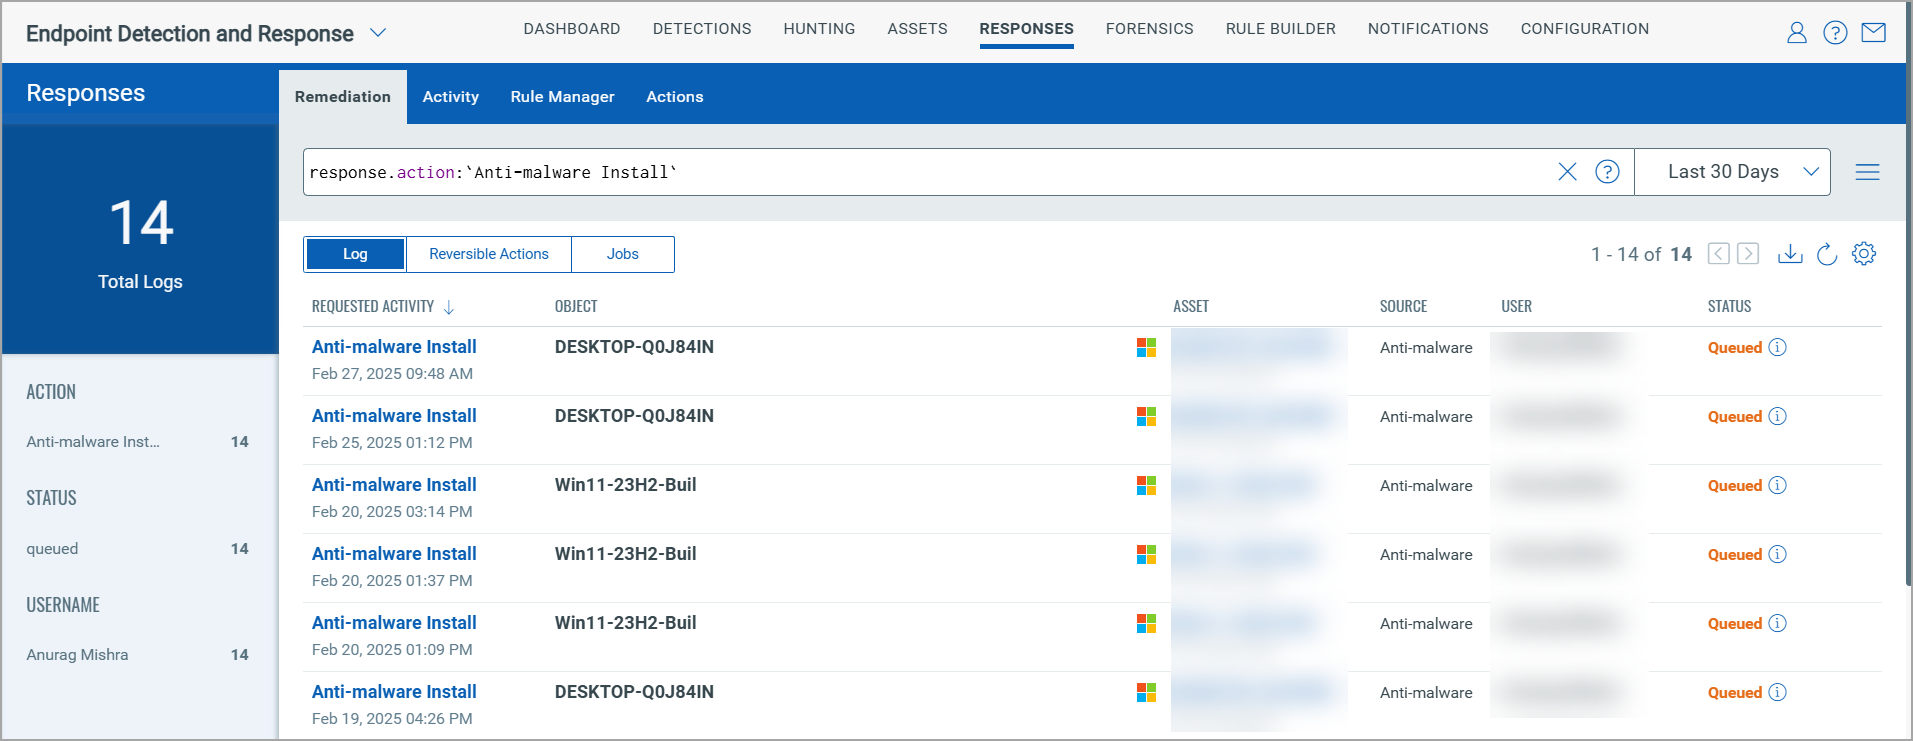
- Click View the Status message that appears on the success message on the top of the Asset page. You are redirected to Responses > Remediations tab.
- In the Search field type:
response.actionand select Anti-malware Install option. This option filters assets where an attempt was made to re-install Anti-malware.
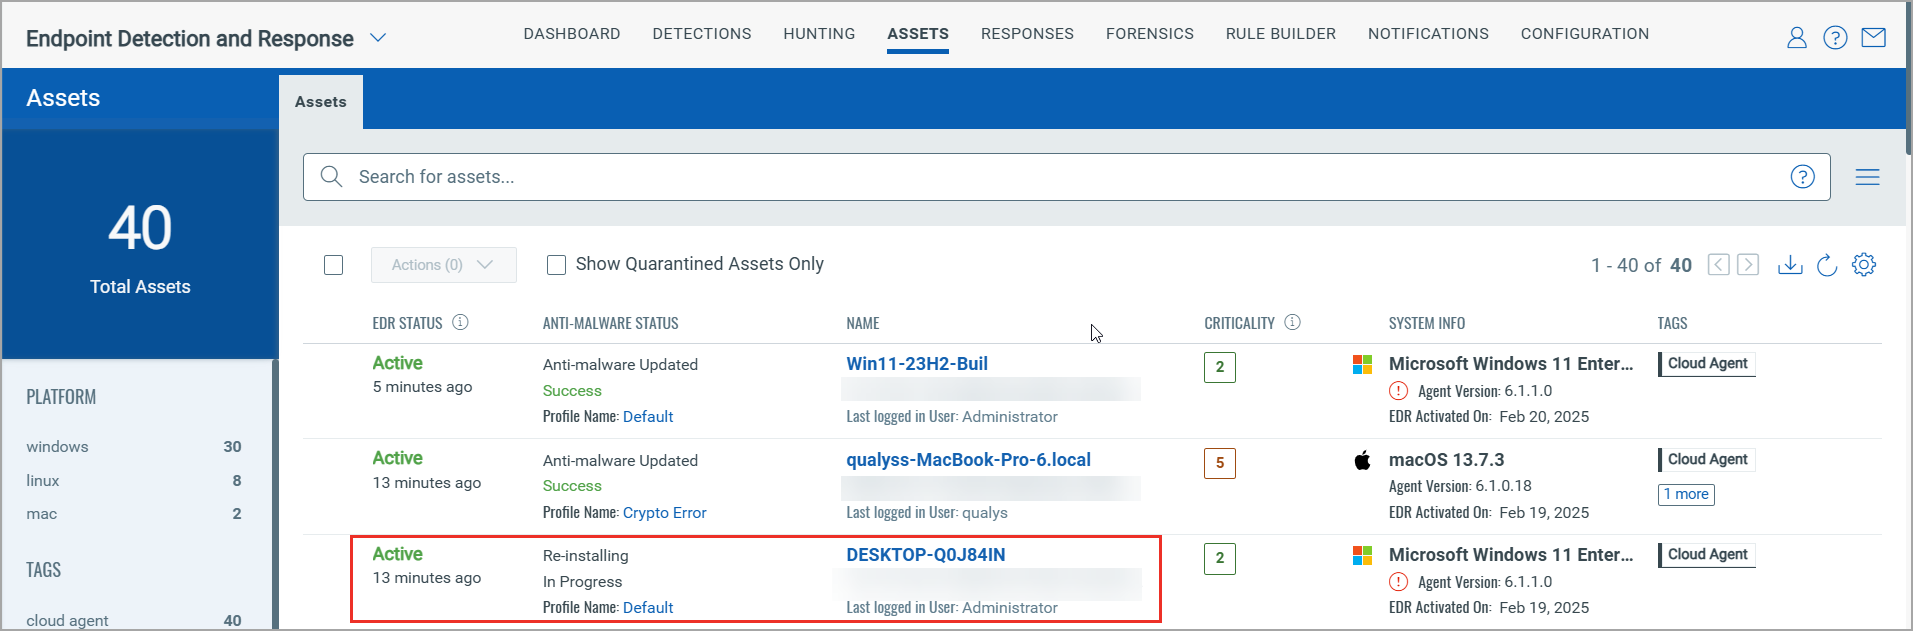
When the re-installation begins, the Anti-Malware status updates to 'Re-installing.' You can monitor the progress in the Anti-Malware Status column.
Scan Now
Scan Now is a real-time scanning feature that provides immediate endpoint assessment capabilities. It allows security teams to initiate instant scans during incident response, thereby helping to reduce the time required for threat detection and containment.
This option works only on Windows Agent 6.1.0 and later. Scan Now option is disabled (greyed out) for agents below the minimum version.
How to initiate this scan
Perform the following steps to initiate this scan:
- Go to the Assets tab.
- In the Asset Details list, hover over the desired asset.
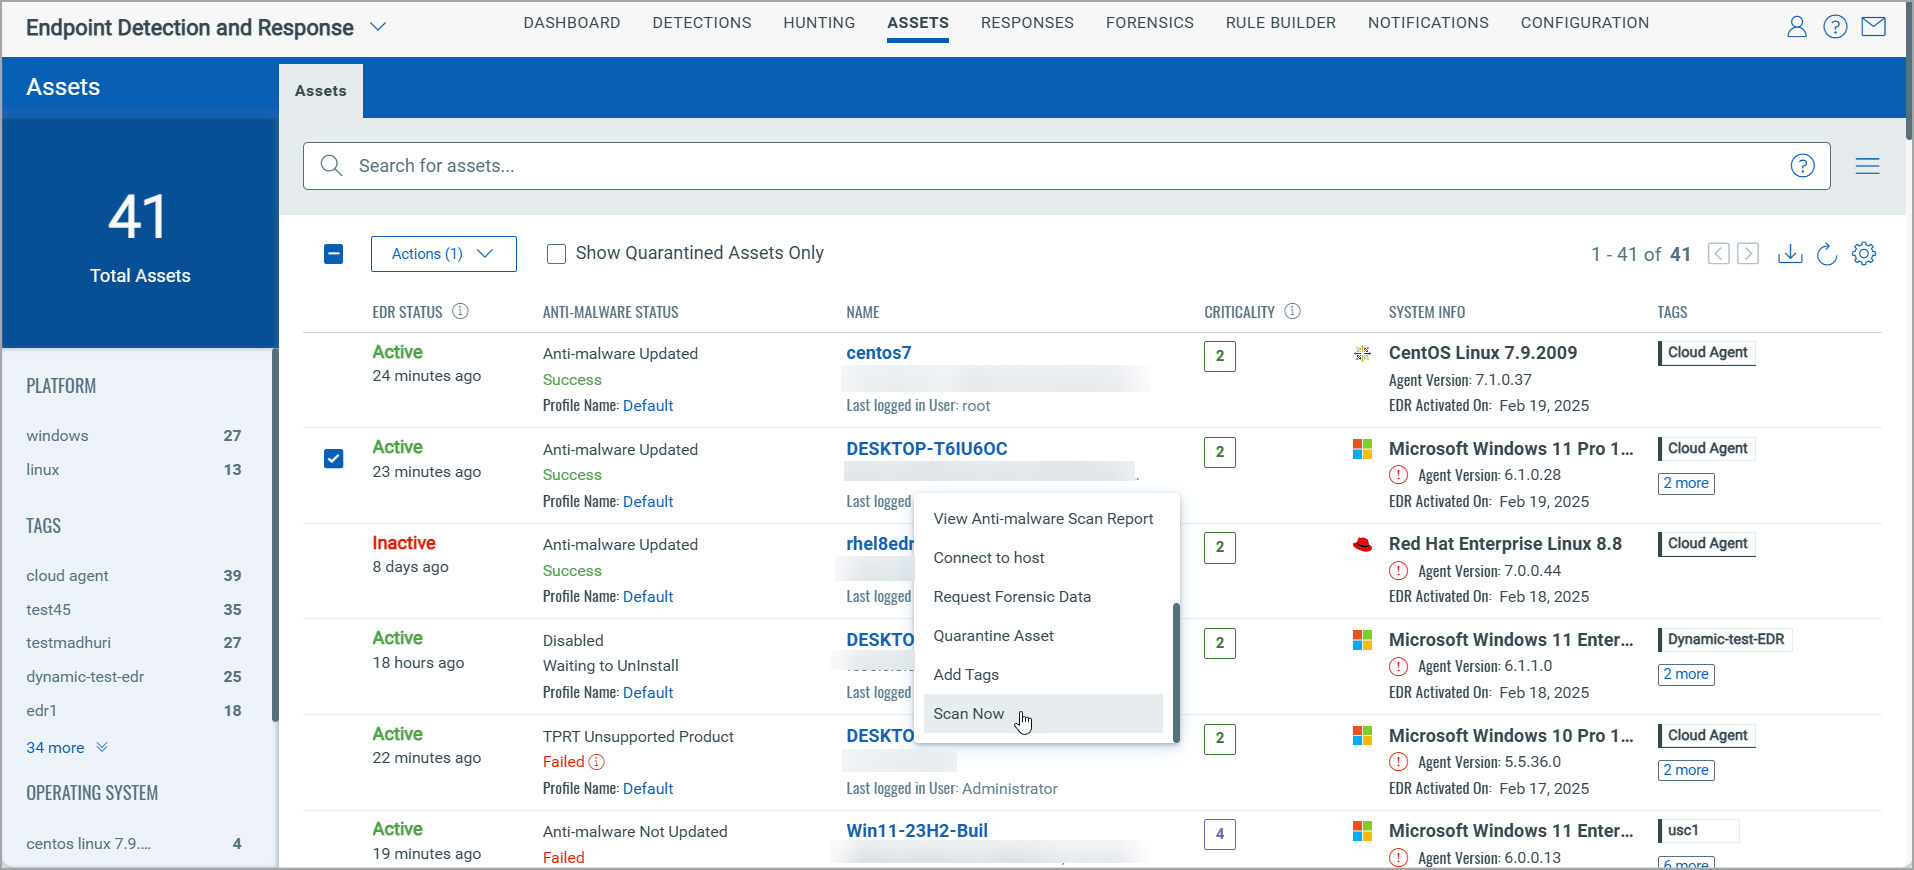
- In the Quick Actions menu, scroll to the bottom of the list and click Scan Now. You can also scan on multiple assets using the Actions drop-down menu.
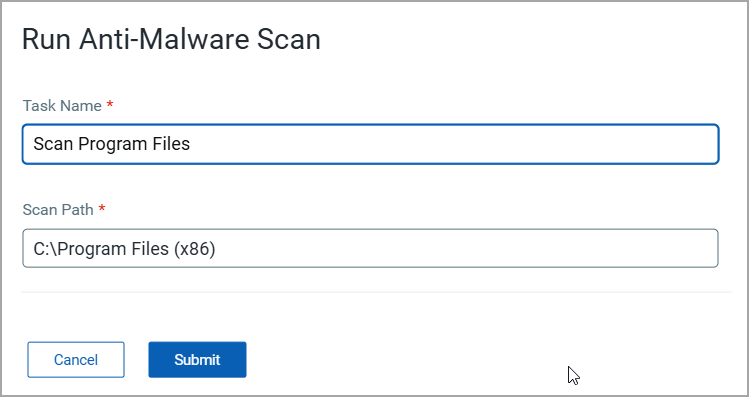
- In the Run Anti-Malware Scan window, provide the task name and scan path and then click Submit.
Check Scan Now Report Status
You can view the status of this scan in the View Anti-malware Scan Report window.
Perform the following steps to view this report:
- Hover over the desired asset to display the Quick Actions menu.
- In the Quick Actions drop-down, click View Anti-malware Scan Report.
Request Forensic Data For Windows Assets
The Request Forensic Data feature allows you to perform forensic analysis of an incident and perform the necessary response action.
Prerequisites
- Windows Agent version 5.2.1 and above.
- GAV agent version 5.3.0 and above.
At a time you can send 10 request to generate forensic data.
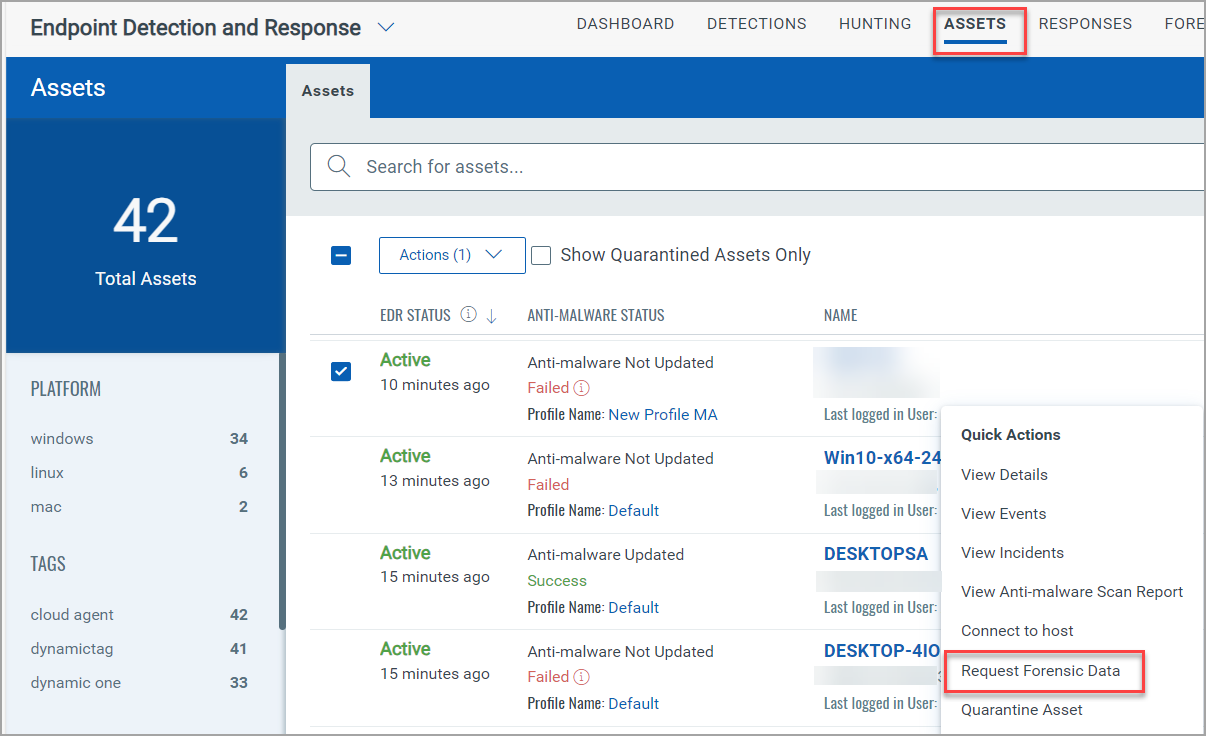
Request Forensic Data from the Assets tab
To request Forensic Data for a specific asset, perform the following steps on the Assets tab:
-
Hover the mouse on the required event and click the drop-down icon

-
From the Quick Actions menu, click Request Forensic Data. A notification message confirms the request has been submitted.
-
Click the Forensics tab to monitor the asset's requested forensic data status.
Once the request is complete, the Status column displays the result as Success. You can Download, View Asset Details, or Delete the instances from the Quick Actions menu of the Status column in the Forensics tab.
The data is downloaded for all successful data requests in a .7z folder on your local system. The downloaded file consists of the output files of each script that ran on the Agent. For more information about the scripts executed on the Agent, see Scripts Executed for Forensics.
Request Forensic Data from the Forensics tab
To request Forensic Data for a specific asset, perform the following steps on the Forensics tab:
- Click Request Forensic Data.
- Select the asset for which you want the forensic data, in the Request Forensic Data page.
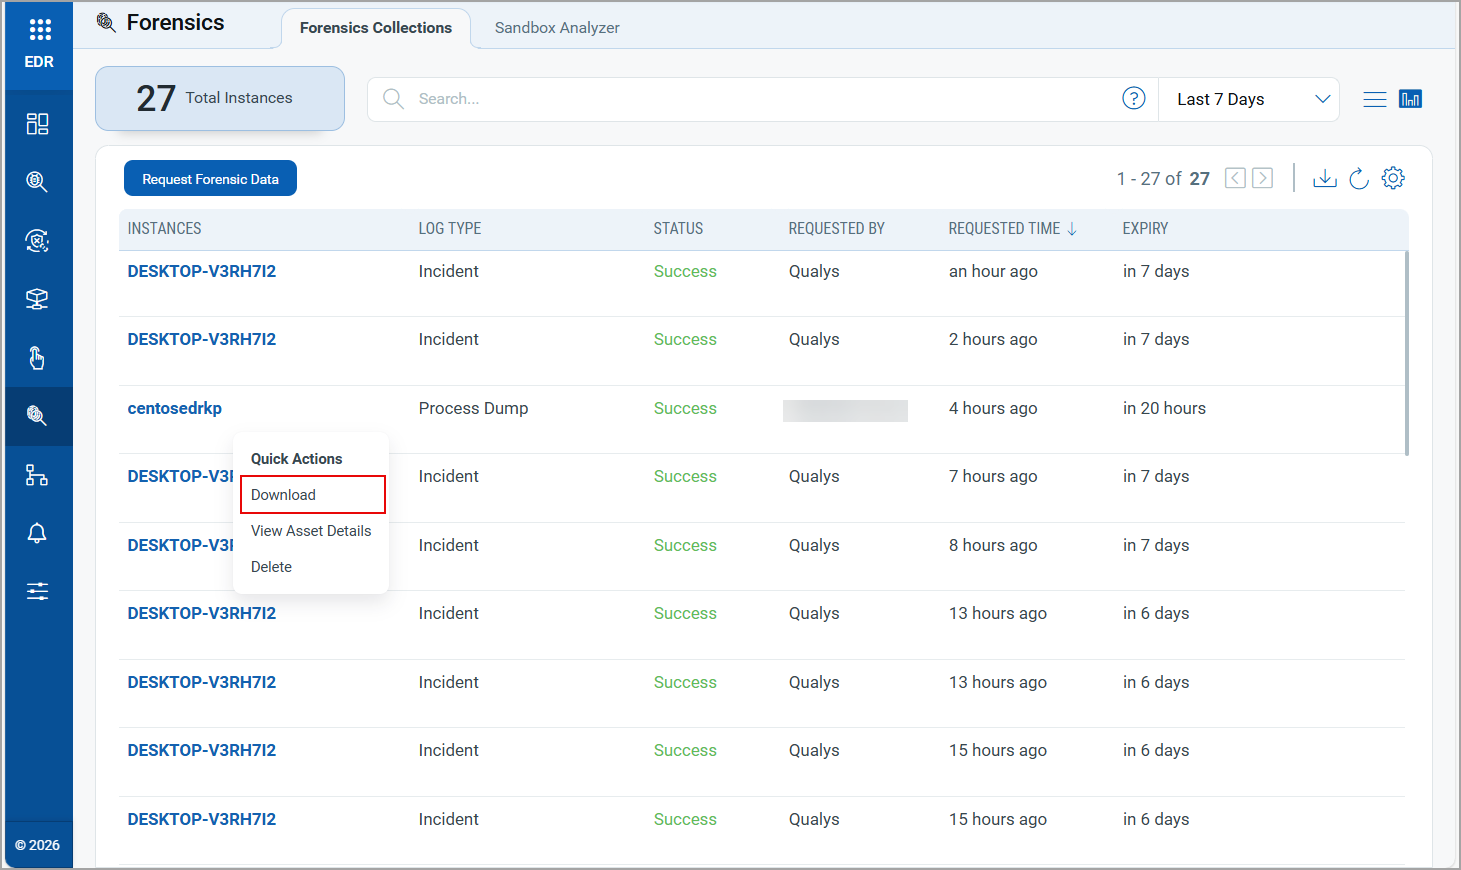
Once the request is complete, the Status column displays the result as Success. From the Quick Actions menu you can perform the actions Download, View Asset Details, Delete, or View Incident Detailsthe instances from the Quick Actions menu of the Status column in the Forensics tab.
Request Forensics Data from Linux Assets
The Request Forensics Data feature has capabilities to collect the forensic data from the Linux assets as well. This feature allows you to conduct deeper investigations of Linux systems by gathering detailed system-level and process‑level forensic data.
Pre-requisites
- Linux Agent 7.4.0 and above.
- The supported forensic types are:
- System Forensics: Collects comprehensive system-level information from the Linux asset.
- Process Dump: Collects process-level information from the Linux asset.
To request the forensic data for a Linux asset, perform the following steps:
- Navigate to Forensics > Forensics Collection > Request Forensic Data. Or hover to any asset, click the Quick Actions menu, and select Request Forensic Data.
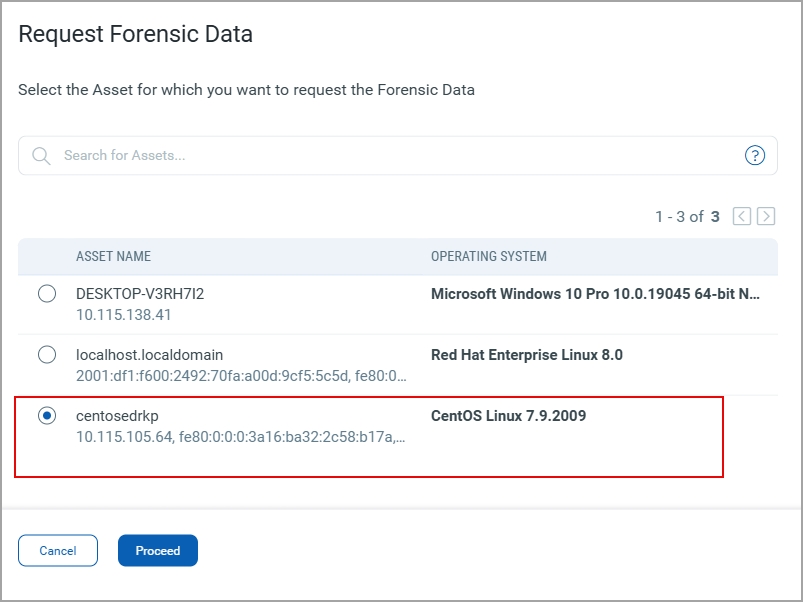
- In the Request Forensic Data window, select the required Linux asset for which you want the forensic data, and click Proceed.
-
In the Request Forensic Data, choose the data collection type- System Forensics or Process Dump.
If you select, Process Dump, select any one of the following options:- Select Active Process on the Host- Use this option to select the processes that are running actively on the host.
- Enter Process Details Manually- Select this option if you have the process name and Process ID available.
The process list excludes the Qualys Agent processes.
- Click Request. The forensic request shows the status as In Progress.
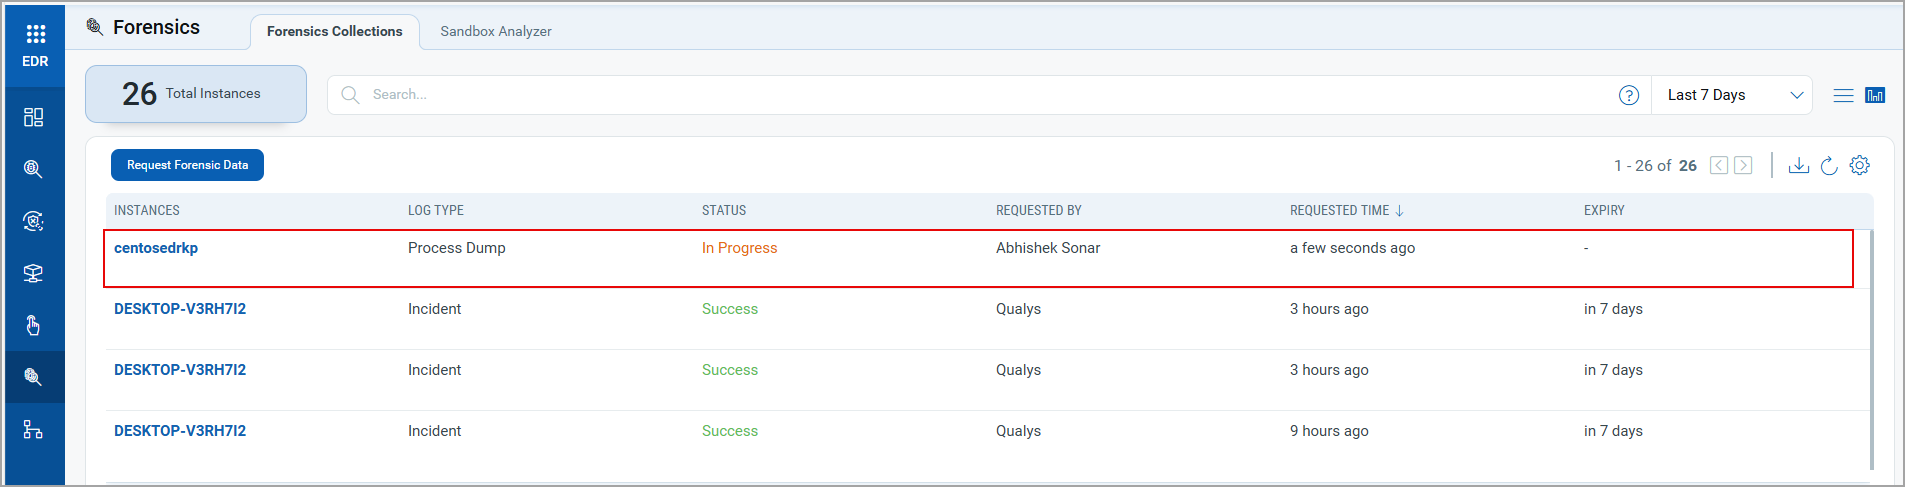
Once the request is uploaded by Agents, the status changes to Success. If there is no response from the Agent, then the status changes to Agent Timeout. - To download the successful request, select the Quick Actions menu, and click Download.
The data for all successful data requests is downloaded to a .7z folder on your local system.
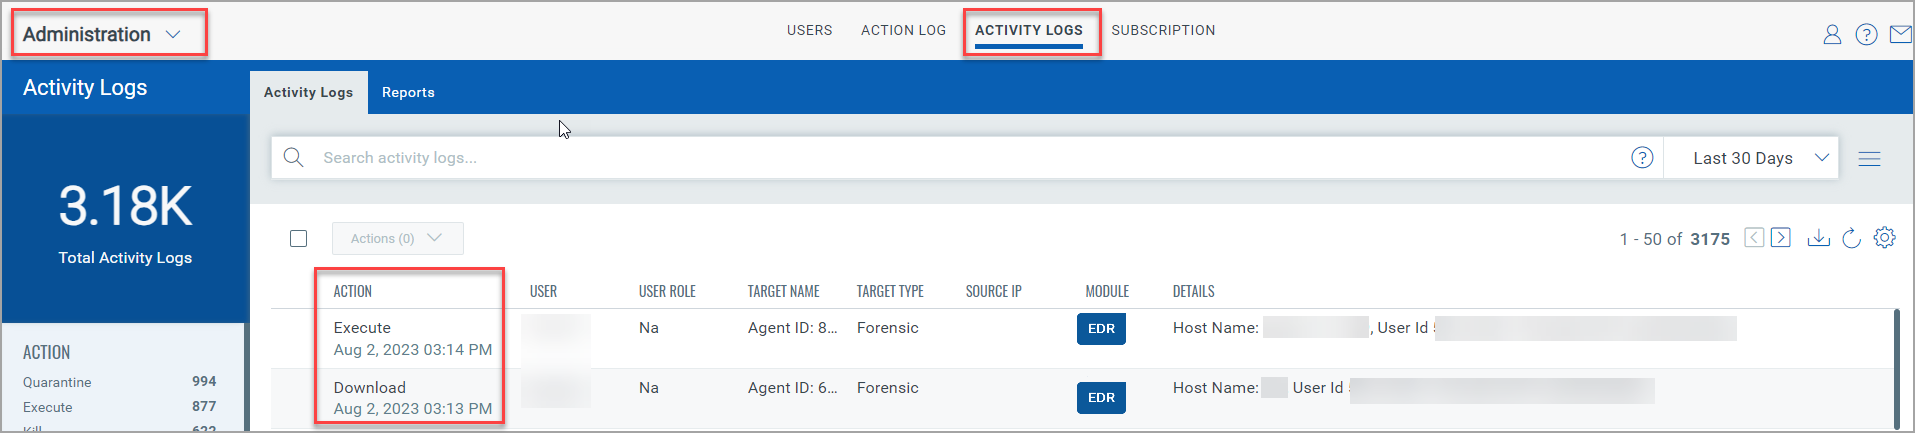
Auditing Forensic Logs from the Administration Application
Any actions performed on the Forensics tab, can be monitored from the Administration application. The following screenshot is an example of the Activity Logs that lists the action performed in the Forensics tab:
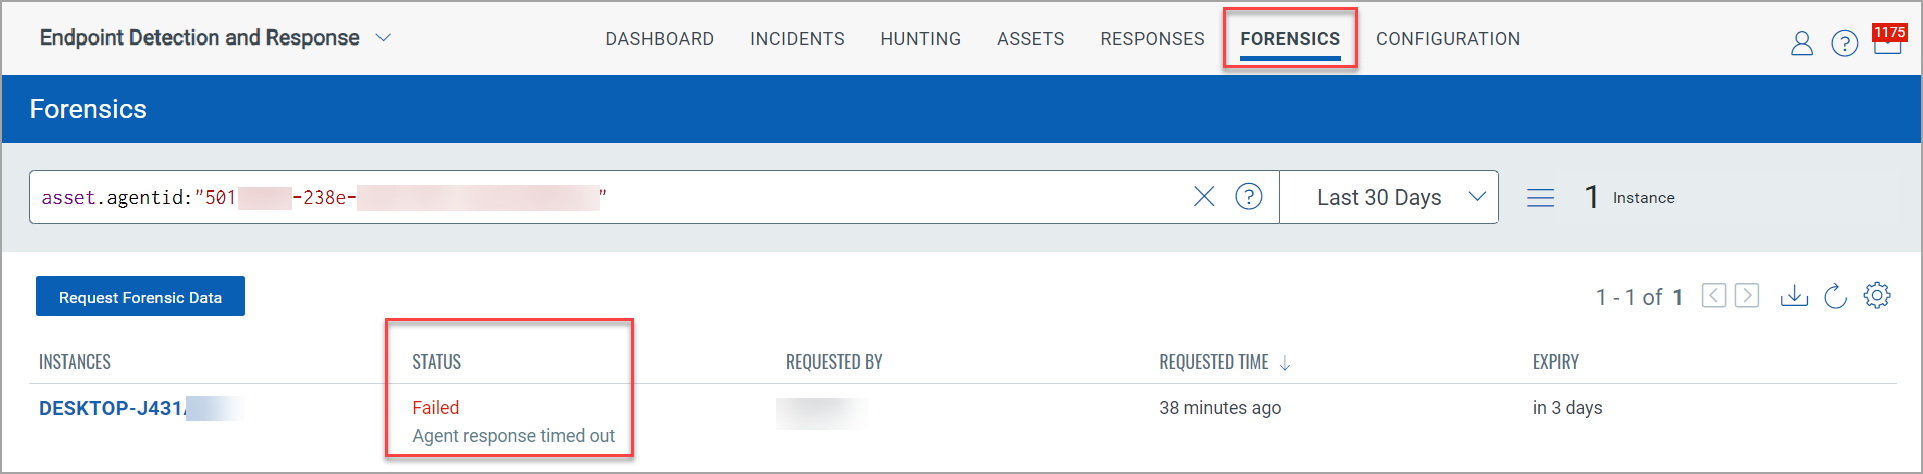
Agent Response Time Out Status
If a Forensic Request has been running (in progress status) for more than 15 minutes, the Status column displays the instance as Failed, Agent Response Timed Out. In such a scenario, you need to request the forensic data again. Meanwhile, if there is any response update for the earlier failed request, the status gets updated.
The following screenshot is an example that shows the Failed instance:
Quarantine an Asset
In case of any malicious event, the Quarantine Asset feature restricts the infected host machine from performing any network communication. You can quarantine an asset if its
- Windows Agent version is 4.9.0 and above.
- Linux Agent version is 6.0.0 and above.
You can Quarantine an Asset from the Incidents or Asset tab.
Quarantine an Asset from the Incidents tab
To quarantine an asset based on the incident description, perform the following steps:
- Click the Incident description that you want to quarantine.
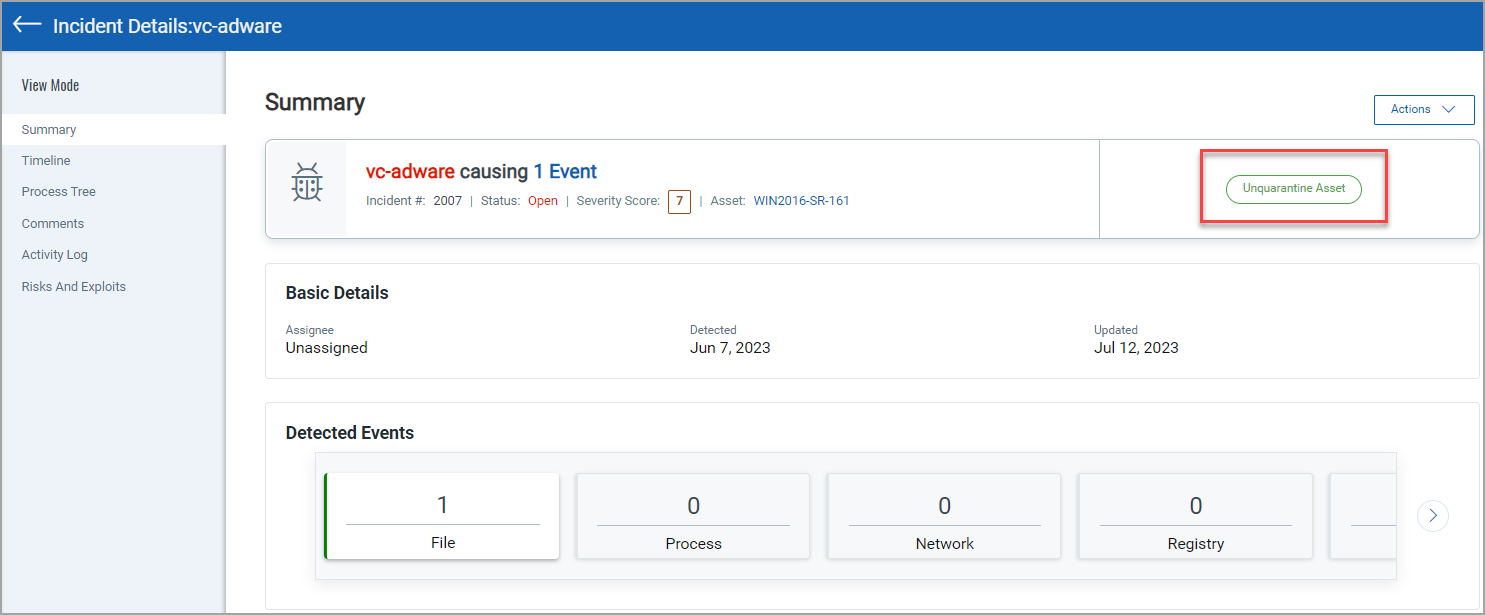
- In the Summary section, click Quarantine Asset.
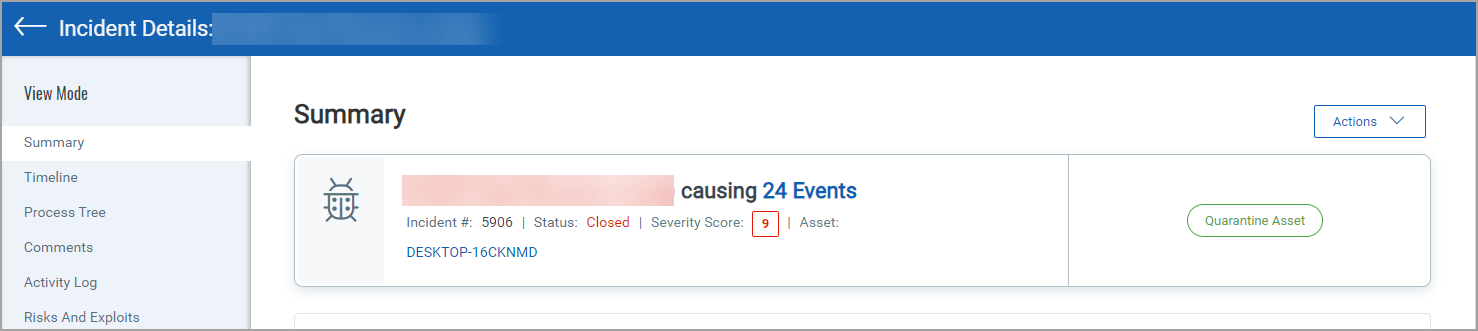
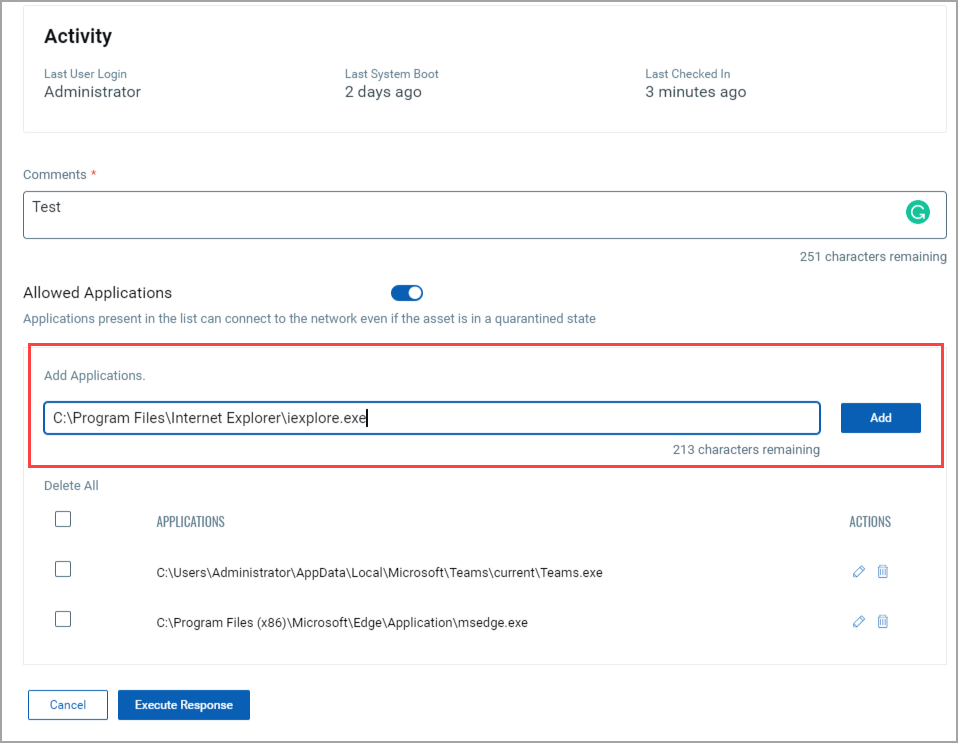
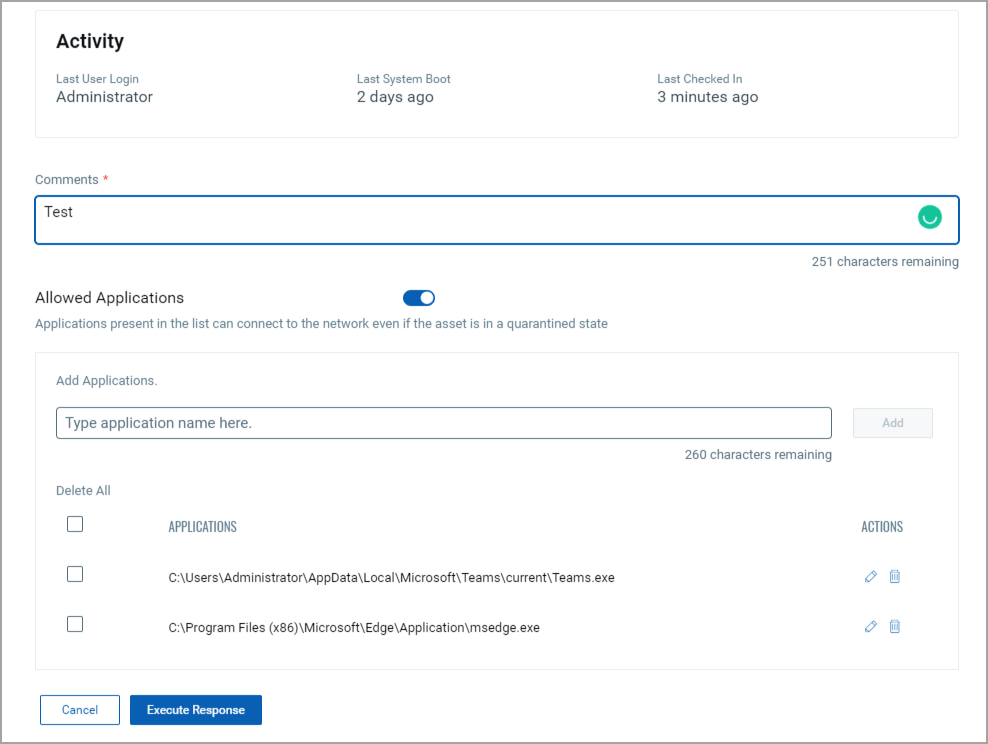
- In the Quarantine Asset window, add your comments. Optionally, you can toggle Allowed Applications and add the application path you prefer to be accessible while quarantining the asset. Applications listed in the Quarantine Asset Configuration will be applicable in the Allowed Applications, if this toggle is enabled.
- To add an application, enter a valid application path in the space provided and click Add.
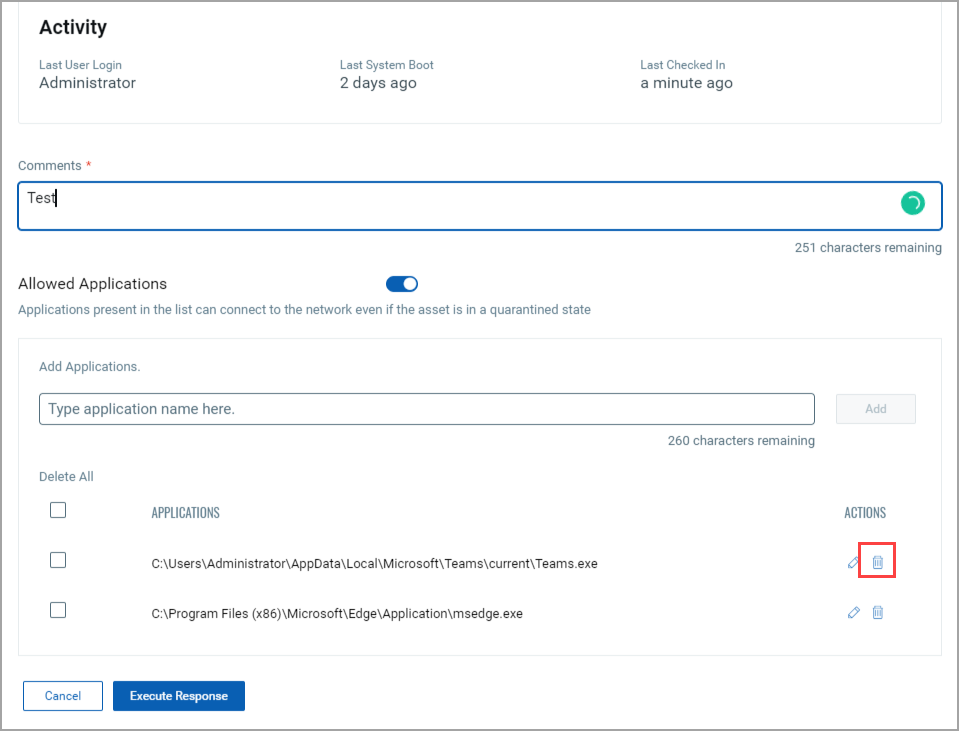
- To remove an application, click the delete icon against the application path.
- Click Quarantine Asset.
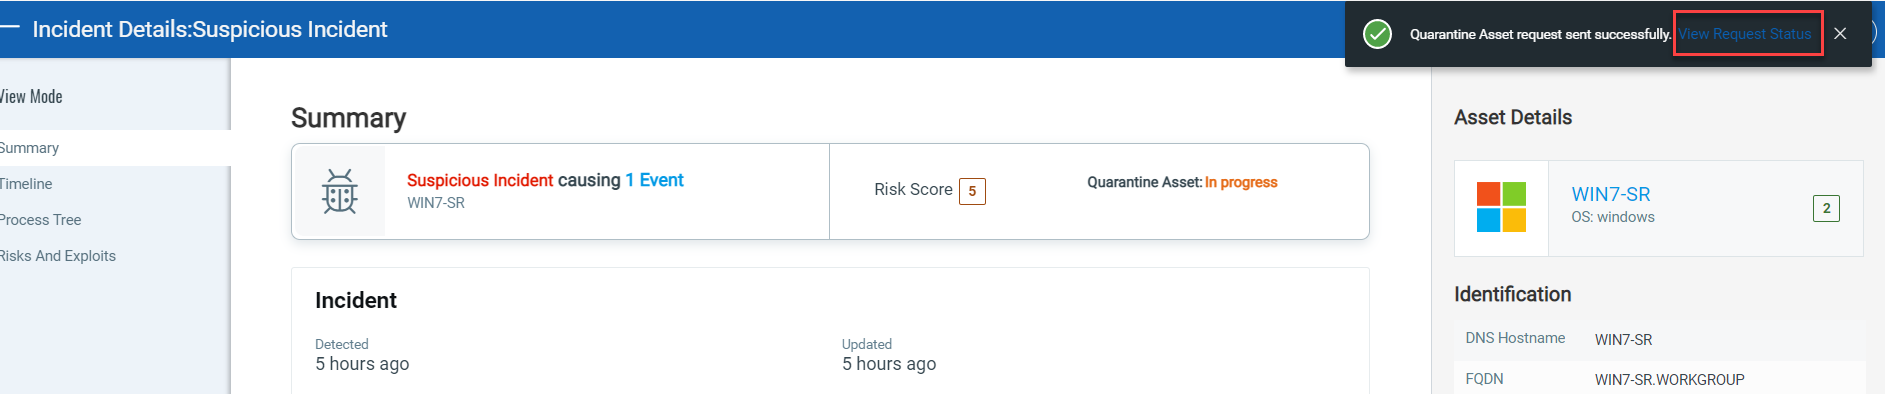
A notification Quarantine Asset request sent successfully. View Request Status is generated.
- Click the View Request Status to follow the asset quarantine status.
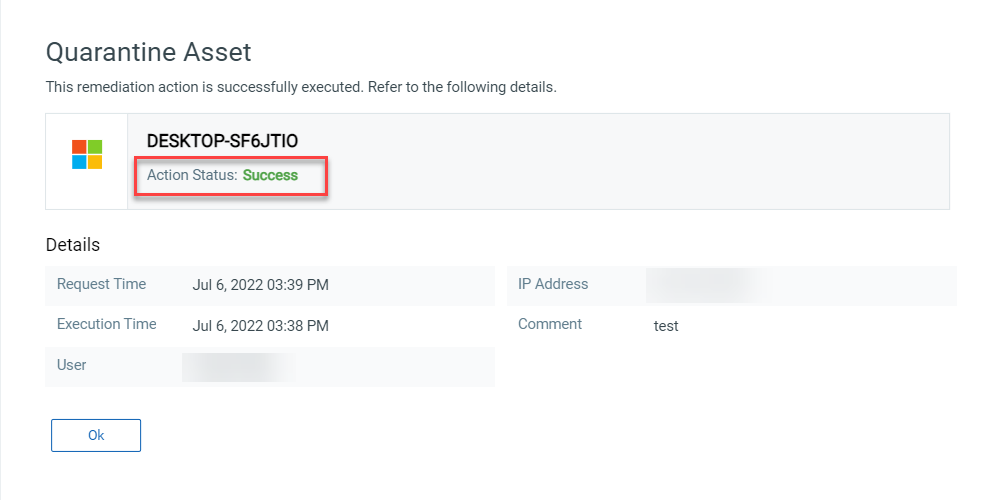
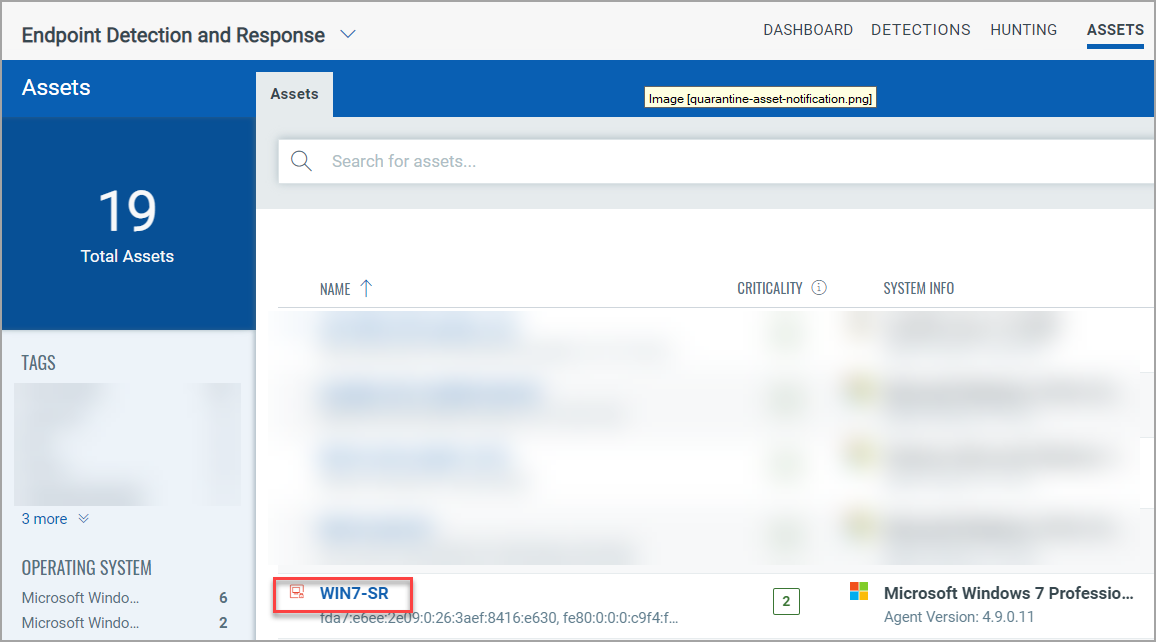
Once the asset is successfully quarantined the following status is displayed:
Quarantine an Asset from the Assets tab
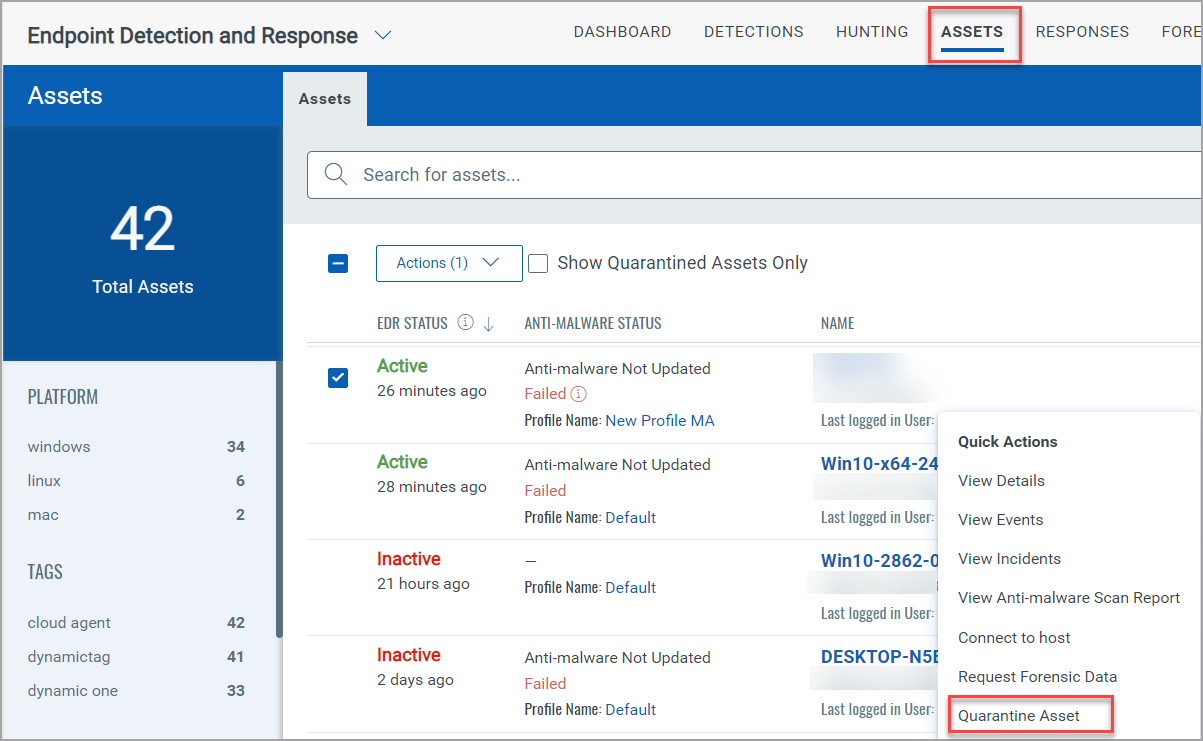
To quarantine an asset from the Assets tab, perform the following steps:
- In the Assets tab, select the Asset that you want to quarantine. The Agent version should be 4.9.0 and above.
- From the Quick Actions menu, click Quarantine Asset.
- In the Quarantine Asset window, add your comments. Optionally, you can toggle Allowed Applications and add the application path you prefer to be accessible while quarantining the asset. Applications listed in the Quarantine Asset will be applicable in the Allowed Applications, if this toggle is enabled.
- To add an application, enter a valid application path in the space provided and click Add.
- To remove an application, click the delete icon against the application path.
- Click Quarantine Asset.
A notification Quarantine Asset request sent successfully. View Request Status is generated.
- Click the View Request Status to follow the asset quarantine status.
A quarantined asset will have the ![]() icon displayed.
icon displayed.
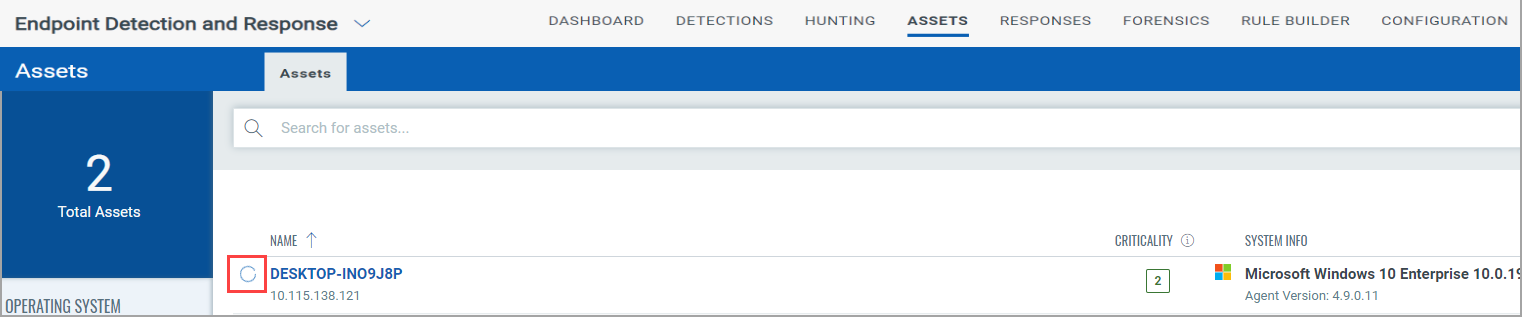
The ![]() icon signifies the asset is in progress state.
icon signifies the asset is in progress state.
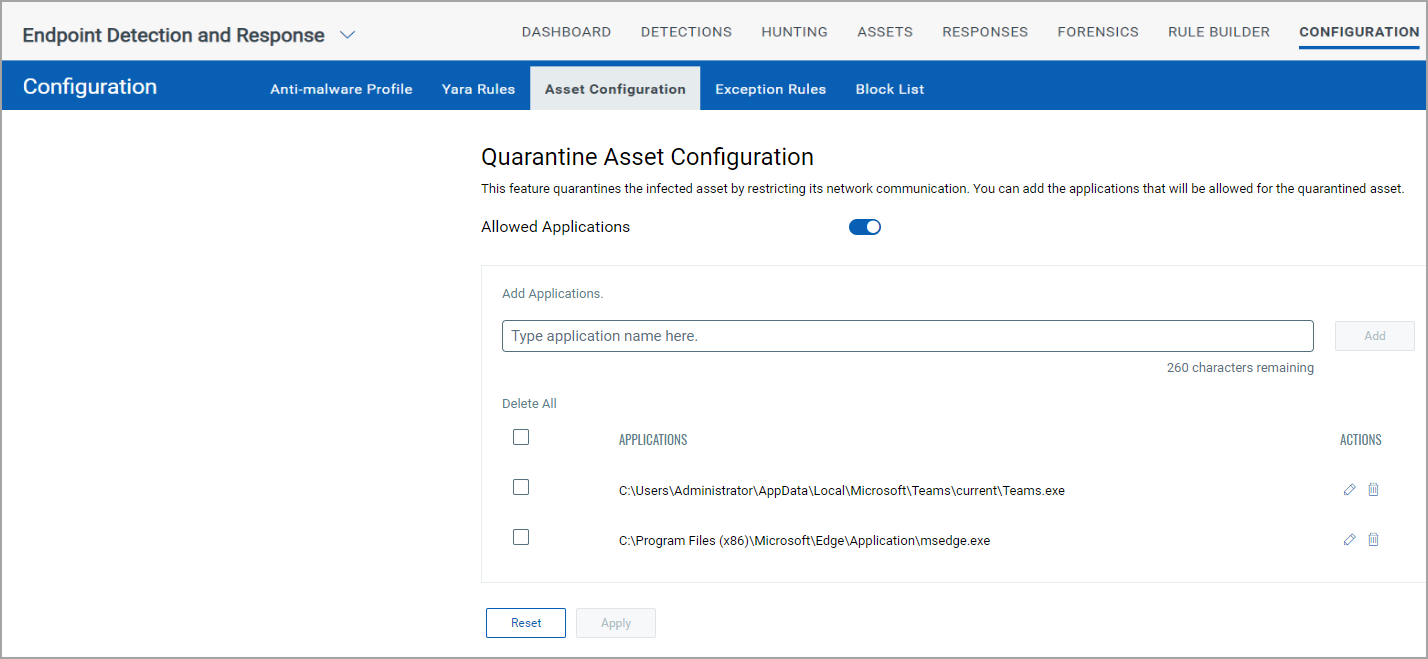
Quarantine Asset Configuration from the Configuration tab
From the Configurations tab, you can add the applications that will be allowed while the asset is quarantined.
Perform the following steps to add applications for the Quarantined asset:
- In the Configuration tab, select Asset Configuration.
- Toggle Allowed Applications.
- In the Add Applications field, provide the complete path of the application. You can provide environmental variables in the field. Wild cards inputs are not supported.
-
Add the following paths to allow the Qualys Endpoint Protection :
C:\Program Files\Qualys\QualysEPP\EPUpdateService.exe
C:\Program Files\Qualys\QualysEPP\downloader.exe
C:\Program Files\Qualys\QualysEPP\EPSecurityService.exe
C:\ProgramFiles\Qualys\QualysEPP\ephost.integrity.legacy.exe
C:\Program Files\Qualys\QualysEPP\EPConsole.exe
C:\ProgramFiles\Qualys\QualysEPP\EPIntegrationService.exe
C:\ProgramFiles\Qualys\QualysEPP\EPProtectedService.exeC:\Program Files\Qualys\QualysEPP\bdredline.exe - Click Apply.
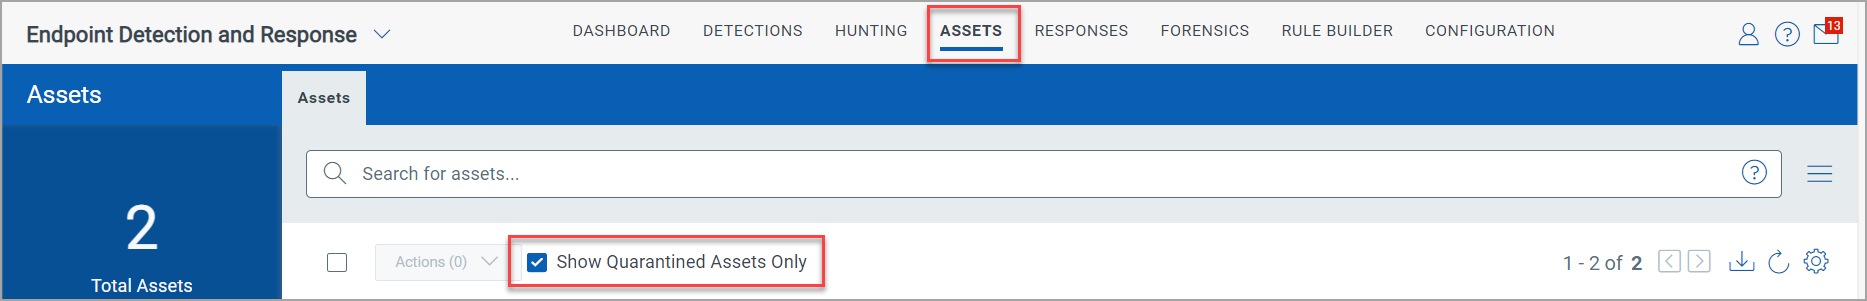
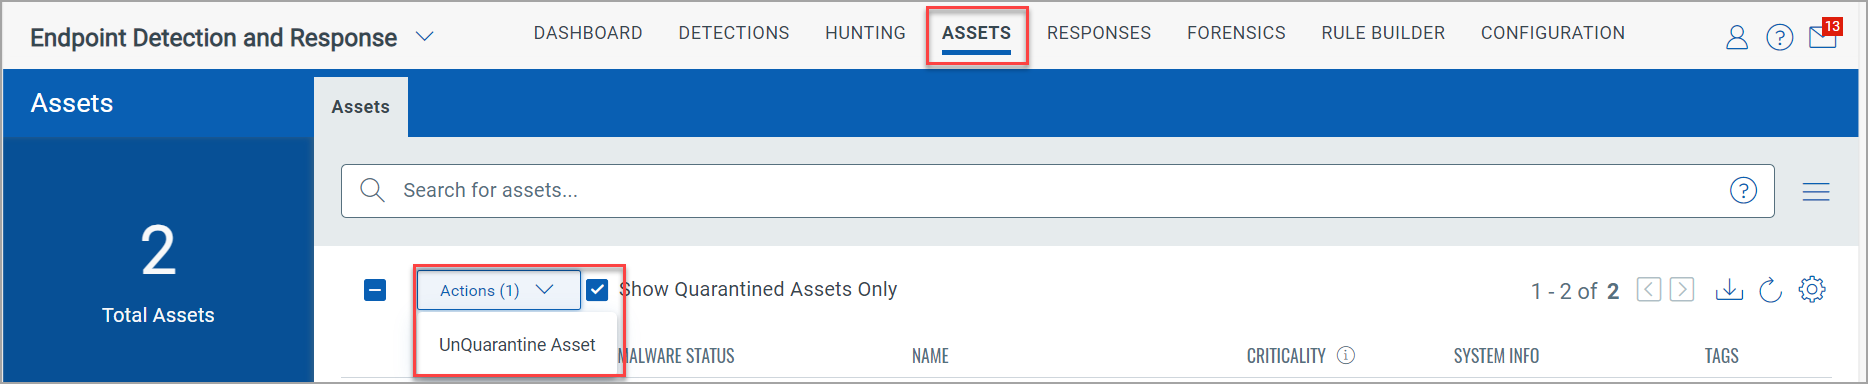
Show Quarantined Assets Only
- To view the list of the Quarantined Assets from the Assets tab, select the Show Quarantined Assets Only checkbox. The following screenshot is an example of the option that lists the quarantined assets:
Unquarantine an Asset from the Assets tab
To unquarantine an asset, perform the following steps:
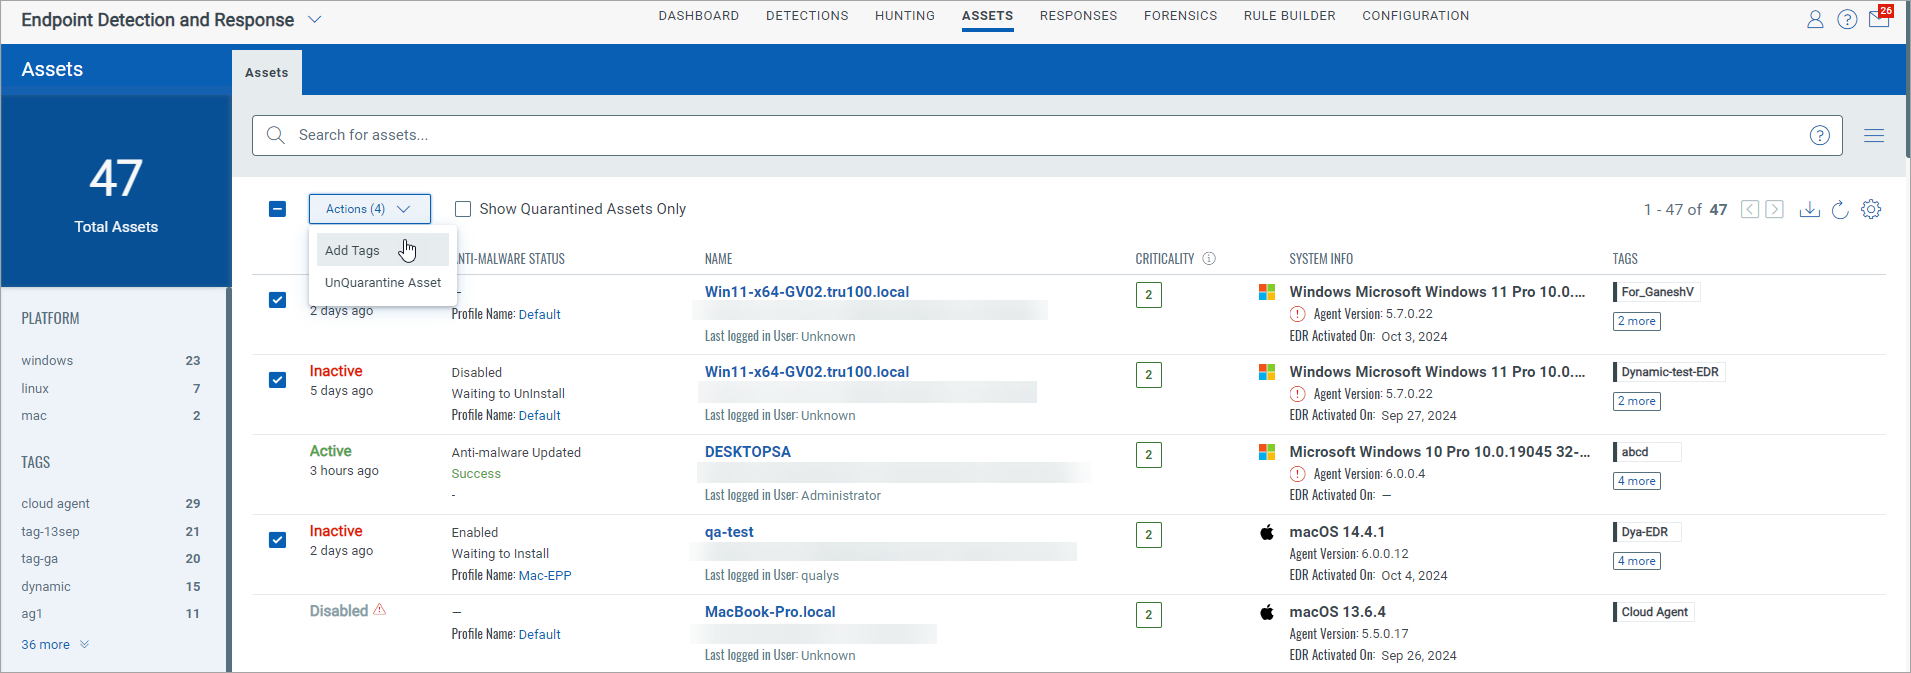
- In the Assets tab, select the quarantined asset. From the Actions drop-down menu, select Unquarantine Asset.
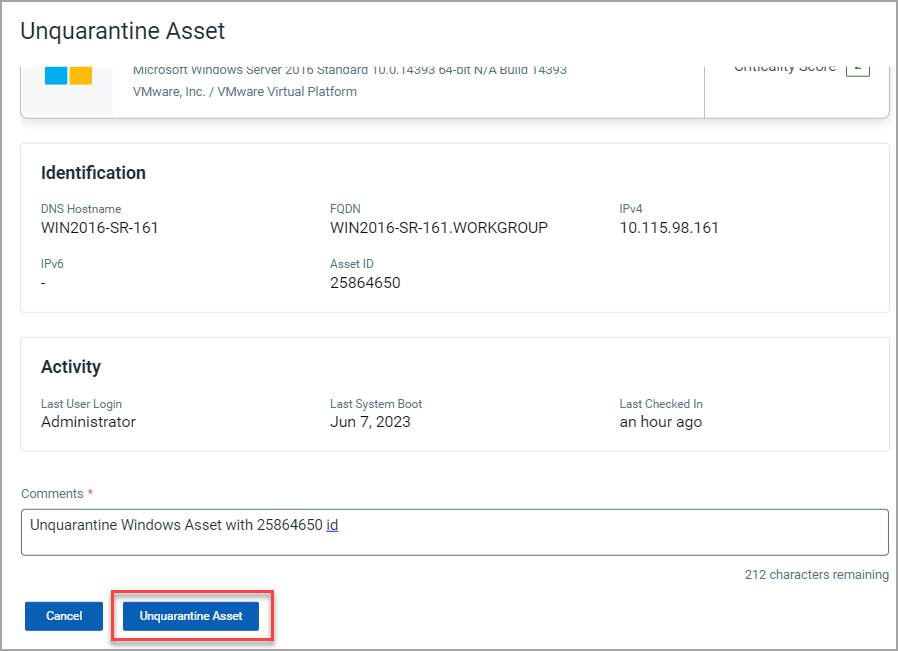
- In the Unquarantine Asset window, add your comments.
- Click Unquarantine Asset.
A notification Unquarantine Asset request sent successfully. View Request Status is generated.
- Click the View Request Status to follow the asset status.
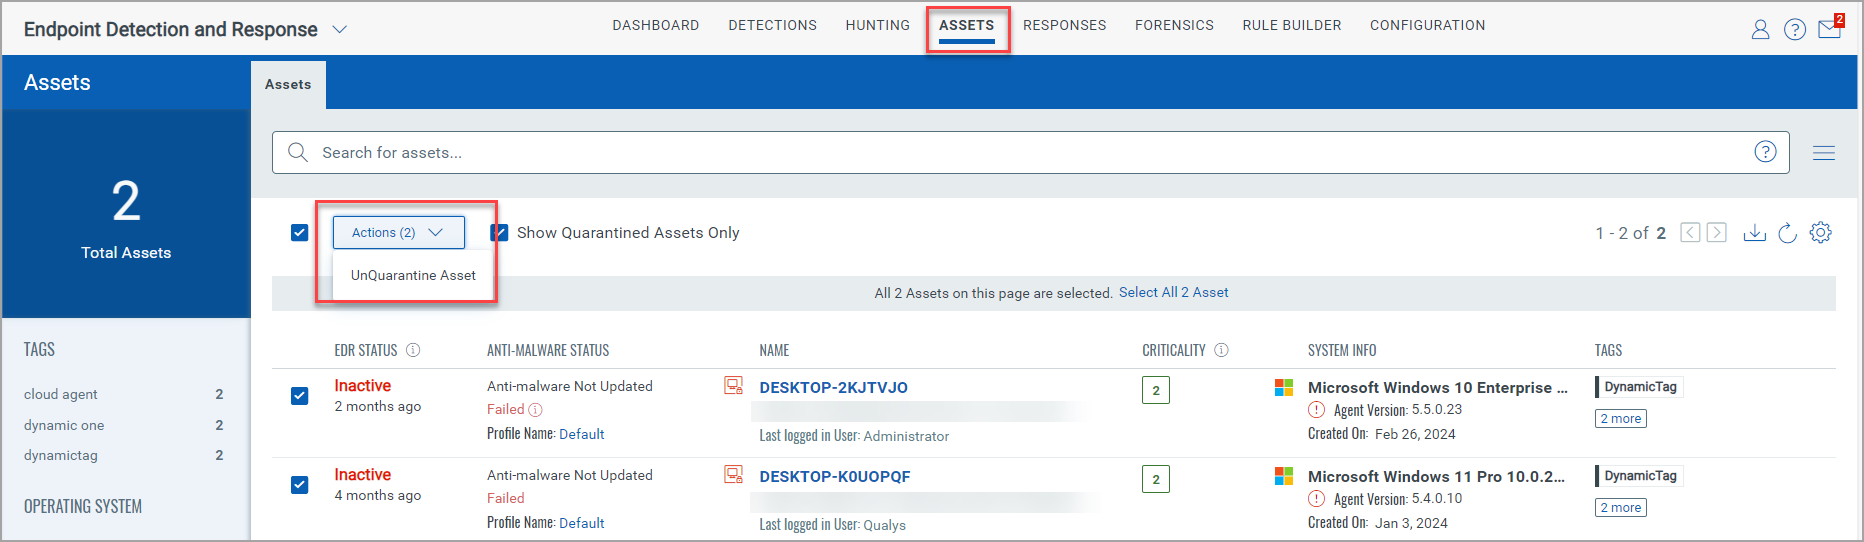
Bulk Unquarantine Assets from the Assets page
The Bulk Unquarantine Assets can be performed using the Qualys Query Language (QQL) tokens or by using the Unquarantine Asset option from the drop-down.
To perform bulk unquarantine action, using the menu option perform the following steps:
- From the Actions drop-down menu, select Unquarantine Asset. The following screenshot highlights the option and the bulk selection of the quarantined assets:
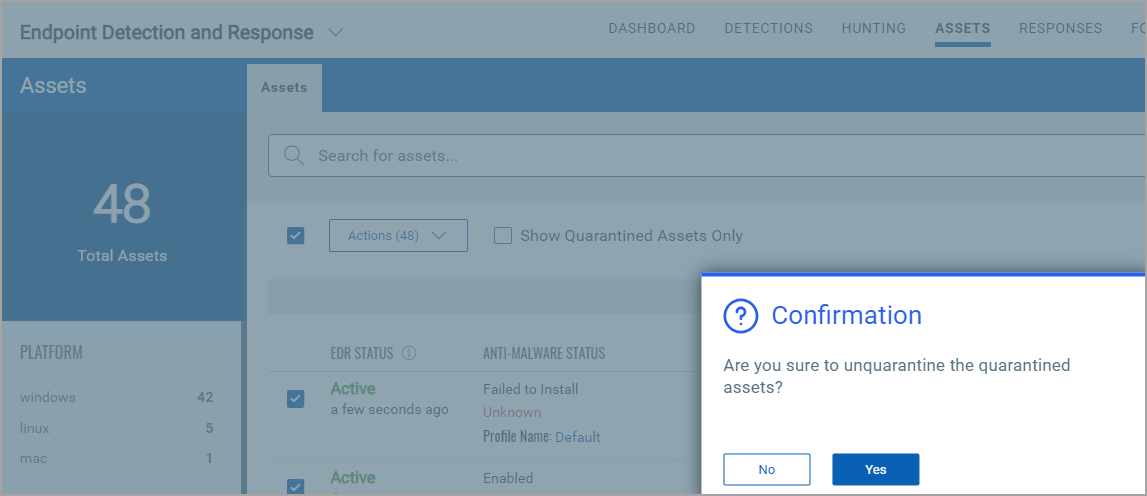
- Click Yes on the Confirmation window, which prompts for acknowledgment for performing bulk unquarantine assets. This Confirmation window appears only for bulk unquarantine asset operations when a list of assets is selected through a QQL search.
-
A notification Unquarantine Asset request sent successfully. View Request Status is generated. Click the View Request Status to follow the asset status.
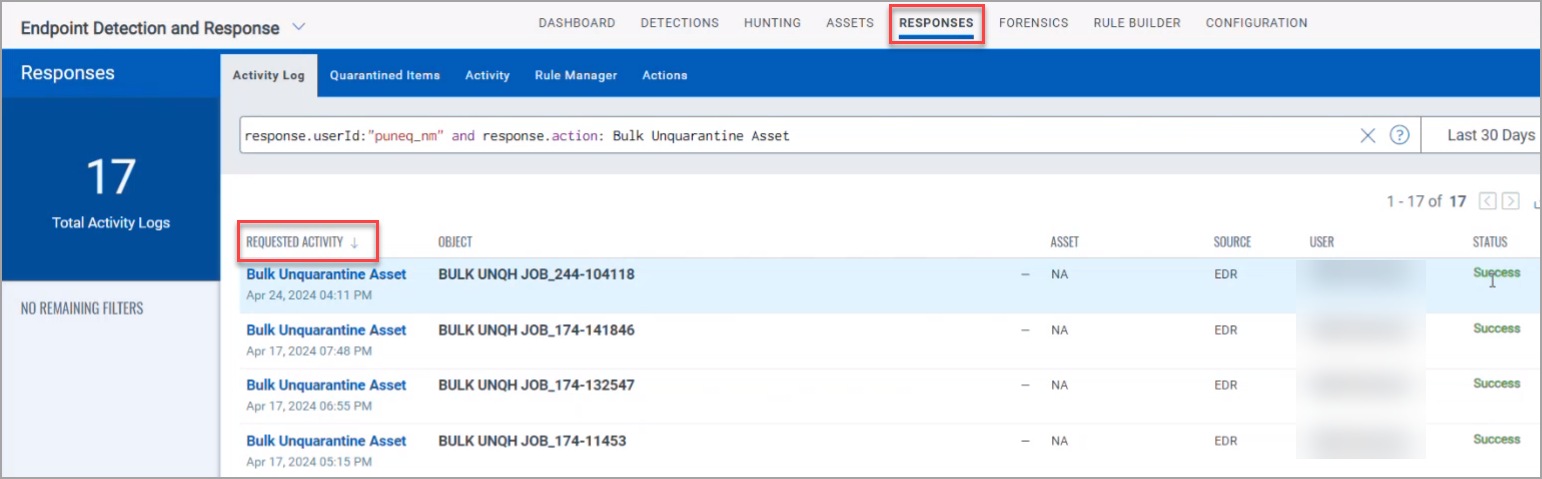
You are redirected to the Activity Log of the Responses tab.
The Requested Activity column lists the assets that were unquarantined using the bulks option. The following screenshot is an example of the Bulk Unquarantine Assets list in the Responses tab:
Unquarantine an Asset from the Incidents page
To release a quarantined asset, perform the following steps in the Incidents page of the Detections tab:
- In the Incidents page, select the required incident description of a quarantined asset.
- In the Summary tab, click Unquarantine Asset.
- In the Unquarantine Asset window add your comments.
- Click Unquarantine Asset.
A notification Unquarantine Asset request sent successfully. View Request Status is generated.
- Click the View Request Status to follow the unquarantine asset status.

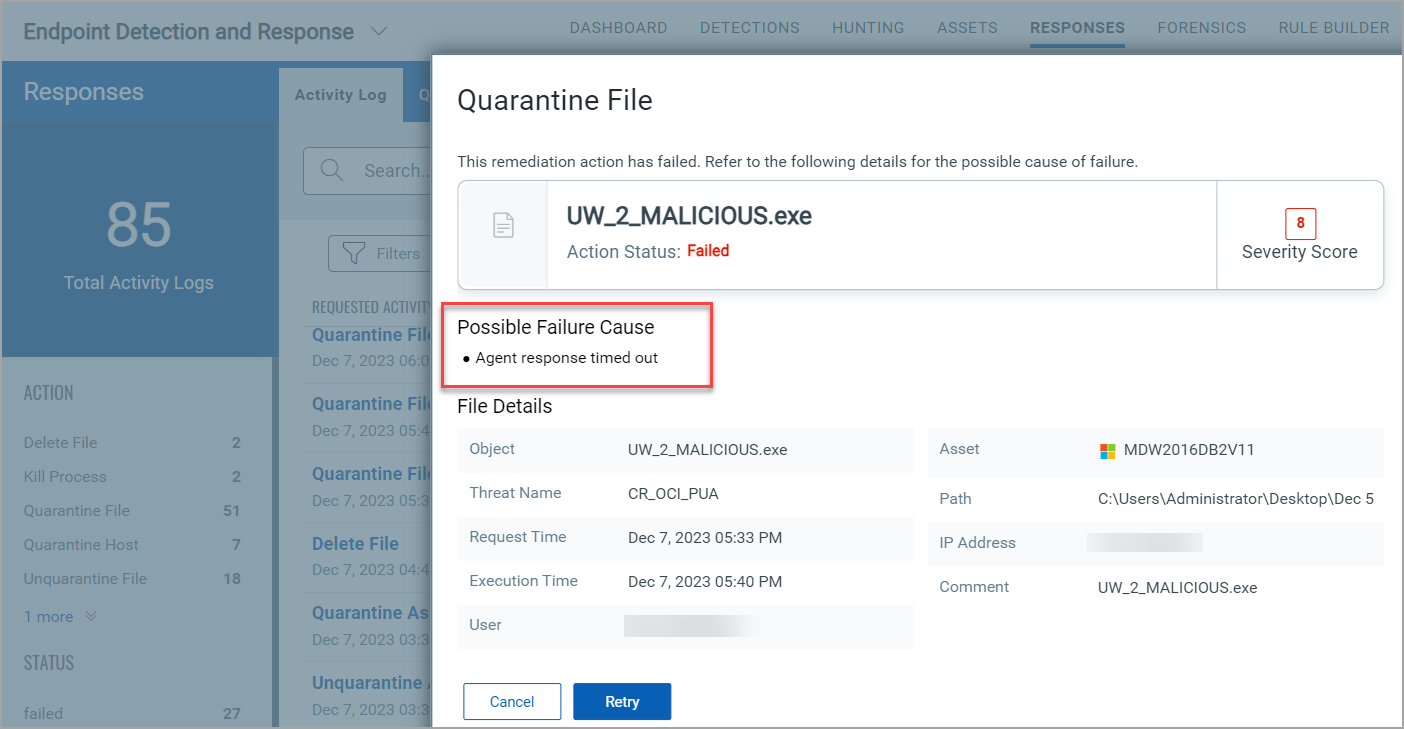
Failed Status Messages
The Status column in the Responses tab lists the assets with the status as Failed. Click on asset, and the Quarantine File window displays the possible failure cause. To resolve the issue, click Retry to successfully quarantine the asset.
Following are some of the remediation request failure causes:
- Input File is already deleted: The input file does not exist on the endpoint
- Agent Response Timed Out: If the Quarantine Asset request has been running (In Progress status) for more than 5 minutes, the Status column displays the instance as Agent response timed out. You can perform the action again after the timeout.
- Error: Unable to quarantine the file: The file or file path is restricted or protected for any delete or move operation.
- Error: Process does not exist: This error message occurs when the remediated process is not running anymore on the endpoint or is in the terminated state.
- Quarantine a file does not exist: The requested file is unavailable at the endpoint.
The following screenshot is an example of the Agent Response Timed Out:
Bulk Asset Tagging
Bulk asset tagging efficiently assigns tags or labels to multiple assets at once, often in IT asset management or inventory systems. Organizations that manage many assets, such as computers, servers, or devices, will benefit from this feature.
Steps for Bulk Asset Tagging
To bulk tag assets, perform the following steps in the Assets tab:
- Select Assets: You can select the assets you want to tag in bulk.
- Choose Tags: After selecting the desired assets, you can select or create tags to apply.
- Apply Tags: Once the tags are chosen, you can confirm your action by adding assets to the selected tags.
- Verify Changes: After tagging, reviewing the tagged assets is advisable to ensure everything was applied correctly.