Get Started with EDR
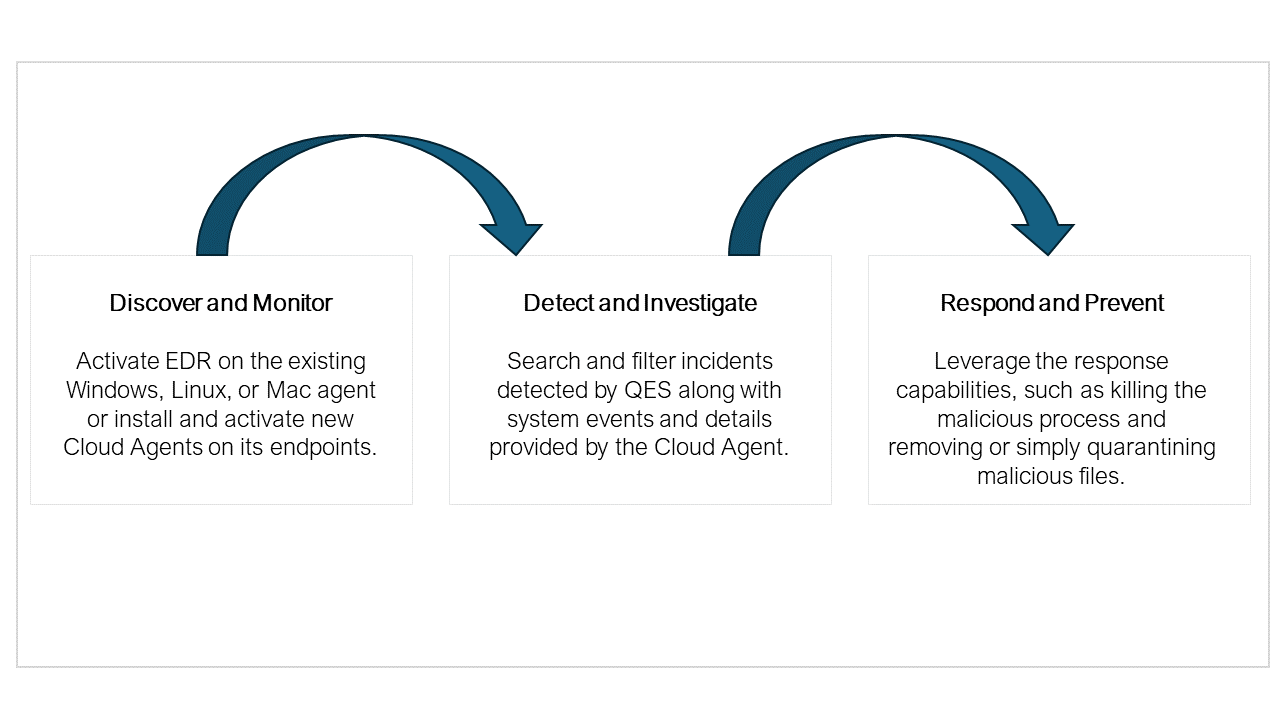
EDR provides active real-time monitoring and data collection and requires constant inspection, scanning, and data collection. To get started with EDR, build your inventory and configure cloud agents. Once the Windows or Linux agents are configured, the detections on those assets lists in your EDR UI. You can further perform the following actions on these assets:
You must upgrade to Cloud Agent version 4.1 and later utilize all the EDR functionality.
Customizable Dynamic Dashboards
Dashboards help you visualize your assets, threat exposure, leverage saved searches, and quickly remediate malicious or suspicious events.
We have integrated Unified Dashboard (UD) with EDR. UD brings information from all Qualys applications into a single place for visualization. UD provides a powerful new dashboard framework and platform service that will be consumed and used by all other products to enhance the existing dashboard capabilities.
You can use the default EDR dashboard provided by Qualys or easily configure widgets to pull information from other modules/applications and add them to your dashboard. Add as many dashboards as possible to customize your vulnerability posture view. For more information, see Unified Dashboard.
Global Dashboard Permissions
Your access to Unified Dashboard depends on the global permissions granted to you from the Administration application. Refer to the Online Help in the Administration application for information on Global Dashboard Permissions.
When you assign the Global Dashboard permissions to a role, the Global Dashboard permissions override the module-specific dashboard permissions. As a result, the module-specific dashboard permissions are ignored.