Investigate Detections
You can access information on potential security issues identified on your network or endpoints under the "Detections" tab. In the Detections tab, you can identify active threats by malware name and malware family name. The Detections tab initiates a workflow that includes determining the detection source, quarantining the asset, and assigning the incidents to the assignee, who is responsible for coordinating the incident response and ensuring that the necessary actions are taken for remediation.
Here's what "Incidents" and "Alerts" mean under this tab:
Alerts are individual signals of suspicious activity, while incidents are groups of related alerts that, when combined, provide a comprehensive picture of possible security events. An alert is a single notification of a potential threat, while an incident is a collection of alerts indicating a more serious security issue.
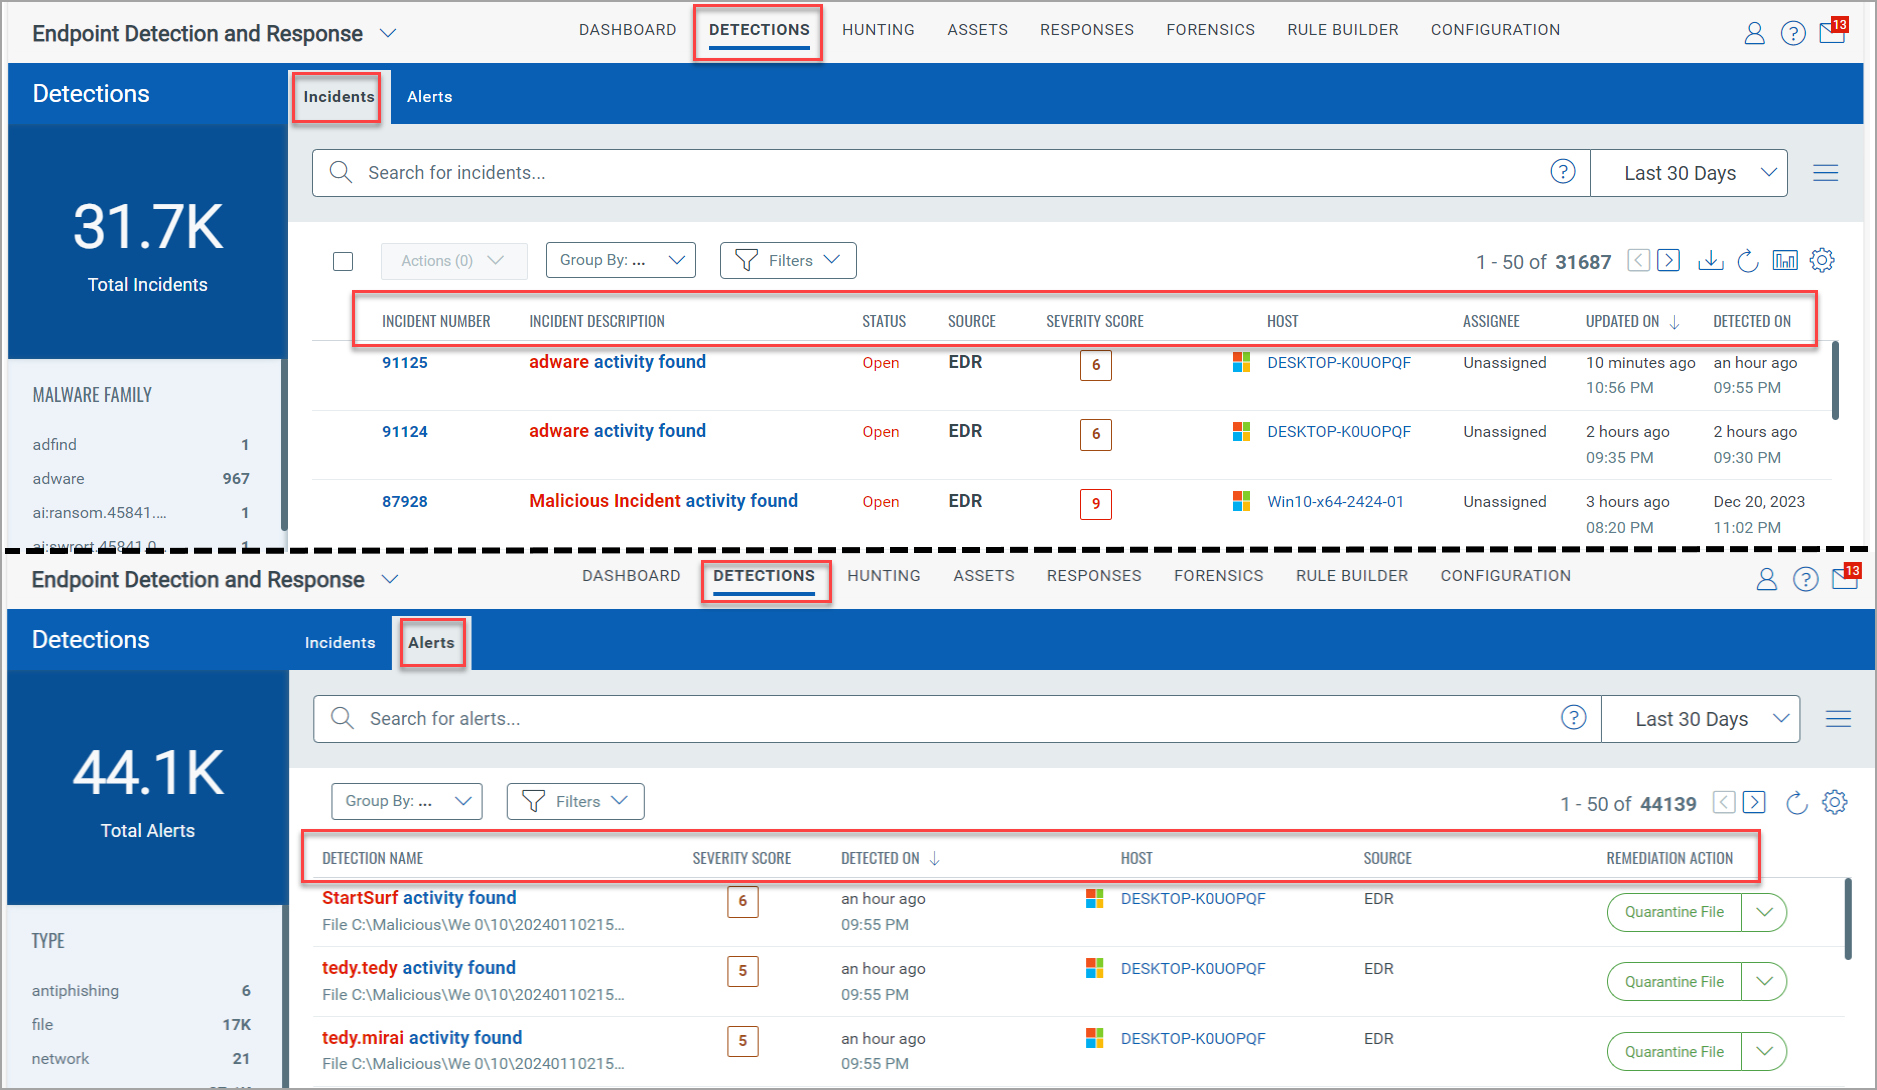
The following combined screenshot is an example of the Incidents and Alerts tabs under Detections:
Incidents
An incident is a group of related events or alerts that indicate a security issue that needs attention. Incidents are created by linking multiple events and alerts with similar characteristics, such as the same source, similar behavior patterns, or occurring within a specific timeframe.
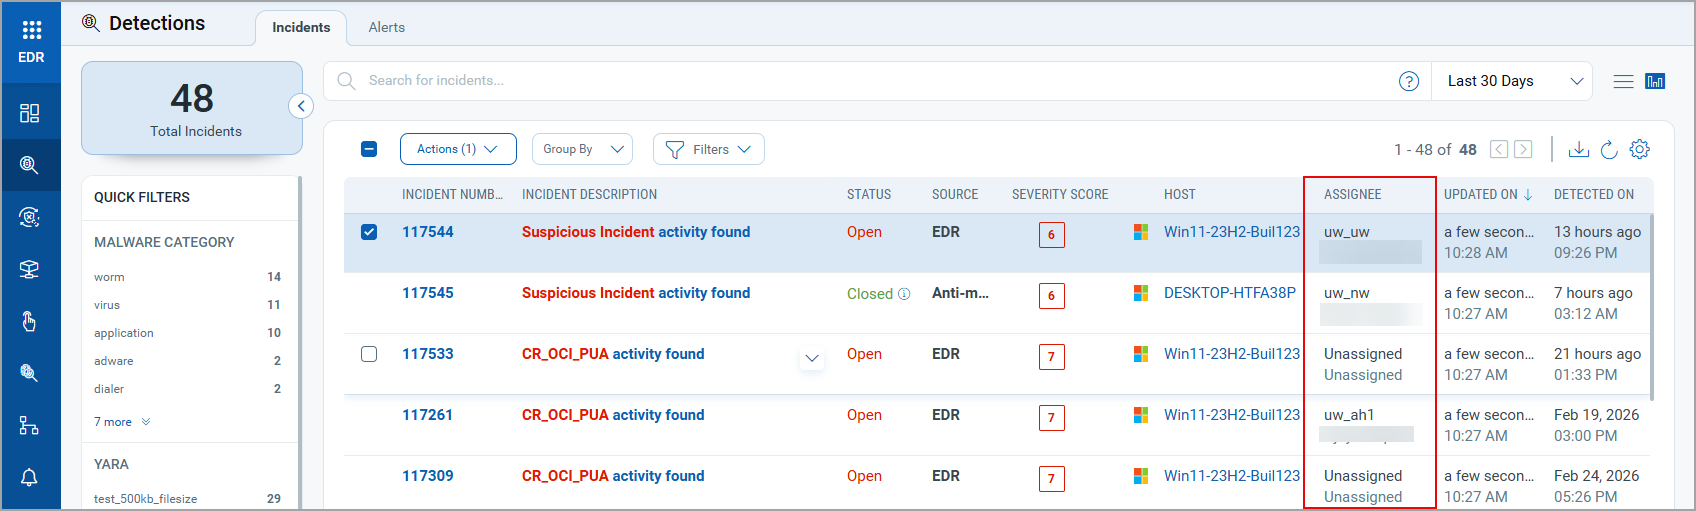
By grouping related alerts and events, the Incidents tab provides security teams a comprehensive view of all the incidents detected on an asset. This comprehensive information, including Incident Number, Incident Description, Status, and Severity Score, ensures that security teams are well-informed and prepared to respond effectively.
A 0 risk score is considered non-malicious, and hence no incidents are created with this score.
The highest score of an event is the primary factor of the incident metadata, which includes the overall incident score and description. The highest score and description will be dynamically updated based on the high-scored events during the incident's progression.
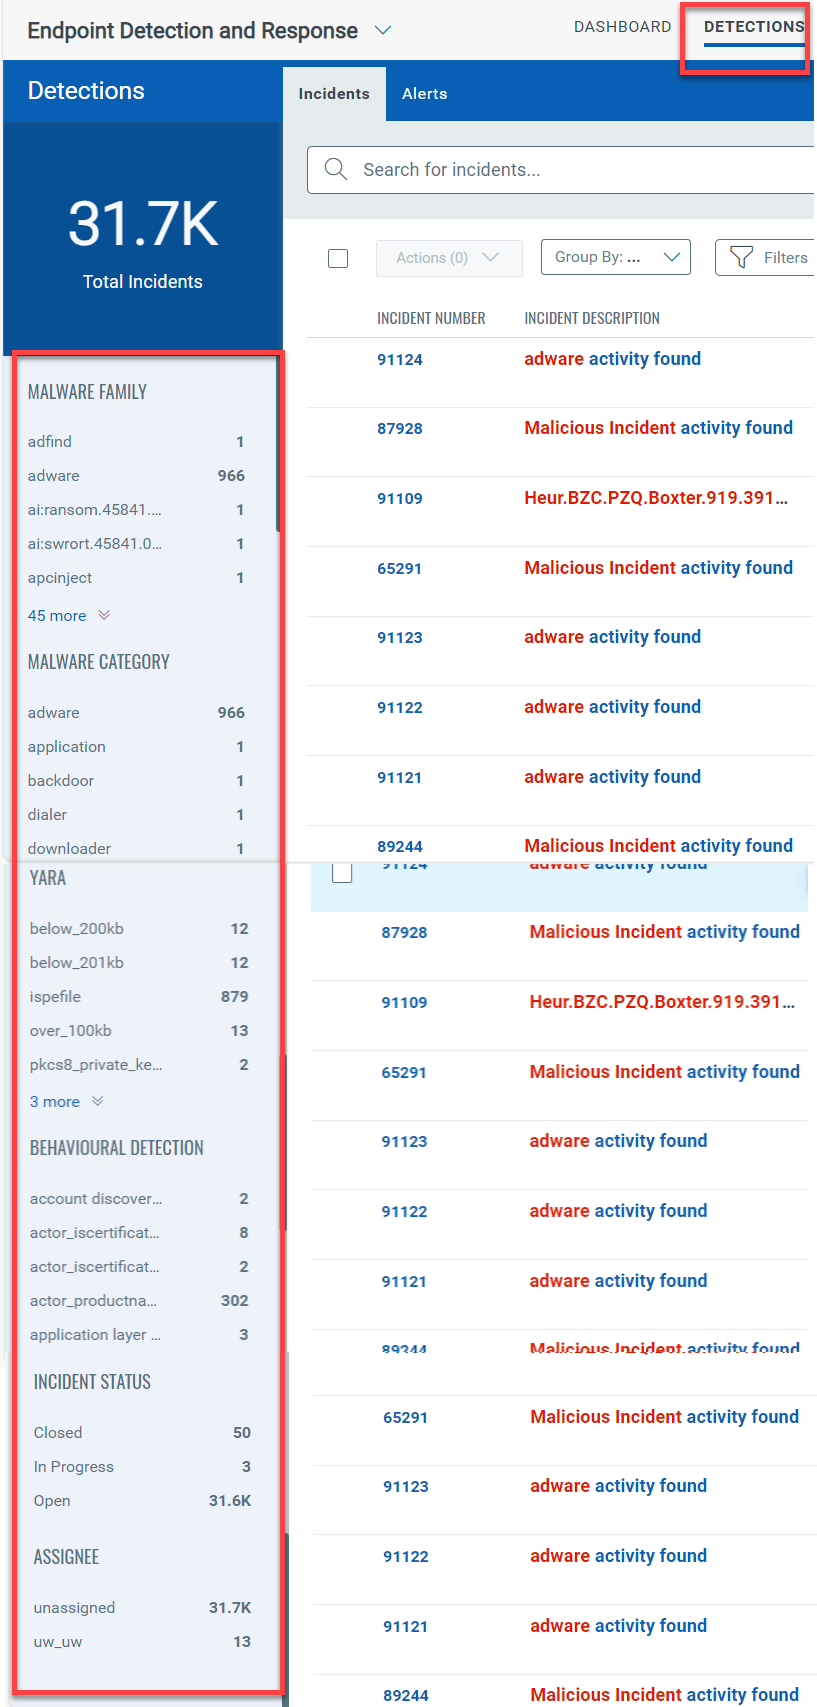
The Incident aggregation panel displayed at the left of the page lists the Malware Family, Malware Category, Behavioural Detection, Incident Status, and Assignee. The Behavioural Detection lists the MITRE Technique names and Technique IDs. You can click on any of these categories to get the complete list of the assets impacted with that incident.
The following screenshot highlights the Incident aggregation panel on the Incidents page of the Detections tab:
Alerts
Alerts are notifications or warnings that something suspicious or potentially harmful has been detected. Alerts provide immediate notification about specific activities or anomalies that may require further investigation, empowering security teams to proactively and respond to potential threats. An alert represents a single detection of potentially malicious activity.
Examples of Alerts and Incidents
In these examples, alerts represent individual signs of potentially malicious activity. In contrast, incident group-related alerts provide a broader context, helping security teams quickly identify, investigate, and respond to threats.
| Example 1: Malware Detection | |
|
Scenario:
|
Incident: These three alerts are grouped into a single incident indicating a potential malware infection. The system identifies that the suspicious file download, the unusual network traffic, and the execution attempt are related and may represent a malware attack. |
| Example 2: Phishing Attack | |
Scenario:
|
Incident: These alerts are grouped into a single incident, suggesting a successful phishing attempt. The alerts indicate the user's email, the phishing link, and the credential entry, providing a complete picture of the phishing attack. |
| Example 3: Unauthorized Access | |
|
Scenario:
|
Incident: These alerts are combined into an incident indicating potential unauthorized access and data exfiltration. Failed login attempts, unusual successful login, and subsequent data transfer are related and suggest a security breach. |
| Example 4: Ransomware Attack | |
|
Scenario:
|
Incident: These alerts are grouped into incidents indicating a ransomware attack. The initial encryption attempt, the spread of the process, and the encryption of files across multiple endpoints are related and show the progression of ransomware. |
Features on Incidents Page
The default incident retention period is 60 days. After 60 days, the incidents will no longer be available. Incident data cleanup is performed for all the incidents with Open, In Progress, and Closed statuses for more than 60 days.
Actions
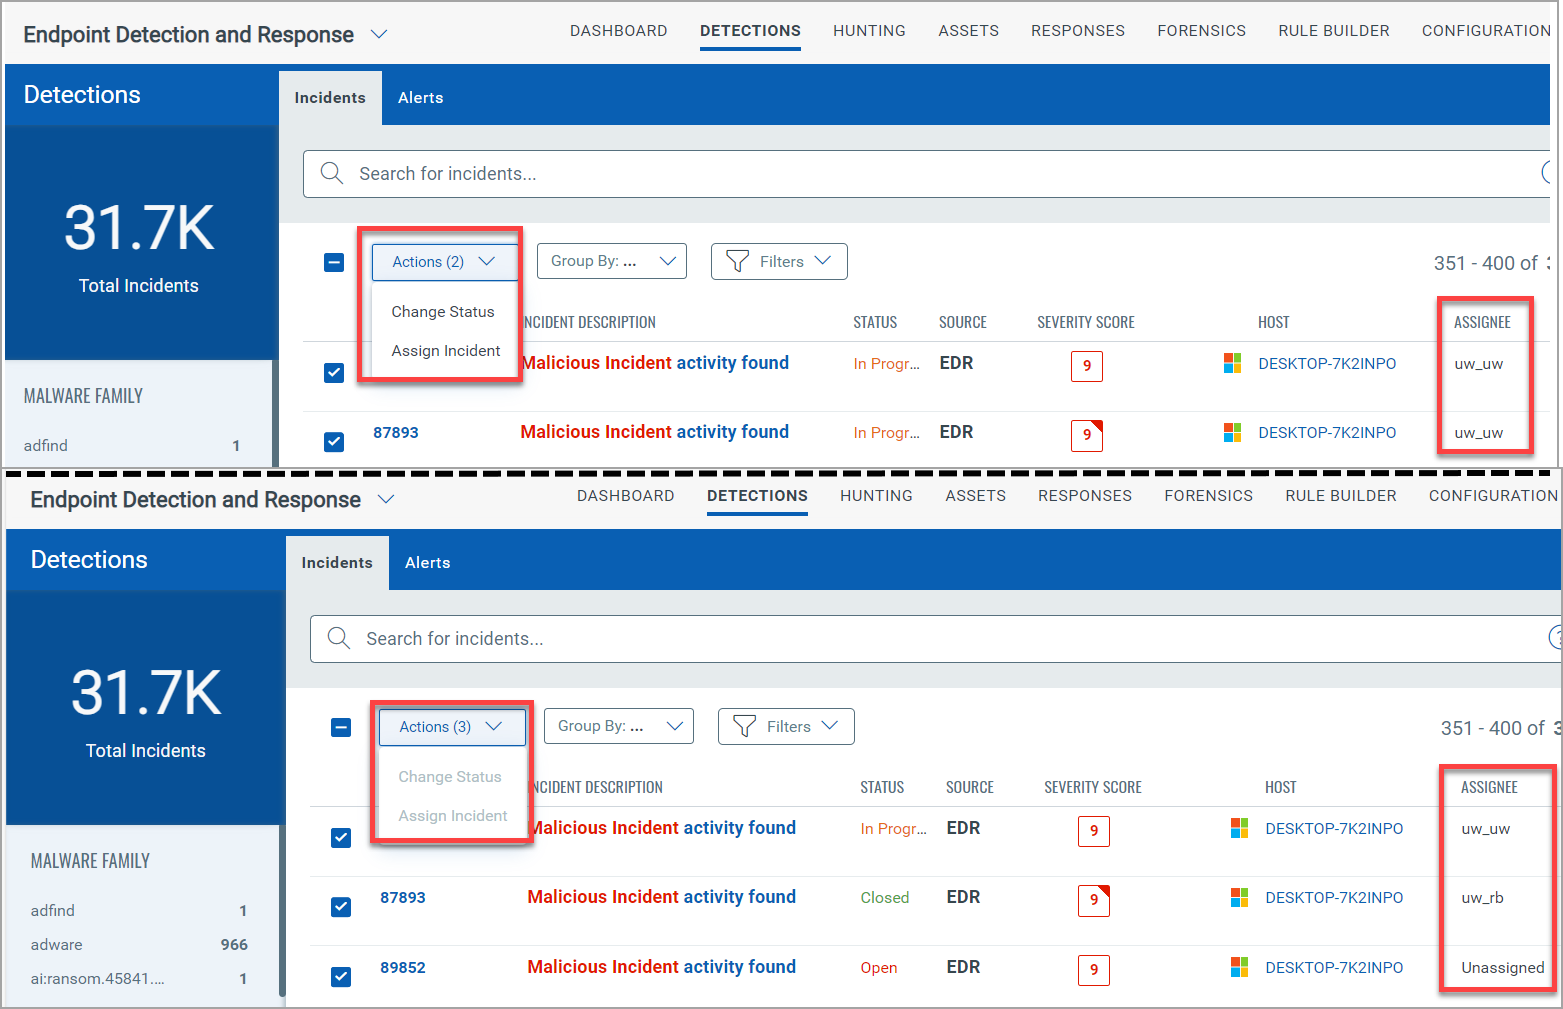
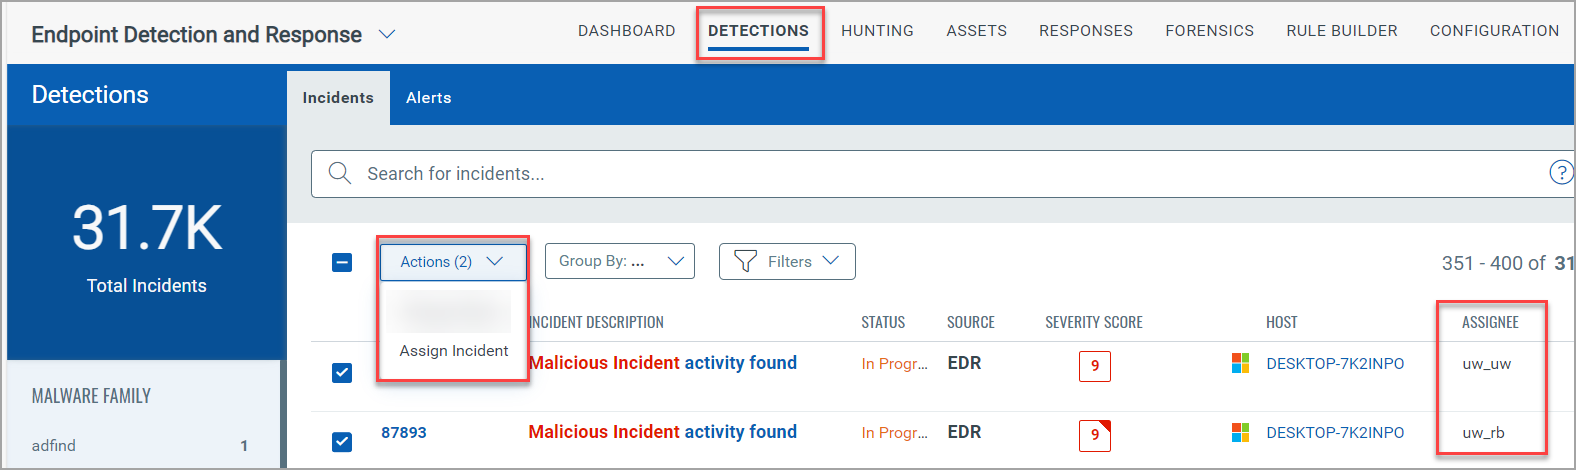
You can perform bulk actions like Change Status and Assign Incident from the Actions drop-down menu. The bulk actions cannot be performed if the Assignee is different. If Malware Protection is enabled, the default source of an incident is the Antimalware. This incident's Status is Closed since the events have been remediated. However, you can change the status of the incident. The following screenshots show the comparison of the Actions option when Assignee is the same and different:
- Change Status: The status of an event can be - Open, In Progress, Closed, or Re-open. By default, the status of an event is Open. To change the status of an incident, you can also change the status from the Quick Actions menu.
Perform the following steps to Change Status of multiple events. Fields marked in red asterisk are mandatory.
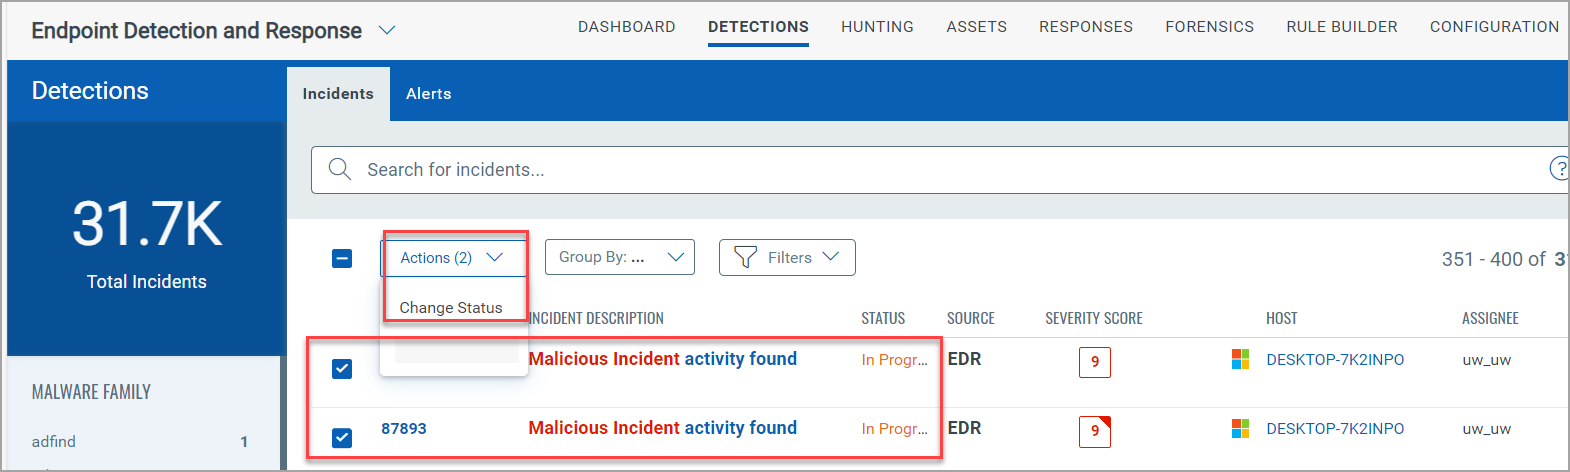
- Select the incidents, and from the Actions drop-down, click Change Status.
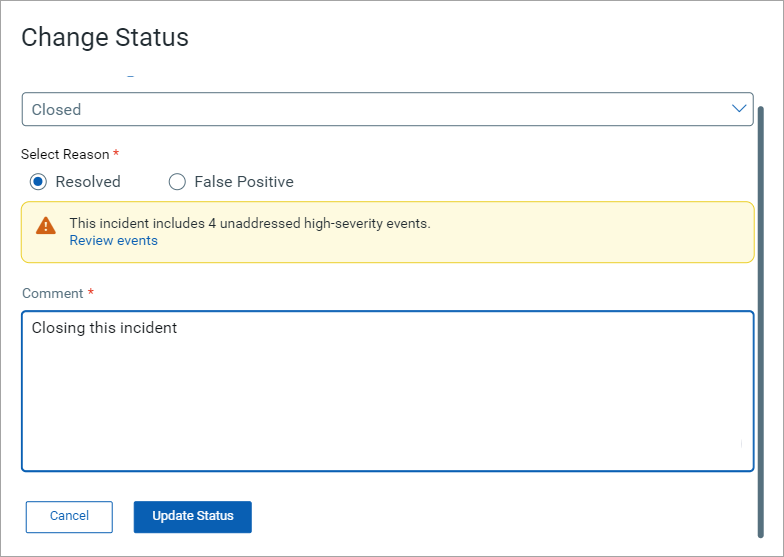
- Select the Reason as False Positive or Resolved if you select the status as Closed.
- You will see a message below Resolved if the incident has unaddressed high-severity events. If you click Review events, you will be redirected to the Incident Details page, where you can review and remediate these events. This step is optional. You can still mark the incident as resolved without patching the high-severity events. To close the incident, click Update Status.
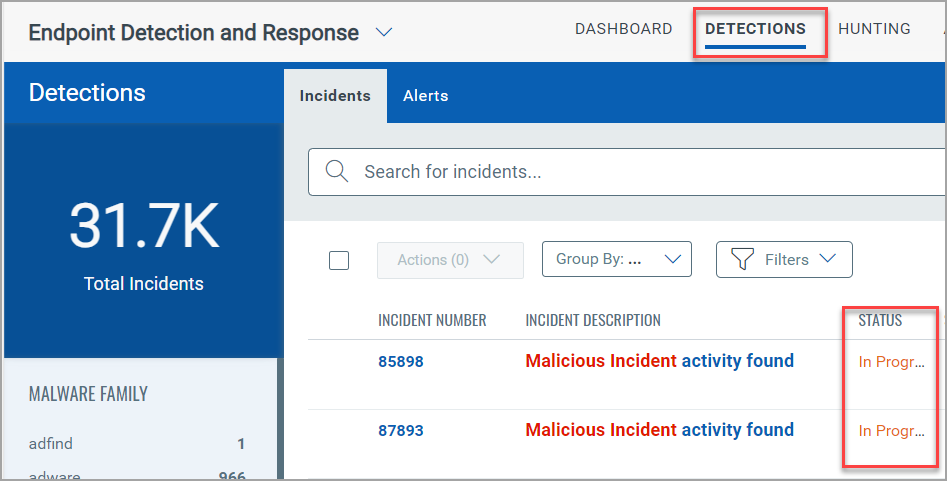
The updated status is listed in the Incidents tab. The following screenshot is an example of the status change of incidents from Open to In Progress:
- Assign Incident: You can assign an incident to a user using this option. By default, the Assignee column displays the assignee name Unassigned. You can change the assignee from the Quick Actions menu. When assigned to a user, the Assignee column displays the username and the full name of the Assignee.
Perform the following steps to assign multiple incidents to a user:
- Select the incidents, and from the Actions drop-down, click Assign Incident.
- Select the Assignee from the drop-down. Users with the incident update permissions are listed in the Select Assignee drop-down.
- Click Save.
The updated status is listed in the Incident tab. The following screenshot is an example of assigning incidents to a user:
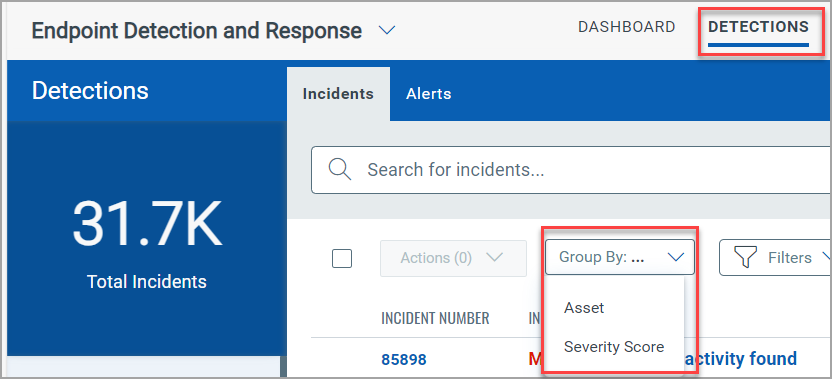
Group By
The Group By drop-down menu allows you to list the incidents with Asset or Severity Score.
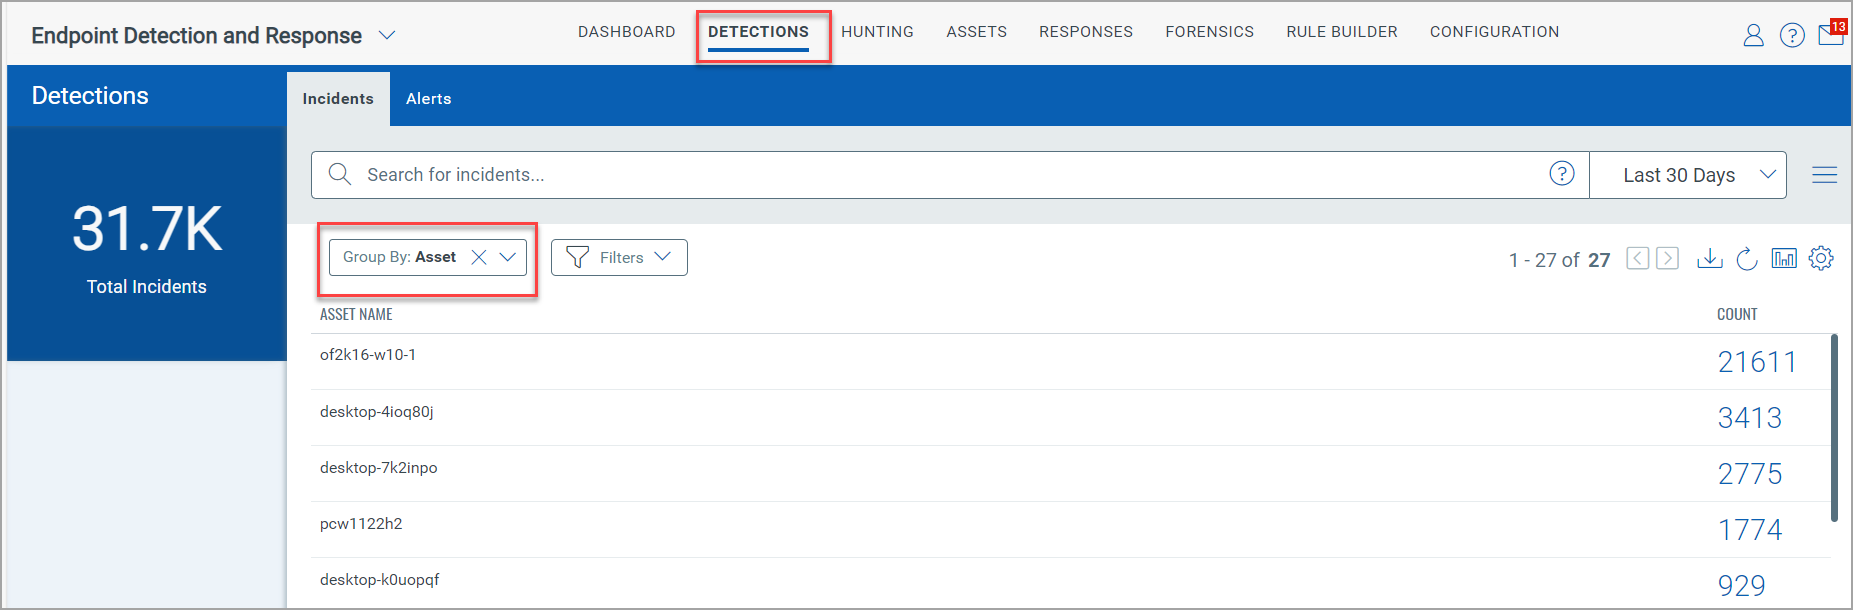
The following screenshot is an example that lists the Count of the detected incident by the specific Asset if you select Asset from the Group By drop-down:
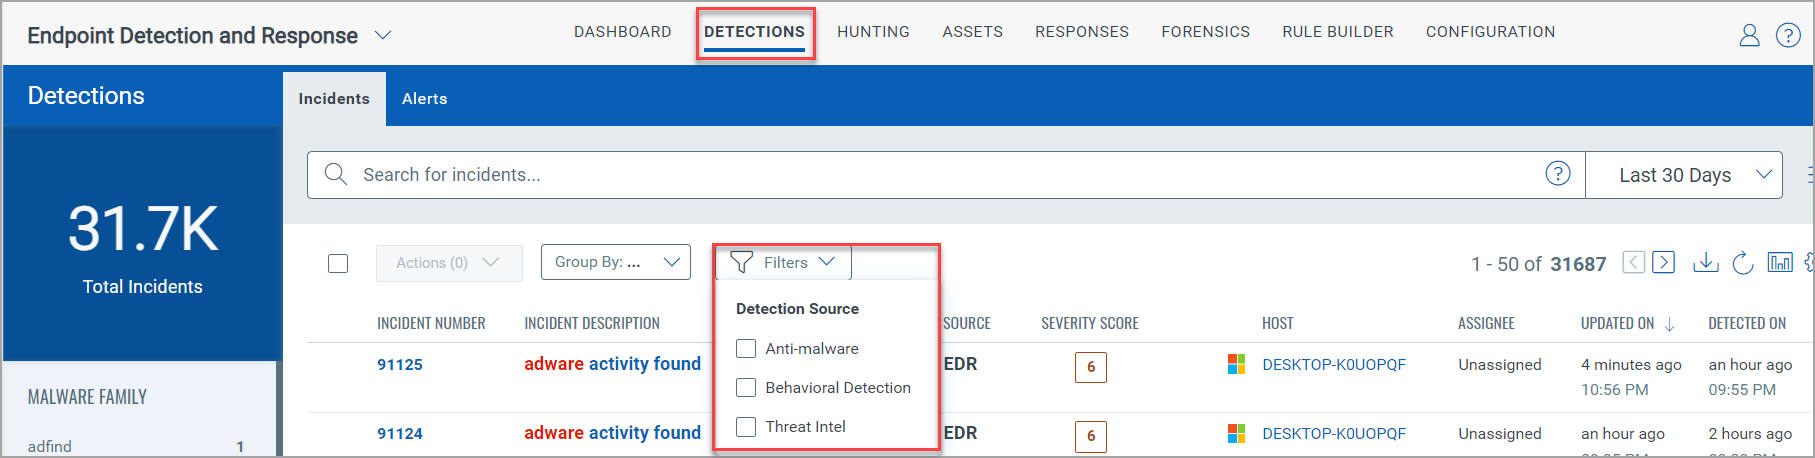
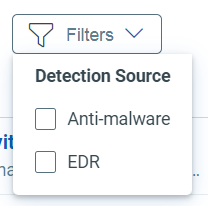
Filters
The Filters drop-down menu allows you to select the threat source as Anti-malware and EDR.
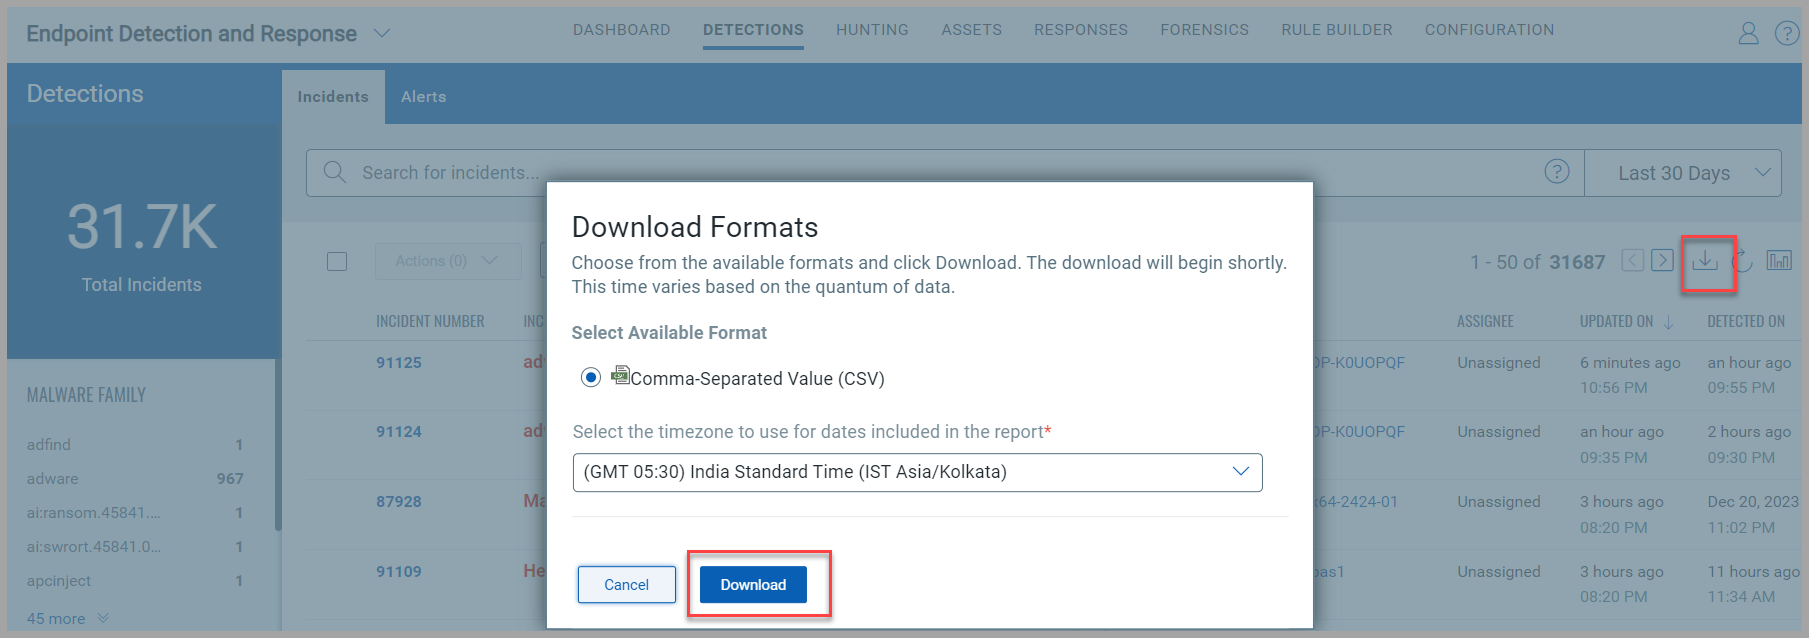
Download
Click the Download icon ![]() to download the information on your local system. The data is downloaded in CSV format.
to download the information on your local system. The data is downloaded in CSV format.
Fields like Score, Description, Status, Assignee, Detected On, OS, HostName, and AgentId, are some of the fields downloaded in the CSV file.
Features on Alerts Page
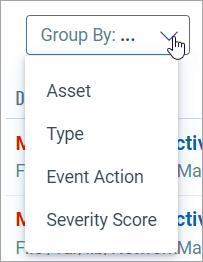
Group By
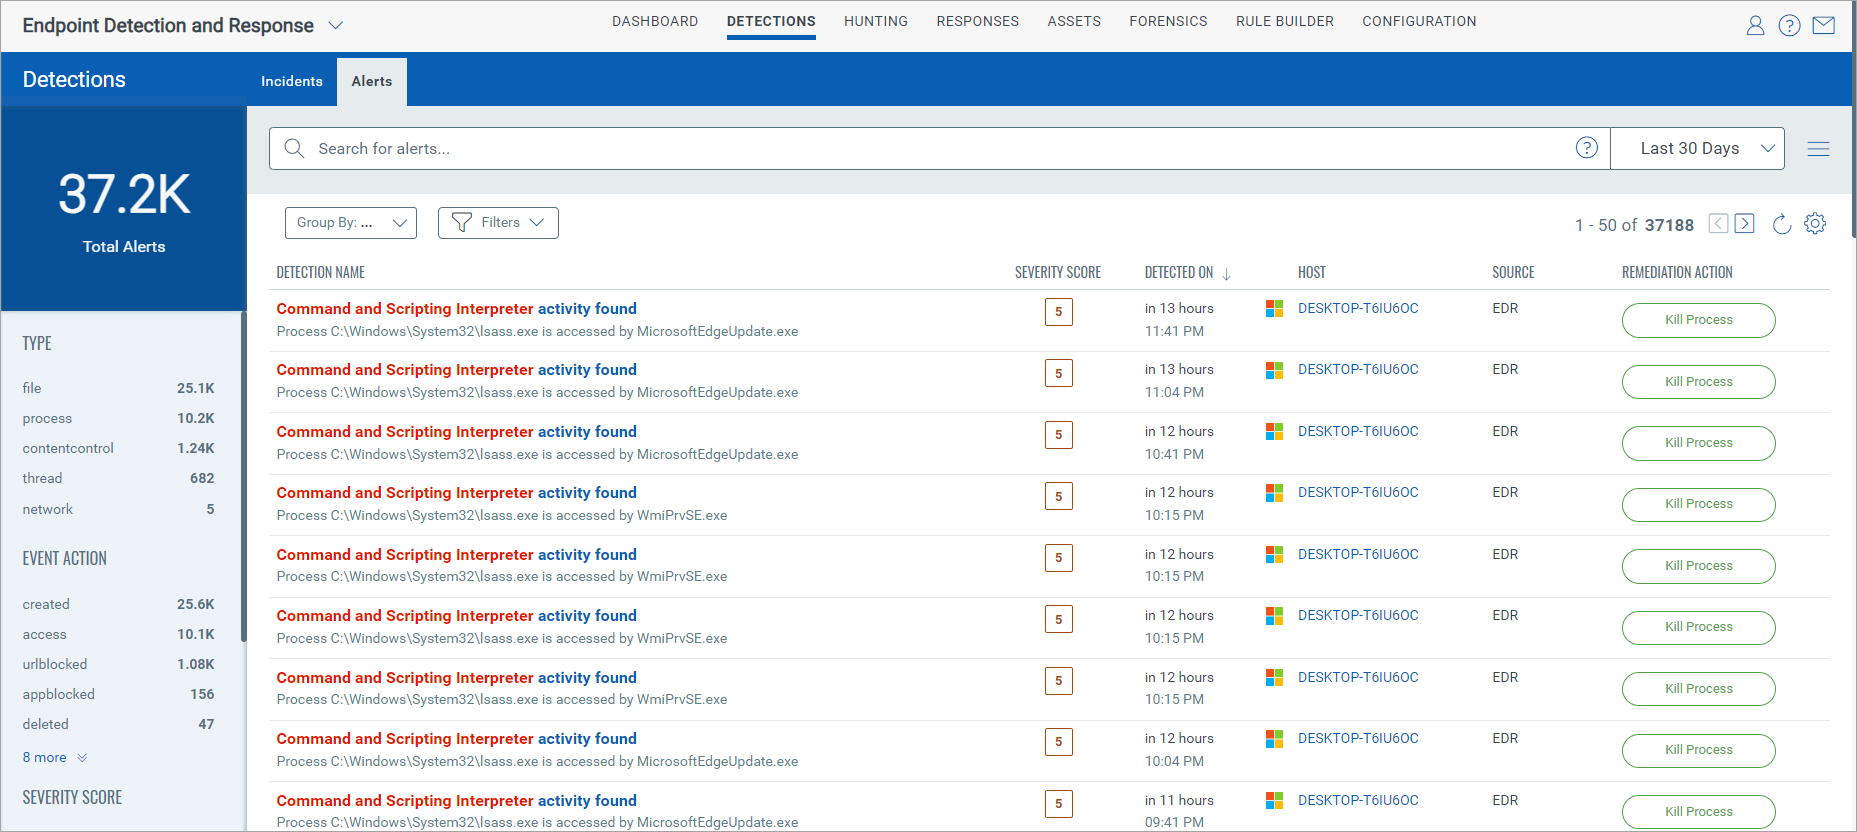
The Group By drop-down menu allows you to list the incidents with Asset, Type, Event Action, or Severity Score.
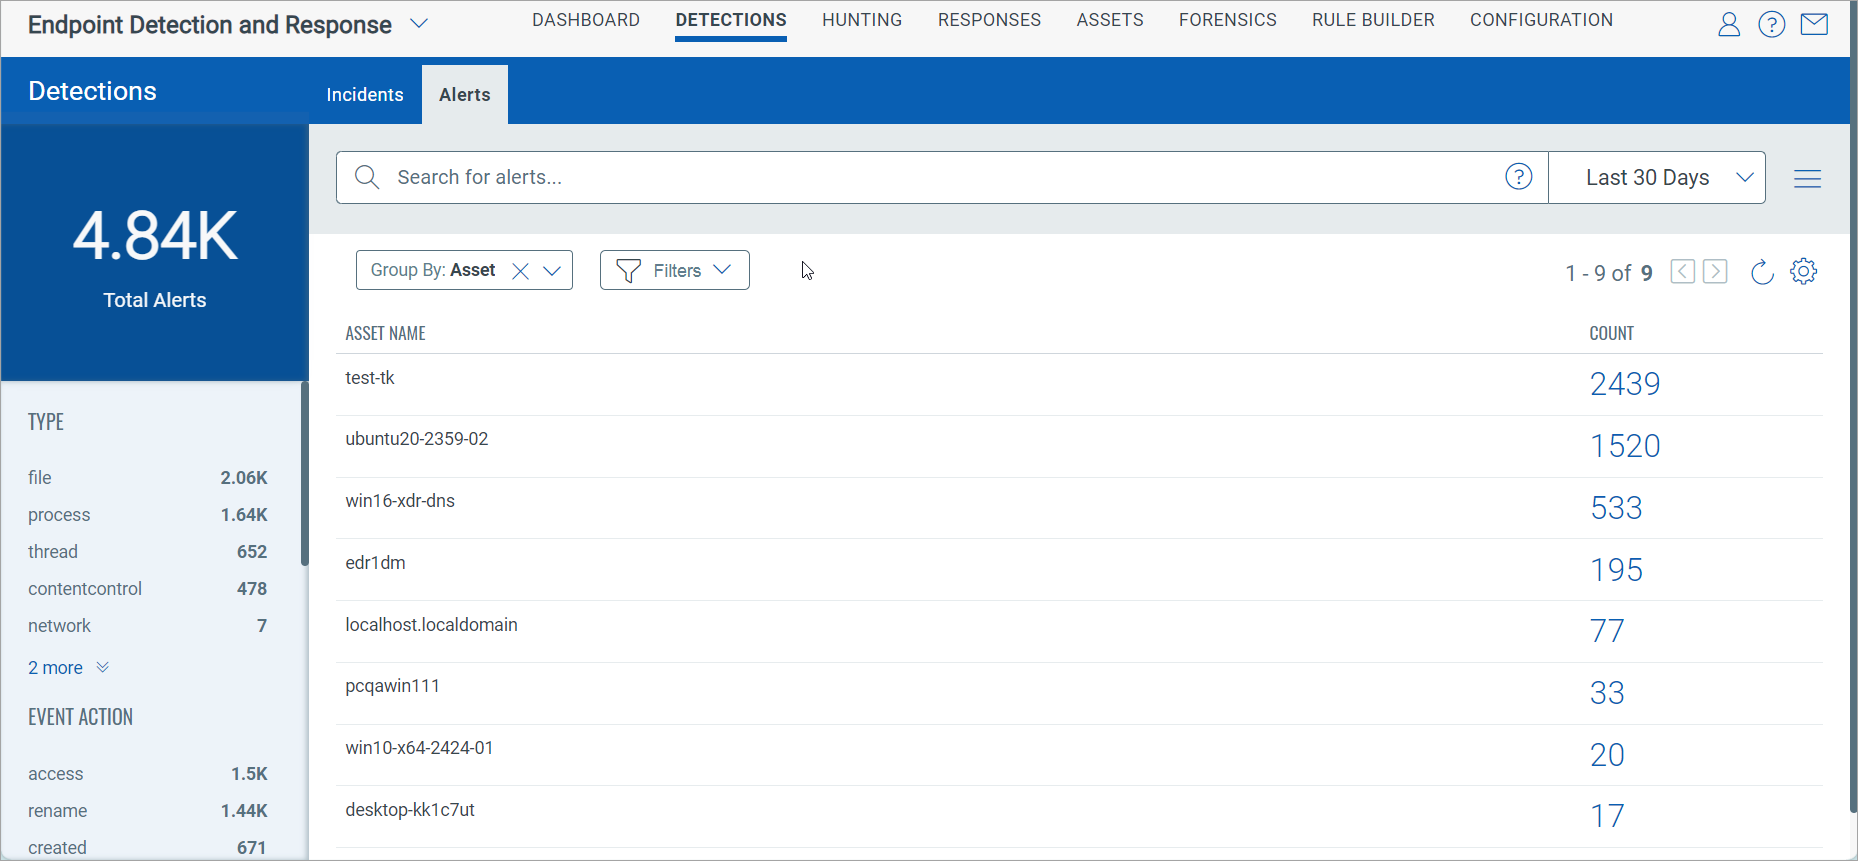
The following screenshot is an example that lists the Count of the detected alerts by the specific Asset if you select Asset from the Group By drop-down:
Filters
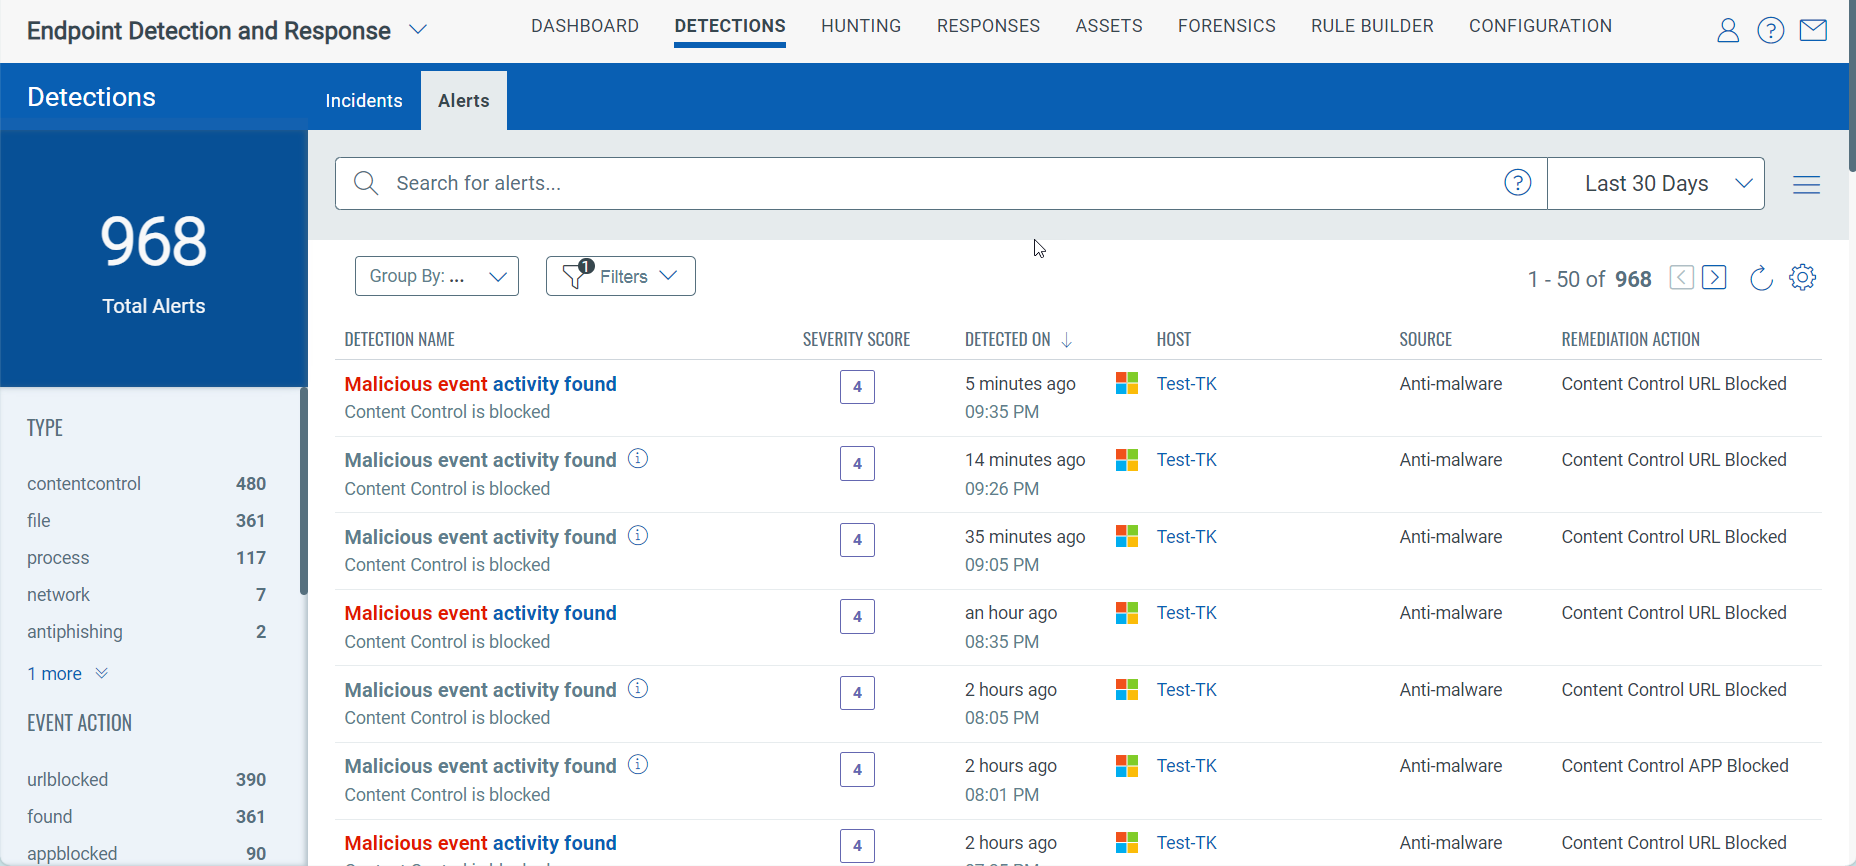
The Filters drop-down menu allows you to select the detection source as Anti-malware and EDR.
The following screenshot is an example that lists the incidents that have source as Anti-malware.