View Risk Findings
Risk management is a critical framework designed to safeguard organizational assets, maintain uninterrupted operations, and defend your organization's reputation against cyber threats. It involves identifying vulnerabilities and misconfigurations, monitoring them, and mitigating the threats they poseThe . This section explains the Findings Overview and the listing of Vulnerabilities and Misconfigurations Findings.
Findings Overview
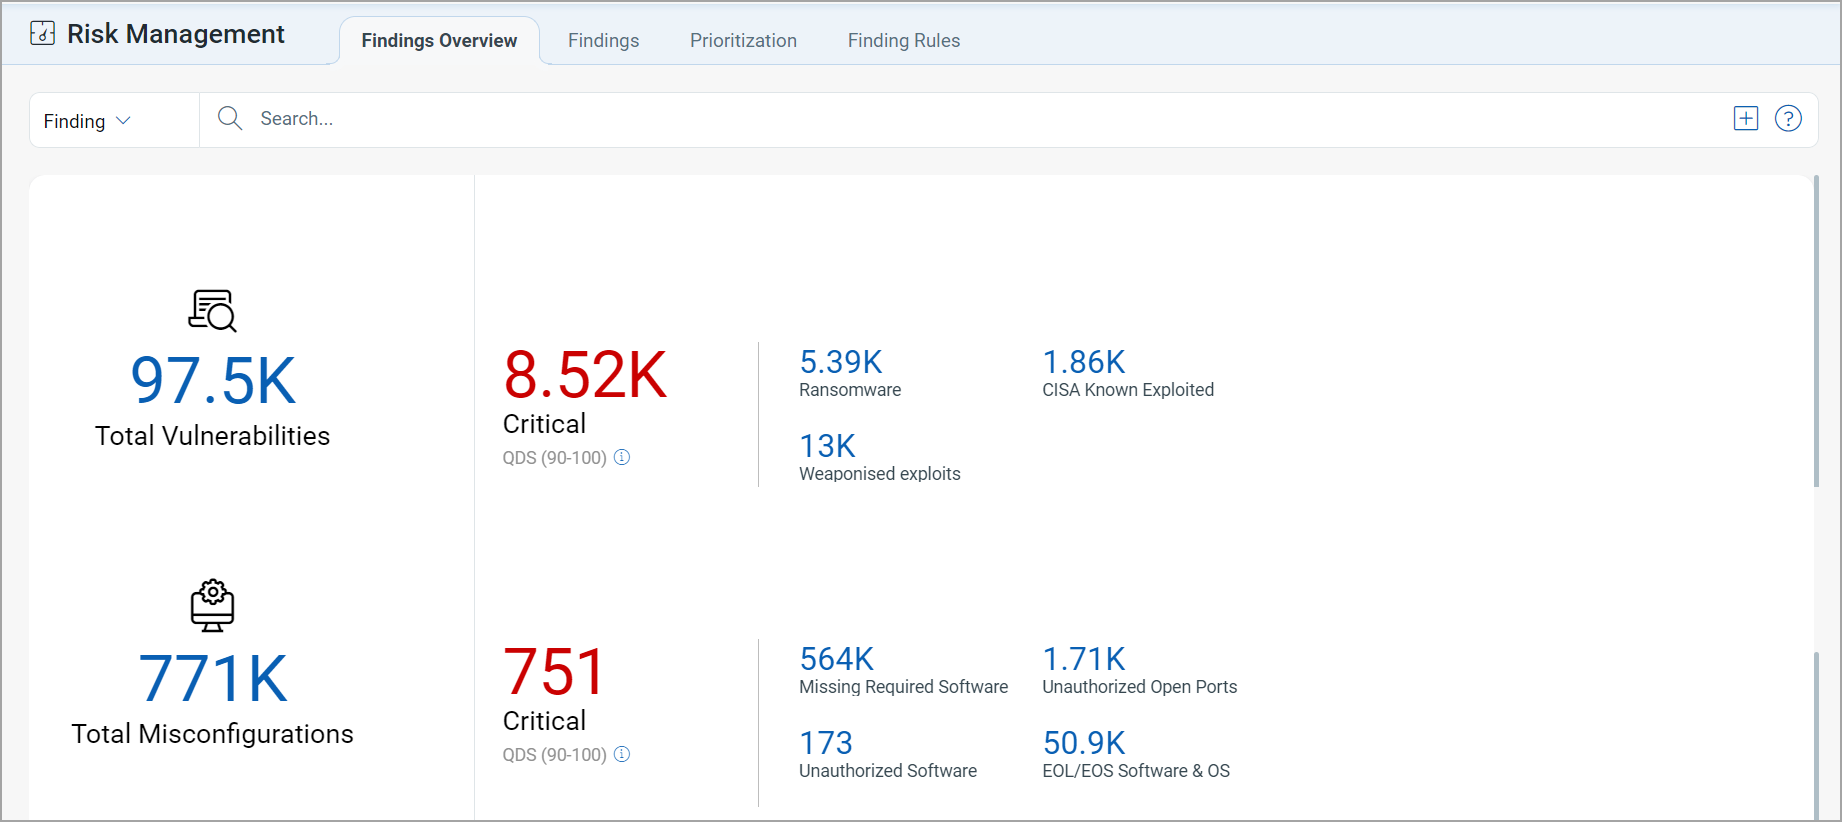
The Risk Management tab in ETM gives you an overview of Findings categorized as Vulnerabilities and Misconfigurations. The following screenshot displays the Findings Overview:
Vulnerabilities Findings
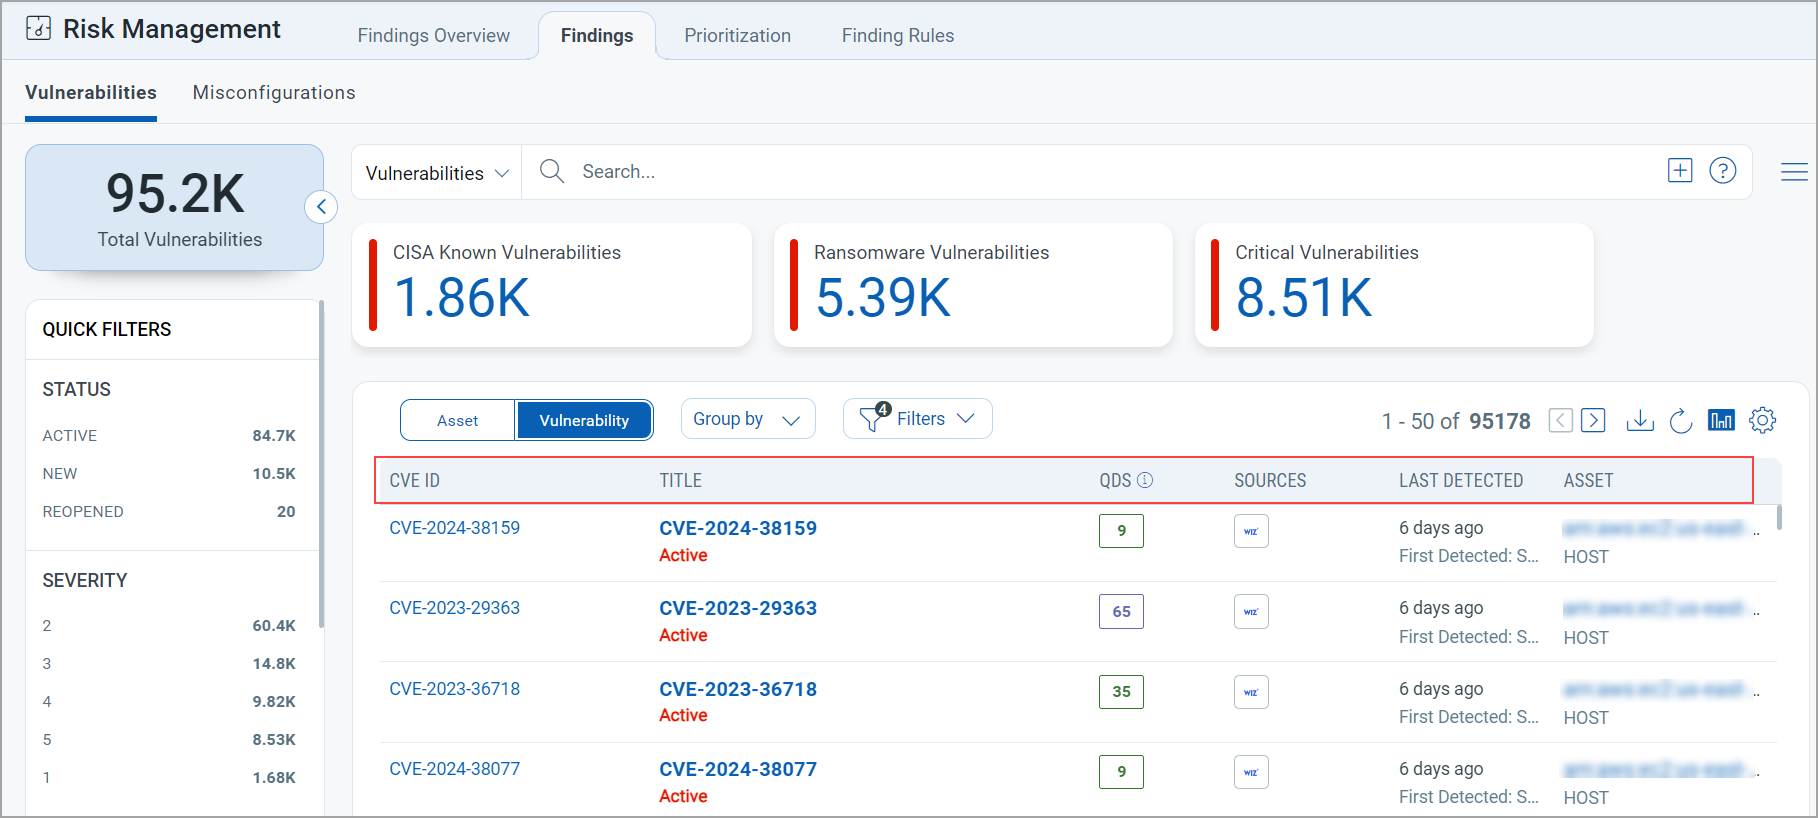
To view the vulnerabilities detected on your assets, navigate to the Risk Management > Findings page and select Vulnerability. You can also use various metadata filters, group by options, and custom query capabilities. Following is the Vulnerabilities data listed on the Findings page:
- Vulnerability: This column lists the vulnerabilities detected on the assets. By clicking the Finding Name, you will be redirected to the Finding Summary page.
- QVSS: Qualys Vulnerability Scoring System (QVSS) is the scoring framework used in ETM to measure the severity of all security exposures, both vulnerabilities and misconfigurations, on a 0.0–10.0 scale.
- Exploitability: This column shows the exploit status to provide clear, actionable insights into vulnerabilities. You can see the following statuses:
- Actively Exploited: Indicates that the vulnerability has been actively exploited in the past 30 days.
- Exploited: Indicates that the vulnerability has been exploited more than 30 days ago but is not actively being targeted.
- Weaponized/ POC/ No Exploit: Indicates that there is no active exploitation, based on the vulnerability's potential risk level.
The Exploitability column tooltip provides a clear, structured breakdown of exploit statuses and TruConfirm validation results, enabling you to make data-driven decisions with ease. The tooltip categorizes vulnerabilities into exploit status (such as actively exploited, exploited, or weaponized) and TruConfirm status.
- Risk Factors: Indicates the conditions or attributes that increase the likelihood or severity of a vulnerability being exploited.
- Impact: Shows the potential damage or business effect if the vulnerability is successfully exploited.
- EPSS Score: Displays the Exploit Prediction Scoring System value that estimates the probability of the vulnerability being exploited in the near term.
- Detection Count: Represents the number of times this vulnerability has been identified across your monitored assets or environment.
-
The following Vulnerabilities screenshot under the Risk Management > Findings tab highlights its columns:
View Vulnerability Finding Details
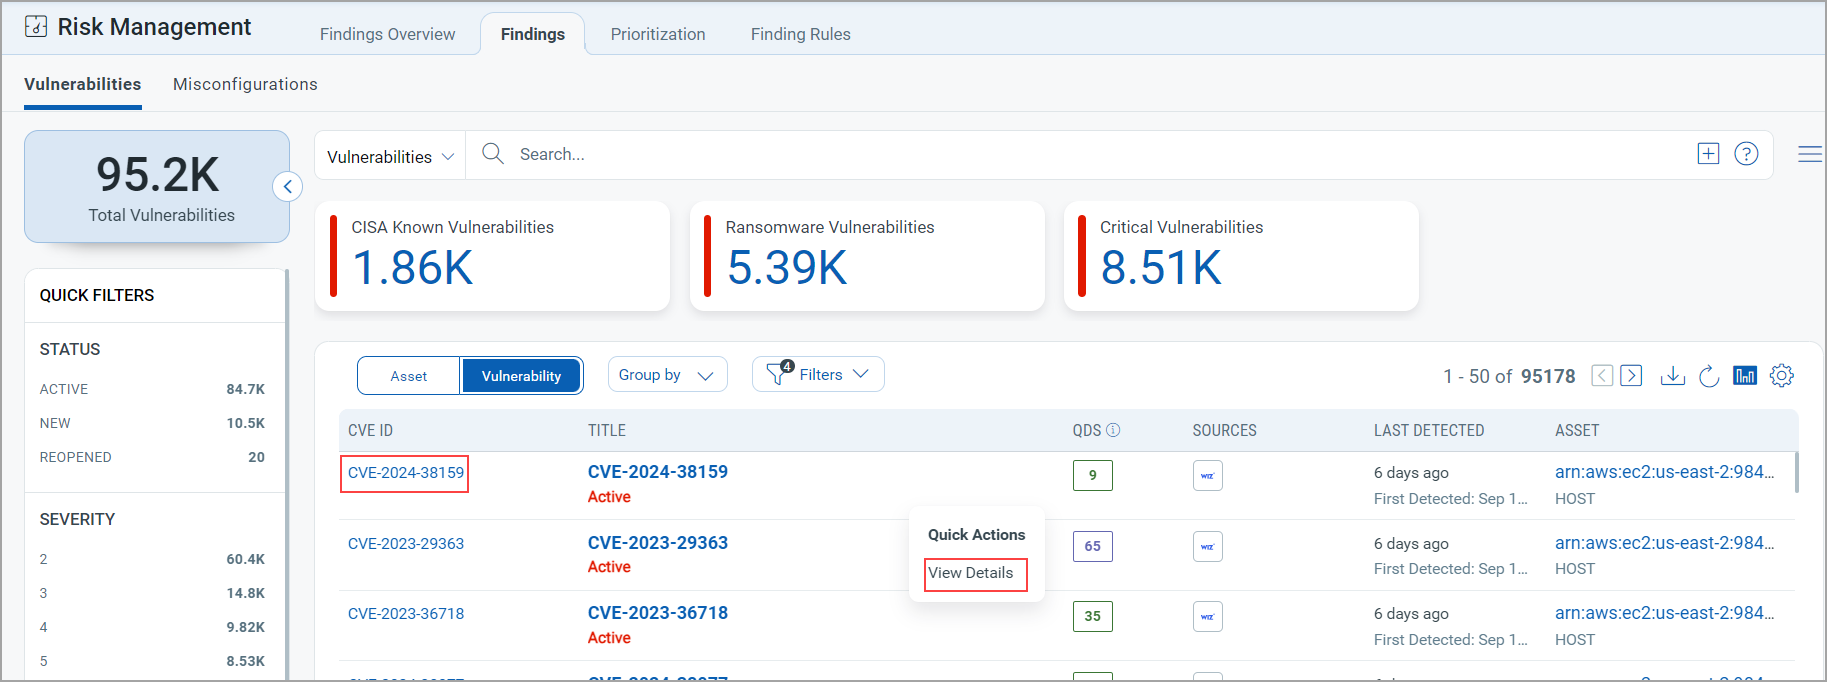
From the Vulnerability column, click View Details from the Quick Actions menu to view the following vulnerability details relating to the specific vulnerability:
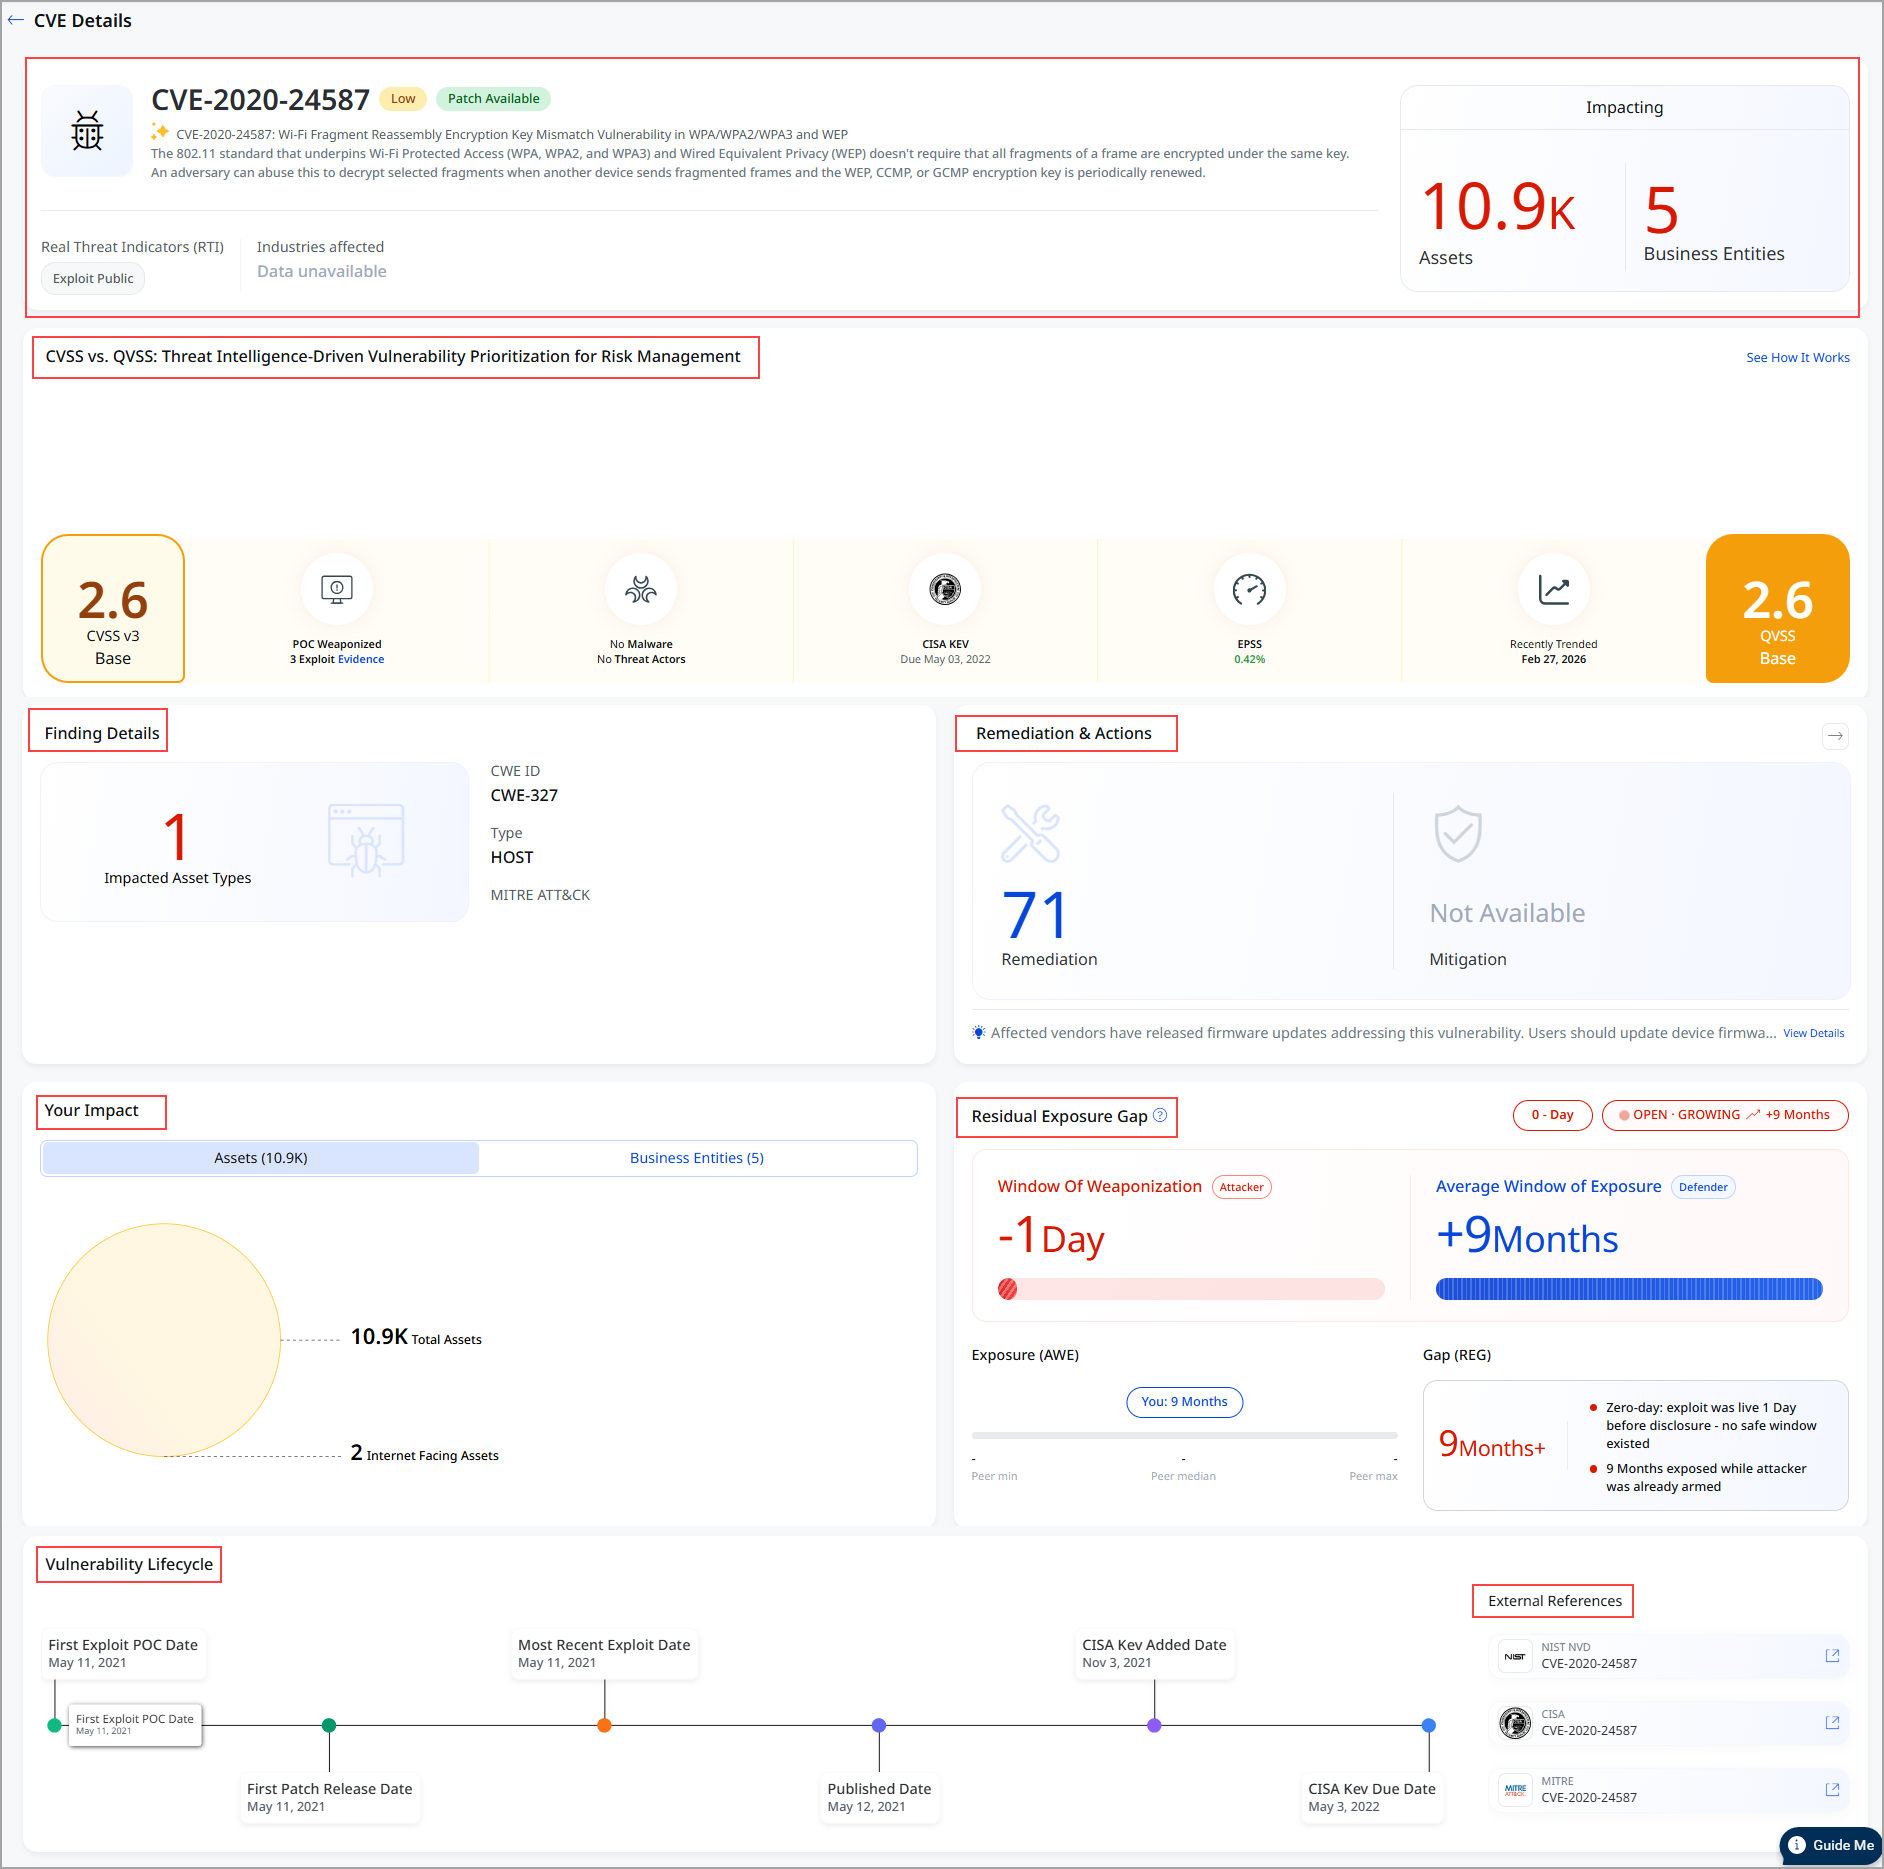
This Findings Details page provides a complete risk, impact, and remediation view of a selected vulnerability (CVE).
CVE Details page is displayed.
Refer to the following table for details on the fields.
| Field | Information |
|
Header This section displays the CVE ID, severity level (Medium), and Patch Available status. |
|
| CVSS vs QVSS Risk Comparison
This section compares technical severity with threat intelligence–based risk. |
Use this section to understand whether the vulnerability is technically severe and whether it is actively exploited.
|
| Finding Details
Provides classification and mapping information. |
Use this section to understand the findings.
|
|
Remediation & Actions |
Use this section to identify how to fix the vulnerability.
|
|
Your Impact Provides environment-specific exposure details. |
Use this to prioritize remediation based on exposure and external risk.
|
|
Residual Exposure Gap Provide deeper insights into vulnerability, exploitability, and remediation efficiency |
Use this to understand attacker timelines with real-world exploit data and measure remediation performance across assets
To know more about how to utilize these metrics, refer to the Residual Exposure Gap. |
| Vulnerability Lifecycle |
Use this to understand how long the vulnerability has been active and exploited. Timeline view showing:
|
|
Truconfirm
|
If you have TruConfirmed enabled, you can view the TruConfirm card on this page. The TruConfirm card gives security analysts a clear view of whether a vulnerability is truly exploitable in their environment, not just theoretically risky. By combining threat intelligence with validated evidence, these cards help teams prioritize what matters most. This card contains the following information:
|
Search Vulnerabilities
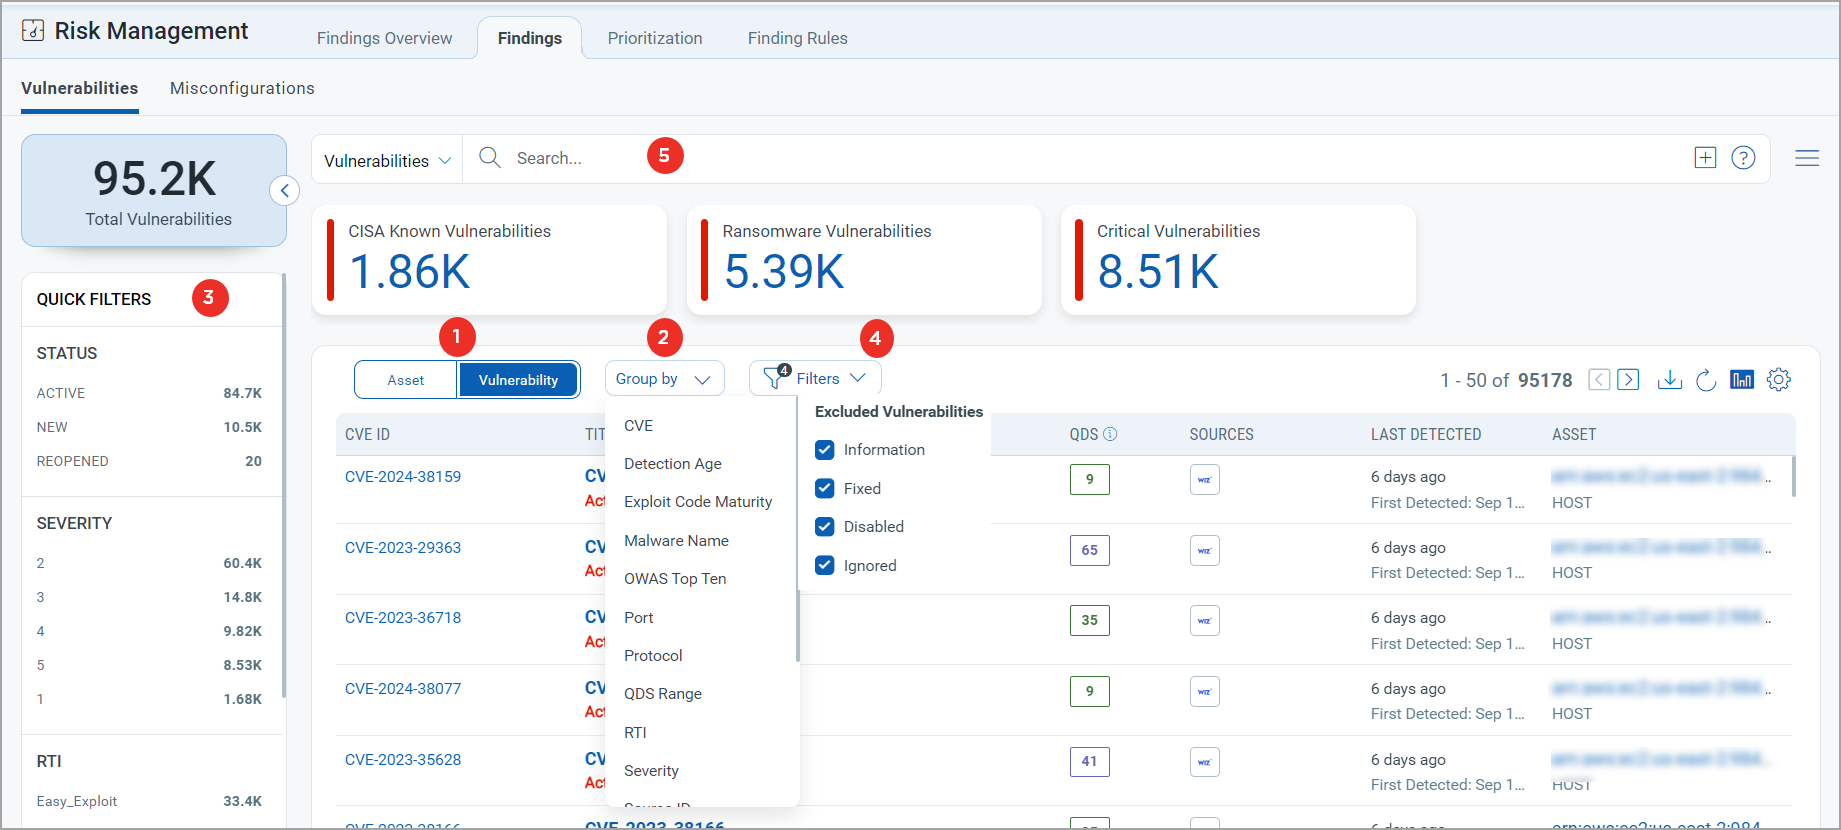
- Choose Vulnerability to display vulnerability data or Asset for asset data. You can easily browse the data list and explore details. For example, click the CVE 2021-40438 to view details for that vulnerability.
- The Group By option helps you organize your data. For example, you can select Group By Severity and then click any value listed in the Detection Count column to view the list of assets with the assigned severity.
- Use a filter. The filter option lets you choose the type of vulnerabilities to exclude from the data list.
- Use Quick Filters located in the left navigation. The Quick Filters option lets you choose the type of vulnerabilities to further filter them.
- Use search tokens to filter vulnerabilities further.
- Customize the display of rows and columns as per your needs. You can choose which columns to show or hide based on their preferences
Misconfiguration Findings
To view the misconfigurations detected on your assets, navigate to the Risk Management > Findings page and select Misconfiguration. You can also use group-by options and custom query capabilities. Following is the Misconfiguration data listed on the Findings page:
- Title: Indicates the rule or misconfiguration name
- Technology/Category: Indicates Technology and Category of the misconfiguration
- QVSS Base: Indicates QVSS Base Score, such as High, Critical, Low, and Medium
- Sources: Indicates the source of the misconfiguration.
- Impacted Asset: Indicates which asset is impacted
- Lifecycle Information: Indicates when the issue was first detected and whether it is currently active (Fail)
- Host Name: Indicates Host name
- IP Address: Indicates the IP address of the assets,
- TruRisk™ Score: Represents the score
- ACS: Indicates Asset Criticality Score
-
Operating System: Indicates Operating System
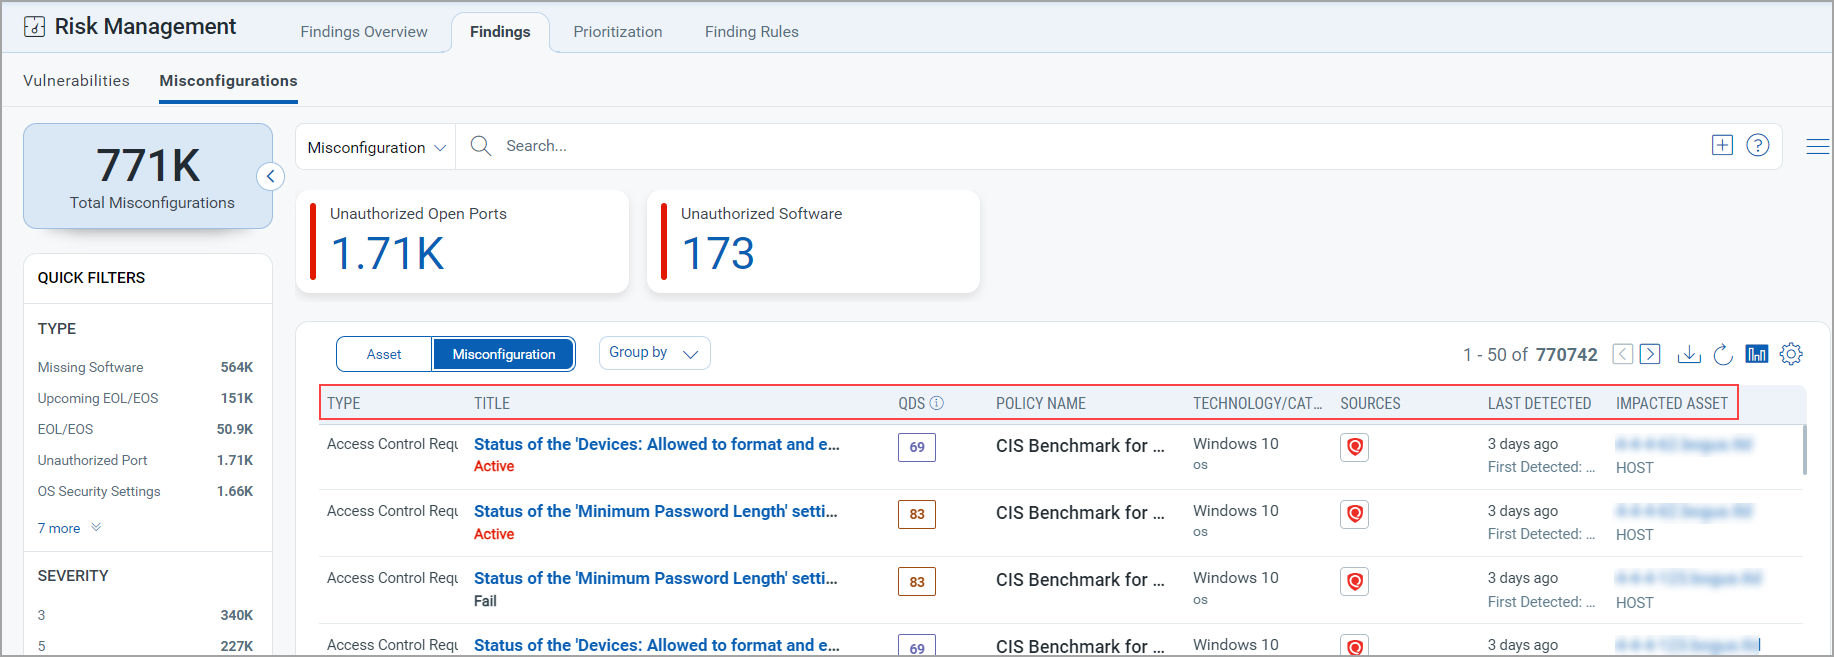
The following Misconfigurations screenshot under the Risk Management > Findings > Misconfigurations highlights its columns:
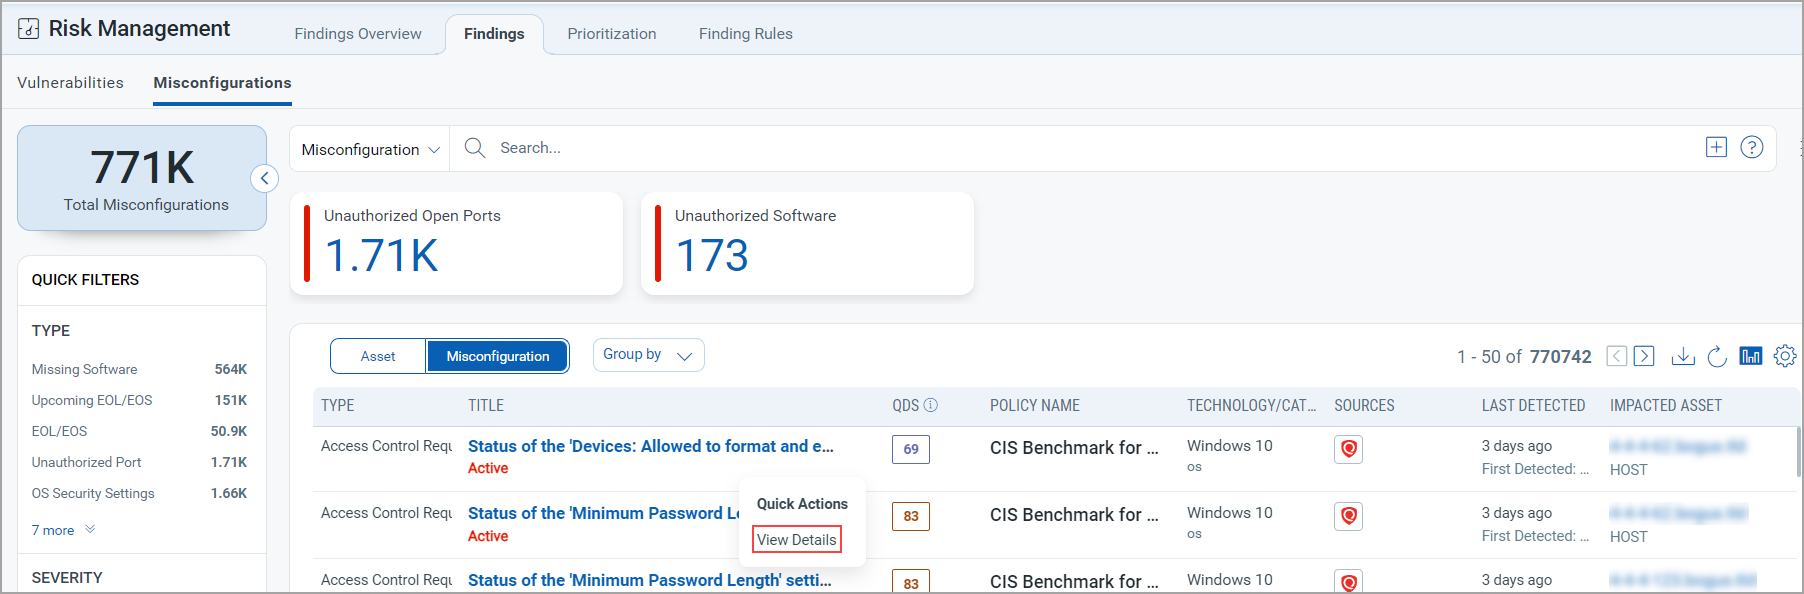
View Misconfiguration Finding Details
Click View Details from the Quick Actions menu to view the following details about a specific misconfiguration.
-
Summary: It displays basic details, reference ID, status, QDS, severity, and a description of the misconfiguration, along with details of the asset on which it is detected.
-
QDS Details: It displays the QDS contributing factors for the misconfiguration:
- Highest Contributing CVE:- Click the CVE number, and theAdditional Insights display the Technical Attributes, Recency, and Remediation.
- Associated Malware and Threat Actors: Click on the Malware count to view the data in the Additional Insightssection.
- Exploitability: It displays the date when the exploitability recently trended. TheRecencysection of the Additional Insights graph displays the time when the CVE trended.
- Additional Insights: When you click Additional Insights, it displays more information about the vulnerability' s Technical Attributes, Temporal Attributes, Trending, and Remediation.
- Detection Details: This section specifies:
- The detection rationale a logic of how a security vulnerability is identified.
- Misconfiguration impact and remediation guidance to fix the misconfiguration.
- Additional Details: Additional details about control/ CSAM rule and policy that is evaluated on an asset. It is supplementary information that provides further context about the policy and control.
- MITRE ATT&CK: MITRE Tactics and Techniques associated with the control that was evaluated on an asset.
- Sources: If the same misconfiguration is detected from multiple sources on the same asset, then this section displays the aggregated record created based on the merge rules and individual source records displaying the multiple sources from where the misconfiguration is detected.
Search Misconfigurations
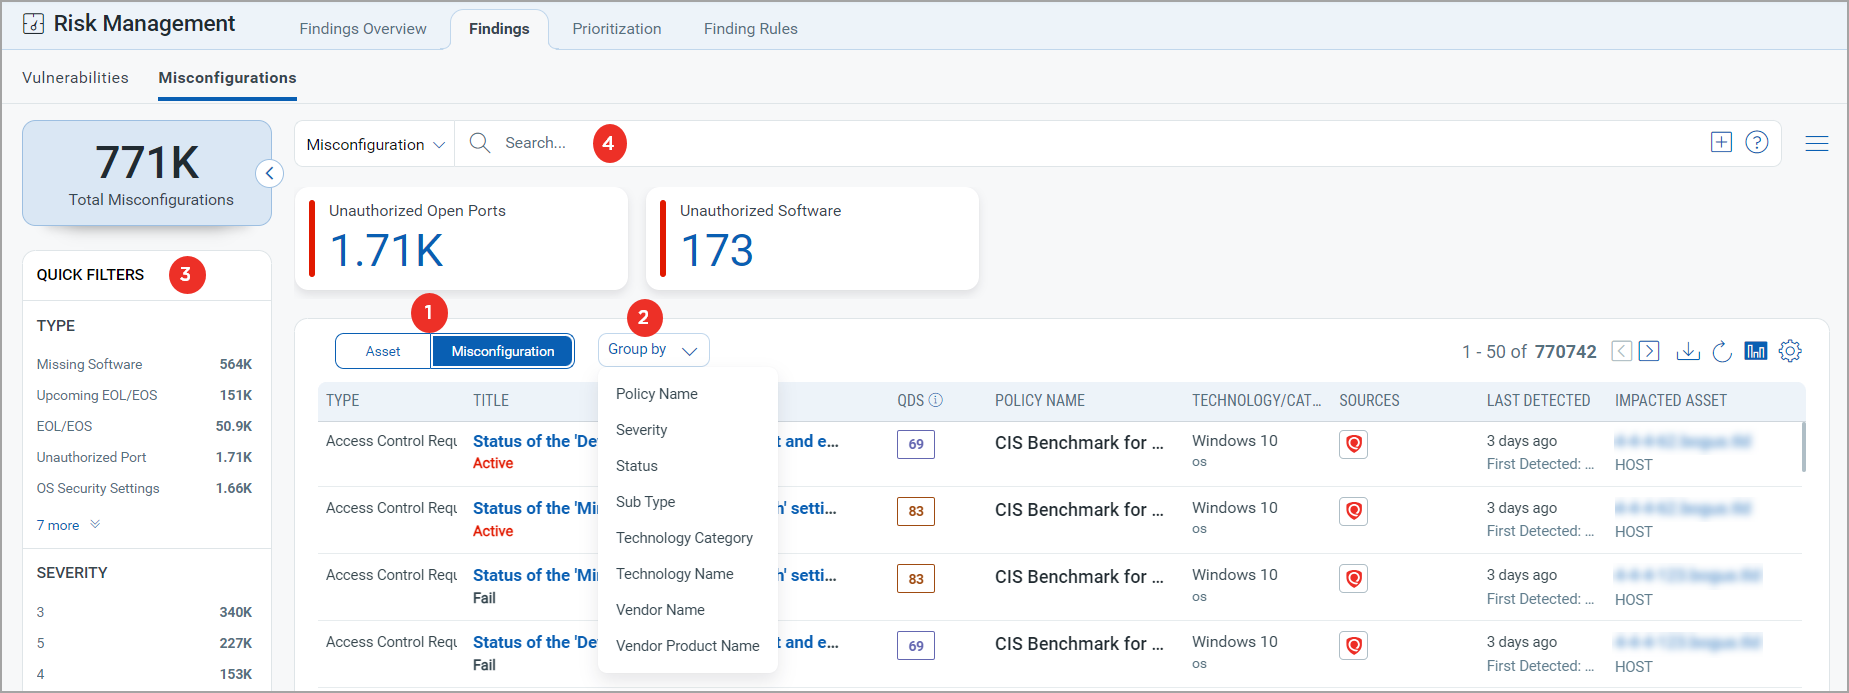
- Choose Misconfiguration to display misconfiguration data or Asset for asset data.
You can easily browse the data list and explore details.
For example, click the Title: EOS: Google Chrome 84.0.4147.125 Stable Channel to view details for that misconfiguration. - The Group By option helps you organize your data.
For example, you can select Group By Severity and then click any value listed in the Detection Count column to view the list of assets with the assigned severity. - Use a filter.
The filter option lets you choose the type of misconfiguration to exclude from the data list. - Use quick filters located in the left navigation.
The Quick Filters option lets you choose the type of misconfigurations to filter the misconfigurations further. - Use search tokens to further filter the data list.
- Download the report.
- Toggle the display of the bar chart using
 icon.
icon. - Customize the display of rows and columns as per your needs. You can choose which columns to show or hide based on their preferences.