Viewing CVEs
The CVEs tab provides a consolidated view of vulnerability intelligence categorized by recency, trending activity, and exploit status. It is divided into three sub-tabs, each offering focused insights and dynamically updated summary metrics.
To view the vulnerabilities detected on your assets, navigate to the Risk Management > Findings page and select Vulnerability. You can also use various metadata filters, group by options, and custom query capabilities.
Following is the CVE data listed on the CVEs page:
- Title: Indicates the CVE name
- QVSS: Qualys Vulnerability Scoring System (QVSS) is the scoring framework used in ETM to measure the severity of all security exposures, both vulnerabilities and misconfigurations, on a 0.0–10.0 scale.
- CVSS
- Exploitability Focus on vulnerabilities with POC or Weaponized exploits.
- Risk Factors: Indicates the conditions or attributes that increase the likelihood or severity of a vulnerability being exploited.
- Threat Actor
- WOW
- Asset Impact: Shows the potential damage or business effect if the vulnerability is successfully exploited.
- EPSS Score: Displays the Exploit Prediction Scoring System value that estimates the probability of the vulnerability being exploited in the near term.
- Detection Count: Represents the number of times this vulnerability has been identified across your monitored assets or environment.
- Source: Shows an icon for where the information about the CVE came from. This helps you judge how much to trust a detection. New sources appear as they become available. If a source does not have its own icon yet, a default icon is shown.
- Malware: Click a malware entry to open the risk findings related to it.
- Technical Impact and Automatable: Show the CISA BOD 26-04 risk factors for the CVE. These columns are hidden by default. To show them, click Settings > Columns, and then select the checkboxes.
-
The following Vulnerabilities screenshot under the Risk Management > Findings tab highlights its columns:

Search CVEs
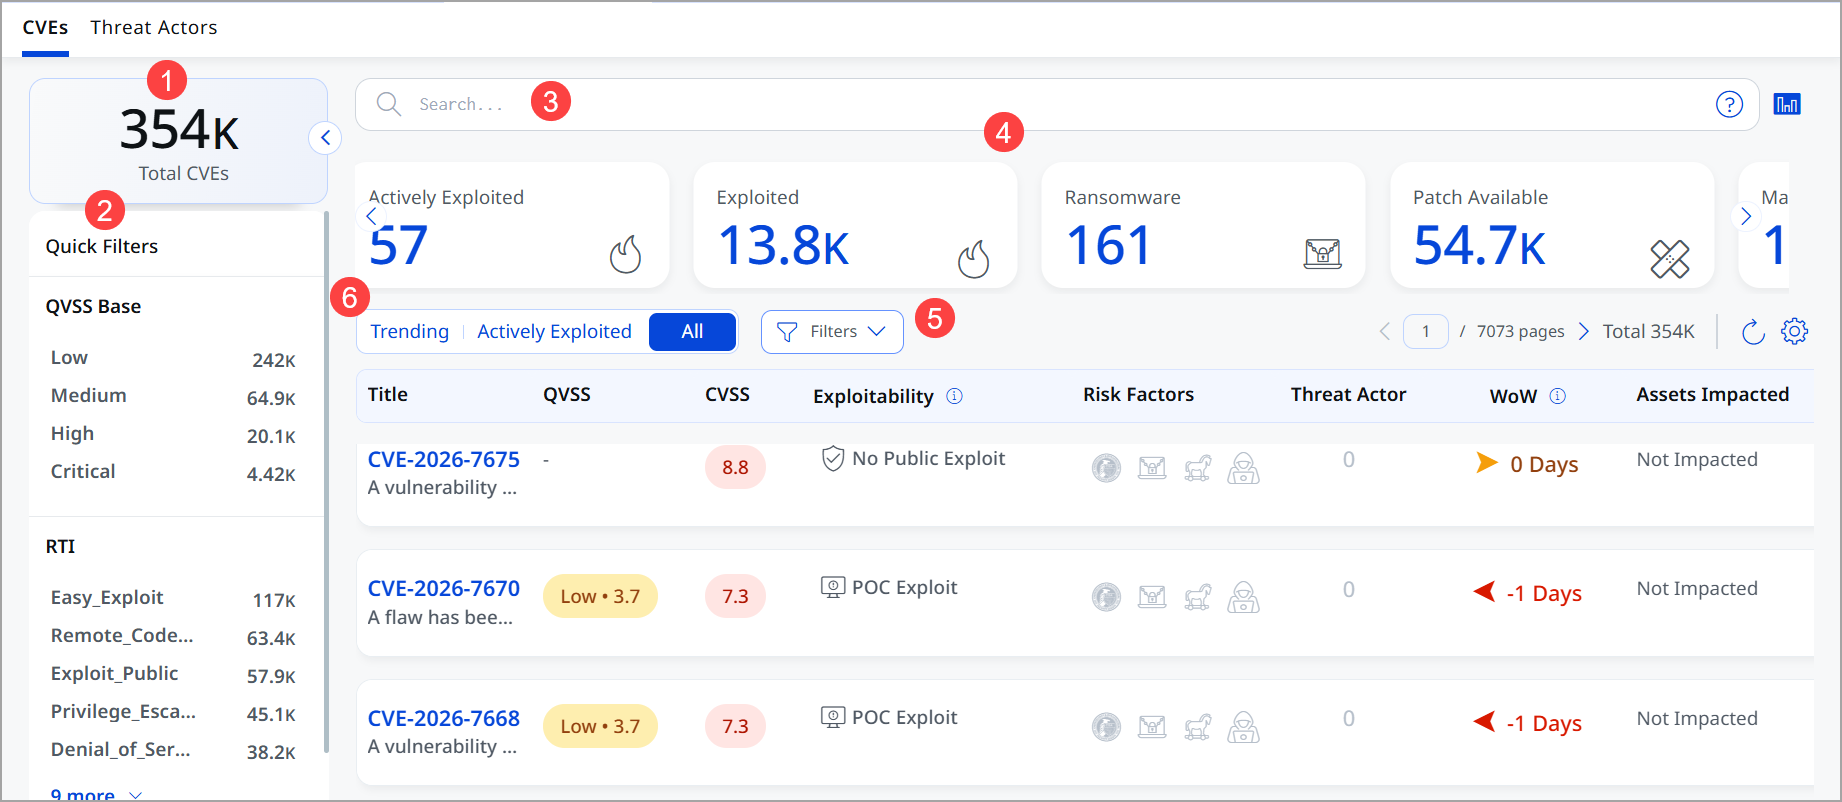
- Choose Vulnerability to display vulnerability data or Asset for asset data. You can easily browse the data list and explore details. For example, click the CVE 2021-40438 to view details for that vulnerability.
- The Group By option helps you organize your data. For example, you can select Group By Severity and then click any value listed in the Detection Count column to view the list of assets with the assigned severity.
- Use search tokens to filter vulnerabilities further. Use a filter. The filter option lets you choose the type of vulnerabilities to exclude from the data list.
- Use Quick Filters located in the left navigation. The Quick Filters option lets you choose the type of vulnerabilities to further filter them.
- Use the Filters menu to narrow the CVE list. Select IMPACTED to show only the CVEs that affect your assets. The filter appears as a tag next to Filters, and the funnel icon shows how many filters are applied. To remove the filter, click X on the tag, or clear the checkbox.
- Customize the display of rows and columns as per your needs. You can choose which columns to show or hide based on their preferences
More Ways to Search CVEs
You can use QQL to search the CVE list by:
- Industry: The search suggests the supported industries as you type. The search applies across all tabs of the CVEs page.
- Alias: Find a CVE by its common name. The filter applies to the list, counts, and links.
- Source: Enter the source as a text value.
- CISA BOD 26-04 risk factors: Filter by technical impact, whether an attacker can automate the attack, and remediation SLA.
- Qualys mitigation: Find vulnerabilities that Qualys can mitigate for you, and the type of mitigation. Mitigation lowers the risk of an attack, for example with a virtual patch, without changing the affected software. Remediation, such as patching, fixes the vulnerability itself.
- TruConfirm coverage: Find CVEs that TruConfirm can assess using Cloud Agent, a scanner, or both. Use this to plan assessments for the CVEs your setup can cover.
For the list of tokens and examples, see search tokens.
Sub-Tabs in the CVEs
The CVEs tab contains the following views:
Newly Added
Shows CVEs that have recently been added to the Qualys threat intelligence database.
Use this tab to understand newly emerging risks as they appear in the ecosystem.
Trending
Displays CVEs that are currently gaining traction across the threat landscape.
These vulnerabilities are increasingly observed in real-world exploitation, scanning, or discussion.
When you open this page by clicking View All in the Trending CVEs in Your Industry section of the TruLens home page, the list, counts, and links are filtered by your industry. When you open the KnowledgeBase directly, the list is not filtered by your industry.
Actively Exploited
Contains CVEs that are currently being exploited in the wild.
This view highlights the highest-priority items requiring immediate attention.
Dynamic Cards and Key Indicators
Each sub-tab presents a set of summary cards that reflect data relevant to the selected tab.
These cards show counts and intelligence for:
- CISA Known Exploits: Displays the number of vulnerabilities listed in the CISA Known Exploited Vulnerabilities catalog.
- Ransomware Vulnerabilities: Shows the count of vulnerabilities associated with ransomware activity.
- Actively Exploited: Indicates how many vulnerabilities are currently being exploited in the wild.
- Impacted: Reflects the number of assets affected by the vulnerabilities in the selected view.
- Patch Available: Shows how many vulnerabilities have a vendor-released patch available for remediation.

Dynamic Card Update by Tab Selection
Each time you switch between Newly Added, Trending, or Actively Exploited tabs, the cards automatically update to display metrics relevant to that category.
Example:
When you are in the Newly Added tab, the Patch Available card indicates the number of newly added CVEs that have a patch available.
Clicking that card opens a list of only those CVEs (from the Newly Added set) that have a patch.
Interactive Workflow
The cards in each sub-tab serve as filters:
- Select a sub-tab (for example, Newly Added).
- Click a card such as Patch Available, CISA KEV, or Ransomware Vulnerabilities.
The UI displays the filtered list of CVEs that belong to the selected sub-tab and the chosen card category.
This makes it easy to drill down into exactly the type of CVEs you want to analyze.
The CVEs tab helps you quickly explore vulnerabilities based on:
- When they emerged (Newly Added)
- How relevant or widespread they are (Trending)
- Whether they are being exploited now (Actively Exploited)
The cards act as dynamic, context-sensitive filters, ensuring that the data displayed always aligns with the selected sub-tab.
View CVE Details
Click a CVE to open its details page. The details page includes the following information:
- Industries: Lists the industries in which the CVE is trending. This section was earlier called Affected Industries. A trend icon marks the industries that are trending now, and your own industry is highlighted, so you can quickly tell if the CVE is trending in your industry.
- Alias: Shows the common name of the CVE, if it has one. If there is no alias, this section is hidden.
- Source: Shows an icon for where the information about the CVE came from.
Risk Findings in the MITRE ATT&CK Tab
The MITRE ATT&CK tab includes a Risk Findings column. It shows how many risk findings in your environment match each tactic, and each technique within that tactic, for the CVE.
- Click a technique count to open the matching risk findings, filtered by that tactic and technique.
- Tactic counts are shown for context only and you cannot click them.
Finding CVEs You Can Mitigate with Qualys
Patching is the preferred way to fix a vulnerability, but a patch is not always available, and even when it is, deploying it can take time because of testing, change windows, or business-critical systems that can't be restarted. During that gap, the vulnerability remains open to attackers.
Mitigation reduces this risk by lowering the chance that a vulnerability can be exploited, without waiting for a patch. Knowing which CVEs Qualys can mitigate helps you protect assets sooner and focus manual effort on the CVEs that have no mitigation option.
Use the following tokens on the CVE listing page to find these CVEs:
finding.isQualysMitigableshows whether Qualys can mitigate the CVE.finding.qualysMitigableTypeshows the type of mitigation Qualys provides for the CVE.
How to Use These Tokens
Protect assets while a patch is pending. Search for CVEs that Qualys can mitigate, and apply mitigation to reduce exposure until the patch can be deployed.
finding.isQualysMitigable: TRUE
Plan work by mitigation type. Filter CVEs by mitigation type to group similar remediation work and assign it to the right team.
finding.qualysMitigableType: MITIGATION_TYPE
Find high-risk CVEs with no mitigation option. Search for CVEs that Qualys can't mitigate so you can prioritize them for patching or compensating controls.
finding.isQualysMitigable: FALSE
Mitigate the most urgent threats first. Combine mitigation tokens with other tokens to find CVEs that an adversary can exploit automatically and that could give an attacker total control of the asset, but that Qualys can mitigate right away.
finding.isQualysMitigable: TRUE and finding.isAutomatableByAdversary: TRUE and finding.technicalImpact: "TOTAL CONTROL"
CPE and CWE Information in CVE Details
CVE Details now shows the products and weaknesses associated with each CVE, so you can understand what a vulnerability affects and why it exists without leaving the page.
- Common Platform Enumeration (CPE) is a standardized naming scheme, maintained by NIST, that identifies software, operating systems, and hardware by vendor, product, and version. The CPEs listed for a CVE tell you exactly which products and versions are vulnerable.
- Common Weakness Enumeration (CWE) is a list of software and hardware weakness types, maintained by MITRE. The CWE listed for a CVE tells you the underlying flaw that makes the vulnerability possible.
Use CPE information to check whether the product versions in your environment are vulnerable and to share precise details with the teams responsible for patching. Use CWE information to understand the root cause of a vulnerability and to spot recurring weakness types across your findings.
View Finding Details for a CVE
- Open the CVE to go to the CVE Details page.
- In the Finding Details section, find CWE and CPE. The number under each shows how many entries the CVE has.
- Click the CWE or CPE count. The Finding Details panel opens on the matching tab.
The panel has three tabs: CWE ID, CPE Details, and MITRE ATT&CK. The number beside each tab name shows how many entries it contains. A count of 0 means no entries are available for that CVE.
Understanding the CWE ID Tab
The CWE ID tab lists each weakness associated with the CVE, with the following information:
- CWE Name is the name of the weakness, such as Deserialization of Untrusted Data.
- CWE ID is the unique identifier for the weakness, such as CWE-502.
- Language is the language of the weakness information, such as EN for English.
- URL is a link to the weakness definition on the MITRE CWE website, where you can read a full description, examples, and suggested mitigations.
Understanding the CPE Details Tab
The CPE Details tab lists each affected product with the following information:
- CPE URI is the full CPE name that uniquely identifies the product.
- Category is the type of product, such as Application.
- Vendor is the company or organization that makes the product.
- Product is the name of the affected product.
- Version is the affected version of the product.
For example, the CPE URI cpe:2.3:a:efs_software:easy_chat_server:2.1 identifies an application (a) from the vendor Efs Software, the product easy_chat_server, version 2.1.
Find Specific CPEs
When a CVE affects many products, use the following options to narrow the list:
- Use the Search box to find a CPE by name, vendor, or product.
- Use the Type filter to show only products of a certain category.
- Use the Vendor filter to show only products from a certain vendor.
Prioritize CVEs Using CISA BOD 26-04
TruLens supports risk-based prioritization in line with CISA BOD 26-04 by showing CISA Stakeholder-Specific Vulnerability Categorization decision points for each CVE. SSVC helps you decide how urgently to act on a vulnerability based on factors such as how easily it can be exploited and how much damage exploitation could cause.
Use the following tokens in the search bar on the CVEs tab to filter CVEs by these decision points:
finding.isAutomatableByAdversaryfilters CVEs by whether an adversary can automate exploitation of the vulnerability.finding.technicalImpactfilters CVEs by the level of control an adversary would gain upon exploitation: total control, partial control, or unknown.
For example, to find the CVEs that pose the most urgent risk, search for CVEs that are automatable and give an adversary total control:
finding.isAutomatableByAdversary: TRUE and finding.technicalImpact: "TOTAL CONTROL"
Download CVEs
You can download the CVE list as a CSV file.
- On the CVEs page, click the Download icon above the list, next to the Refresh and Settings icons.
The Download Formats window opens. - Under Select Available Format, select Comma-Separated Value (CSV).
- Under Select columns to download, select the columns you want in the file. By default, all columns are selected. To select or clear all columns at once, use Select All.
- Click Download.
The download starts shortly. The time it takes depends on how much data you download.