Understanding Trulens Home
The TruLens Overview is a dashboard that provides security teams a real-time, clear view of cyber risk. It combines threat intelligence, vulnerability exposure, asset impact, and performance benchmarking in one place.
Instead of showing separate data points, the dashboard links them together: Threat actors, exploited vulnerabilities, impacted assets, and remediation performance
This helps both technical and executive teams move quickly from awareness to action. Each section adds a layer of insight, so users can prioritize, investigate, and respond efficiently.
Trending Threat Actors Targeting Your Industry
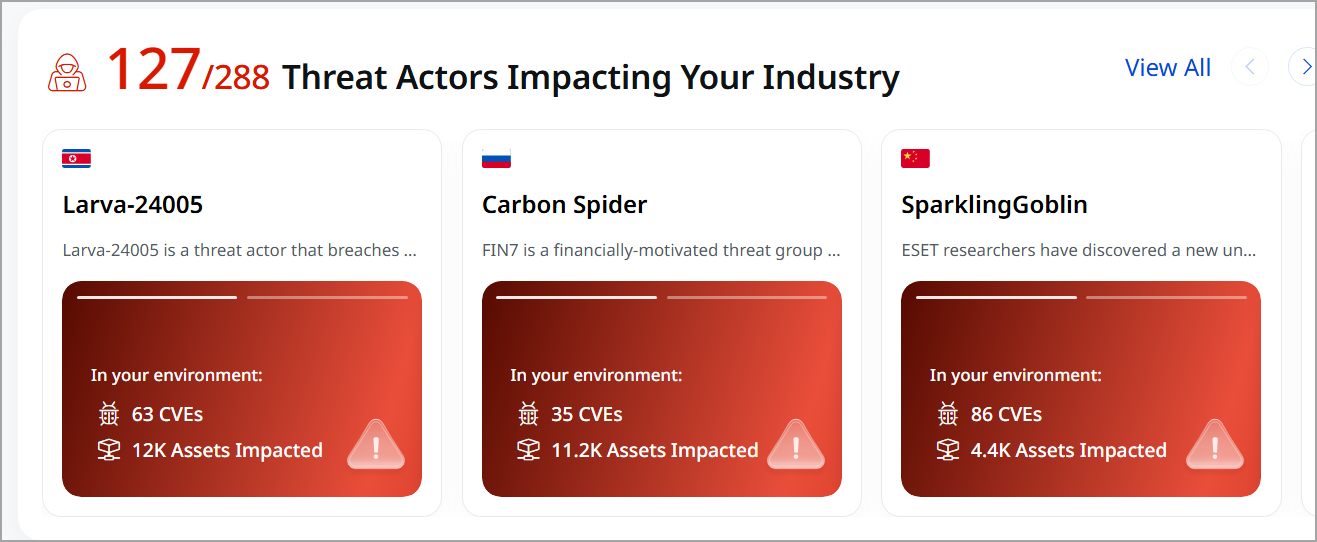
This section shows the threat actors that are trending against your industry. TruLens uses the industry set in your subscription profile, so you do not need to set anything up. The card shows the total number of threat actors for your industry and how many of them affect your assets.
When you click View All, the Threat Actors page opens with your industry filter already applied. For details, see View Threat Actors.
This section shows you how many active threat actors are relevant to your industry. For example, you might see that 127 out of 288 actors are currently affecting you. Each card highlights a different threat group, such as financially motivated groups, nation-state actors, or ransomware groups.
From this card, you can
- View which threat actors are most active in your environment.
- Find out how many CVEs these groups are exploiting.
- Learn the scope of exposure, including which assets are impacted.
The card highlights the Top 10 Threat Actors from this list for quick visibility. These are prioritized based on maximum impact on your assets. You can click View All to explore the complete list.
Each Threat Actor card displays a quick summary of a specific threat actor:
- Threat Actor Name ( for example, Larva-24005, Carbon Spider, SparklingGoblin)
- Short Description: Brief context about the threat actor (for example, financially motivated group, nation-state actor, etc.)
- Impact on your environment
This is the most critical part of the card:- CVEs (Vulnerabilities)
Number of known vulnerabilities associated with this threat actor in your environment - Assets Impacted
Number of your assets currently affected by those vulnerabilities
- CVEs (Vulnerabilities)
- Targeted Countries: Countries where the threat actor actively conducts or has conducted attacks.
- Targeted Industries: Industries that are specifically targeted by the threat actor based on their attack objectives.
Insights
The Insights section highlights key risk observations and actionable intelligence based on your environment, vulnerabilities, and threat activity.
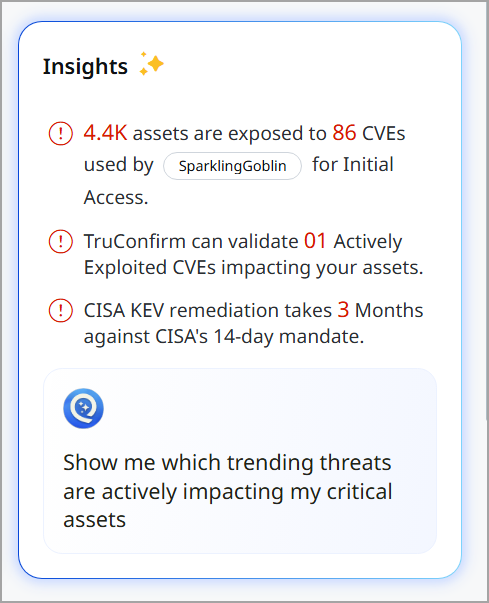
Insights provides you with the visibility to
- Asset Exposure to Threat Actor Activity
Indicates how many of your assets are exposed to vulnerabilities being actively used by a specific threat actor (for example, SparklingGoblin). It helps identify real-world attack risk. - Exploit Validation (TruConfirm)
Displays how many vulnerabilities in your environment are actively exploited and can be validated.This insight is visible if TruConfirm is enabled for your account
- Helps prioritize high-confidence, exploitable risks.
- Remediation Performance Gap
Compares your remediation time against industry standards (e.g., CISA’s 14-day guideline). It highlights if you are behind on fixing critical vulnerabilities.
Trending CVEs in Your Industry
This section lists the CVEs that are trending in your own industry, instead of a general trending list. TruLens uses the industry set in your subscription profile. No setup is needed.
A CVE appears in this list only when both of these are true:
- At least one industry is trending for the CVE.
- The CVE was last seen trending within the past 30 days.
When you click View All, your industry carries over to the CVE list in the KnowledgeBase, including its counts and links. If you open the KnowledgeBase directly, the list is not filtered by your industry.
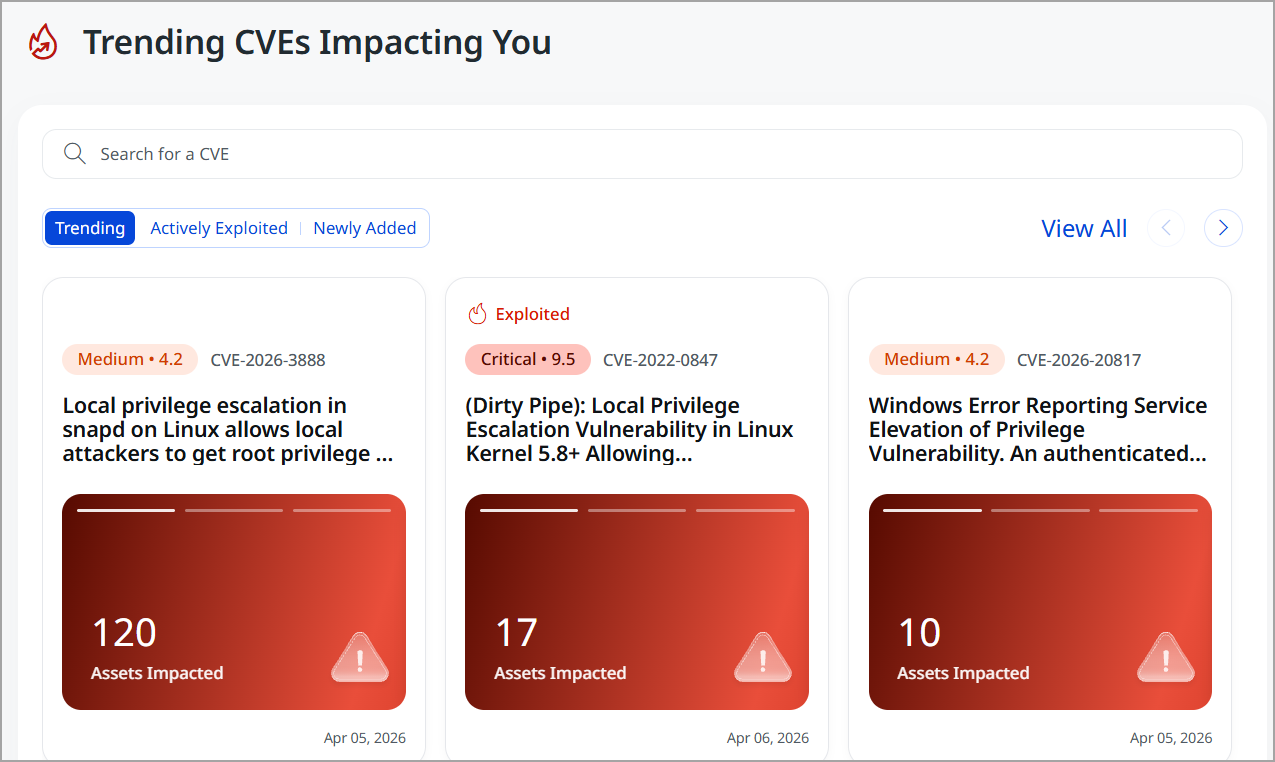
This section highlights recent and relevant security vulnerabilities (CVEs) that may affect your environment. It displays you to identify vulnerabilities that are currently gaining attention in the cybersecurity landscape and determine whether they require immediate action.
The search bar helps to look up a specific CVE identifier. This makes it easy to investigate known vulnerabilities and check whether they are relevant to the organization’s assets or technology stack.
You can use the three filtering options that organize vulnerabilities by their level of urgency and relevance:
- Trending
Displays vulnerabilities that are currently receiving significant attention across the security community, often due to increased discussion, exploitation attempts, or rapid adoption in attack campaigns. - Actively Exploited
Lists vulnerabilities that are confirmed to be exploited in real-world attacks. These typically require immediate prioritization for patching or mitigation. - Newly Added
Shows vulnerabilities that have been recently published or added to the platform’s vulnerability intelligence database.
The View All link opens the complete vulnerability list, allowing analysis and investigation.
Overall, this section provides a quick, intelligence-driven overview of high-visibility vulnerabilities, helping security teams prioritize remediation efforts and maintain awareness of emerging threats.
Card-based display of Actively Exploited CVEs. Each CVE card includes labels such as:
- Ransomware association: Indicates whether the CVE is linked to known ransomware campaigns.
- Malware activity: Shows if active malware families are exploiting this vulnerability.
- Threat actor involvement: Highlights whether specific threat groups are known to target the CVE.
- CISA KEV exposure: Flags if the vulnerability is listed in the CISA Known Exploited Vulnerabilities catalog.
- Patch availability: Specifies whether a vendor-issued fix is available for remediation.
You can view the CVE details by clicking CVE ID.
Assets impacted by trending CVEs
The card provides geographical distribution of assets impacted by trending CVEs, highlighting regions with highest exposure. The global map is the primary visualization that highlights where impacted assets are located. Red markers indicate regions with assets affected by currently trending CVEs. .
Region filter: A dropdown allows you to scope the visualization. You can filter to specific regions for targeted analysis.
Summary Metrics (Right Panel): This section shows the number of assets impacted by trending CVEs and the number of distinct vulnerabilities that are causing this impact. For instance, the screenshot indicates that 5 assets are currently affected by the trending CVEs, with 3 distinct CVEs contributing to this situation.
CVE details card display ransomware association, malware activity, threat actor involvement, CISA KEV exposure, and patch availability.

Peer & Performance Benchmarking
This section shows how your organization's security performance compares with peer organizations in your industry. Use it to see where you stand, identify the areas where you're falling behind, and prioritize improvements.
Each metric appears on its own card, with your performance and the peer comparison shown together, so you can review them at a glance. Each card includes:
- Your organization's performance: Your value for the metric, such as a vulnerability count or a remediation time.
- Performance tier: Where you rank among your peers, for example, "You're currently in the lowest tier of performers."
- Peer & Industry Comparison: A bar that shows the peer minimum, median, and maximum values, with a You marker showing where your value falls.
Key metrics shown:
- EOL/EOS Critical Vulnerabilities: Number of critical vulnerabilities found on end-of-life or end-of-support assets.
- Ransomware Vulnerabilities: Count of vulnerabilities associated with known ransomware activities.
- MTTR for Critical CVEs: Average time taken to remediate vulnerabilities classified as critical CVEs.
- MTTR for CISA KEV: Average remediation time for vulnerabilities listed in the CISA Known Exploited Vulnerabilities catalog.
For all four metrics, a lower value indicates better performance. The green end of the bar represents the best performers, and the red end represents the lowest performers.

Top 5 Threat Categories in your Industry
This section highlights the top threat themes driving risk in your industry. This section addresses the various types of threats that are influencing the risk landscape for organizations similar to your organization.
Categories include:
- Ransomware-as-a-Service (RaaS): Threat actors leveraging subscription-based ransomware kits to launch scalable attacks.
- Supply Chain Compromise: Attacks executed by exploiting vulnerabilities in third-party vendors or software dependencies.
- Data Exfiltration Malware: Malware designed to stealthily extract sensitive data from compromised systems.
- Business Email Compromise (BEC): Social engineering attacks that manipulate email channels to fraudulently access funds or information
- Targeted Espionage Actors: Advanced threat groups conducting focused, long-term campaigns to steal strategic or confidential data.
