Enterprise TruRisk Management Release 1.5
October 03, 2025
Support for Mitigating Vulnerabilities
With this release, we are extending support for Mitigation of Vulnerabilities to provide better visibility, search, and analysis of remediation efforts. An attacker can exploit the vulnerability to gain remote access to servers, admin rights on user accounts, or control over applications or devices.
Mitigation refers to the steps taken to reduce or eliminate the risk of exploitation. You can now identify vulnerabilities based on the mitigation methods applied. Typical mitigation methods include: applying security patches or hot fixes, updating outdated libraries, enforcing Multi-Factor Authentication(MFA), and so on.
Mitigation Information Visibility on Findings Tab
You can now view the Mitigation information directly on the listing page under the Vulnerabilities tab. By checking this information, you can reduce the risk of security issues.
To search for vulnerabilities that are mitigated, you can use a QQL query related to mitigation.
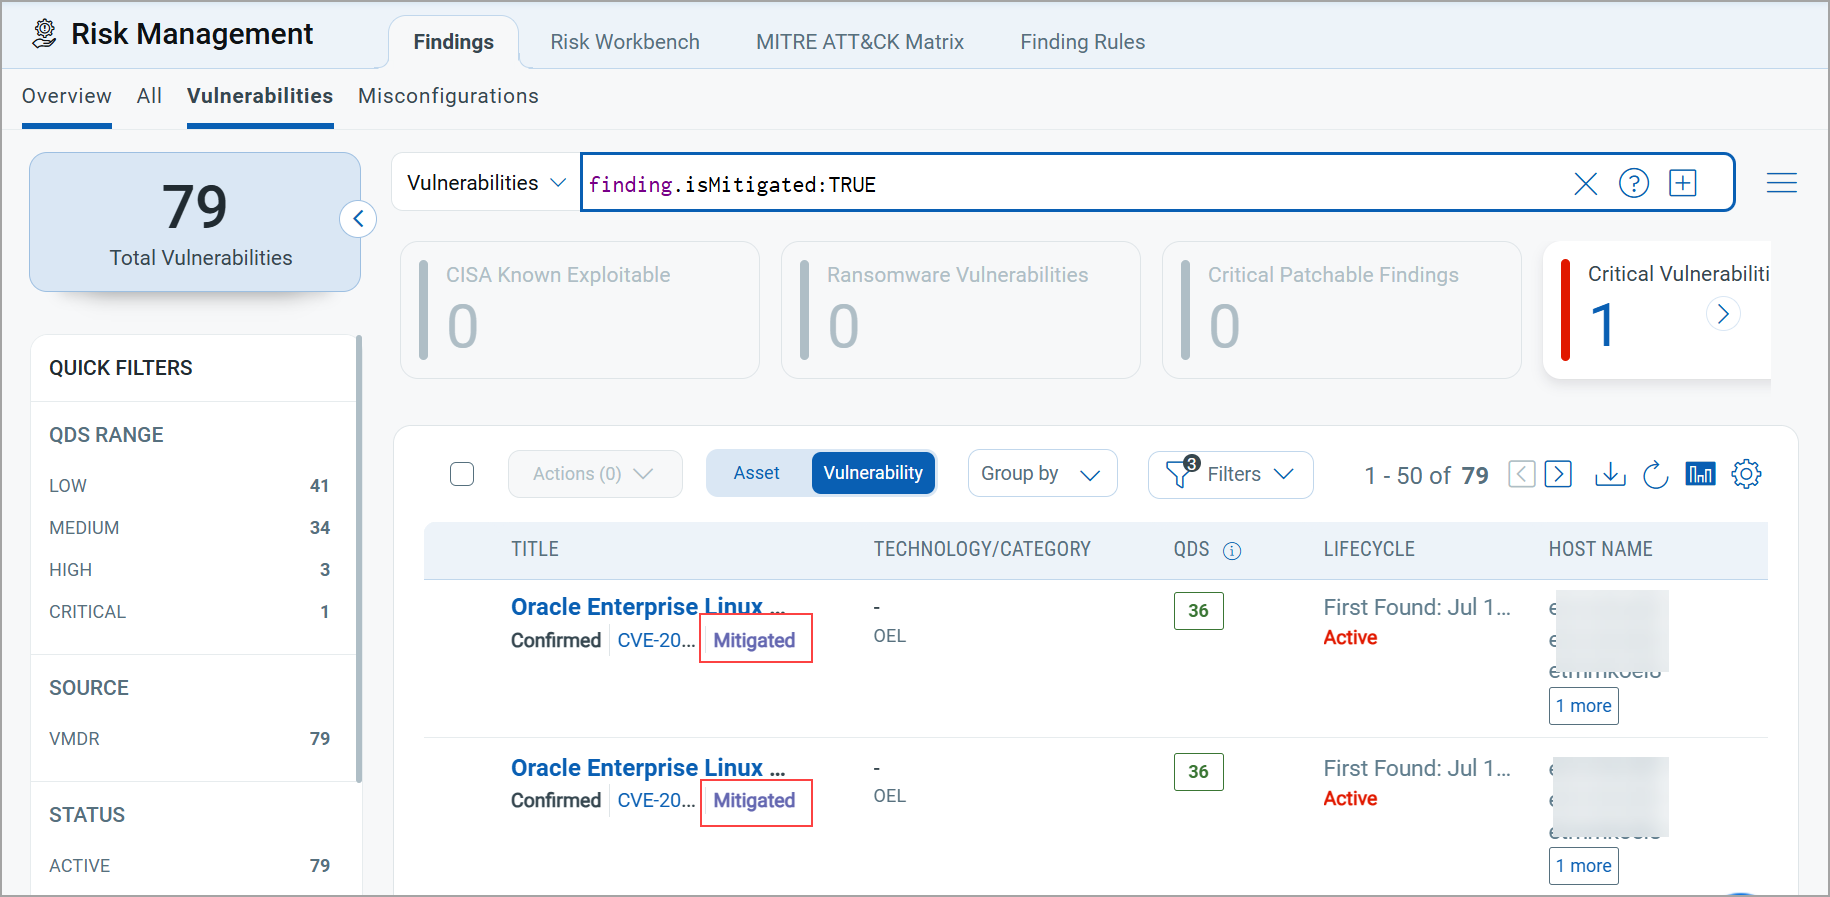
When a vulnerability is mitigated, it indicates that measures have been implemented to reduce or eliminate the risk of exploitation. Knowing the mitigation method for a vulnerability is very useful. It helps you make informed, risk-based decisions. You can utilize mitigation method information for prioritization based on Mitigation Options. For example, if a patch is not immediately available, you can apply workarounds such as firewall rules or service disablement to reduce risk. If a critical CVE has no patch yet, but the vendor suggests disabling Server Message Block v1, you can quickly mitigate exposure while waiting for a permanent fix.
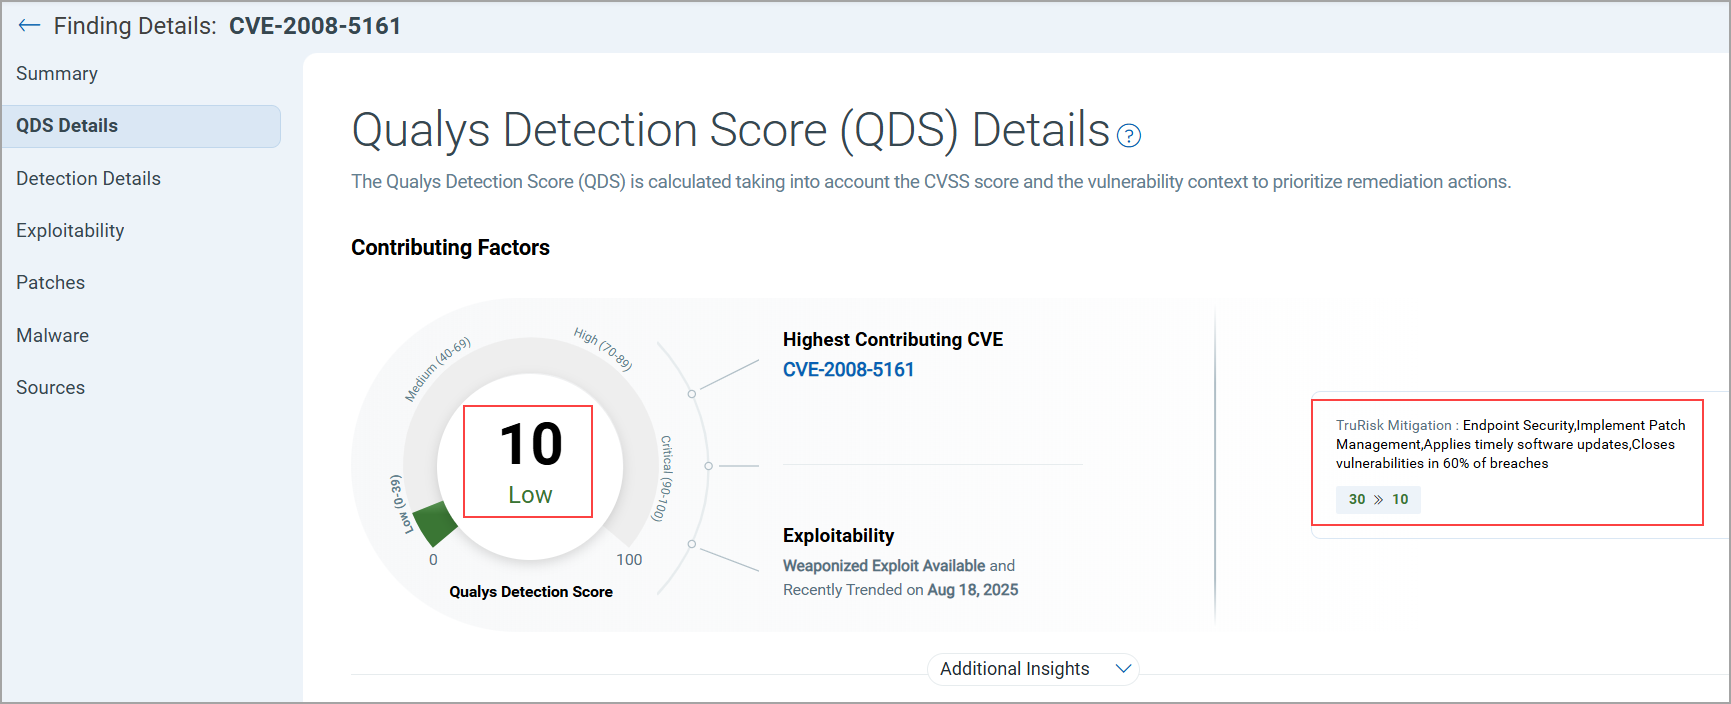
Mitigation Information
The QDS score displays both the previous score and the score after mitigation when hovered over.
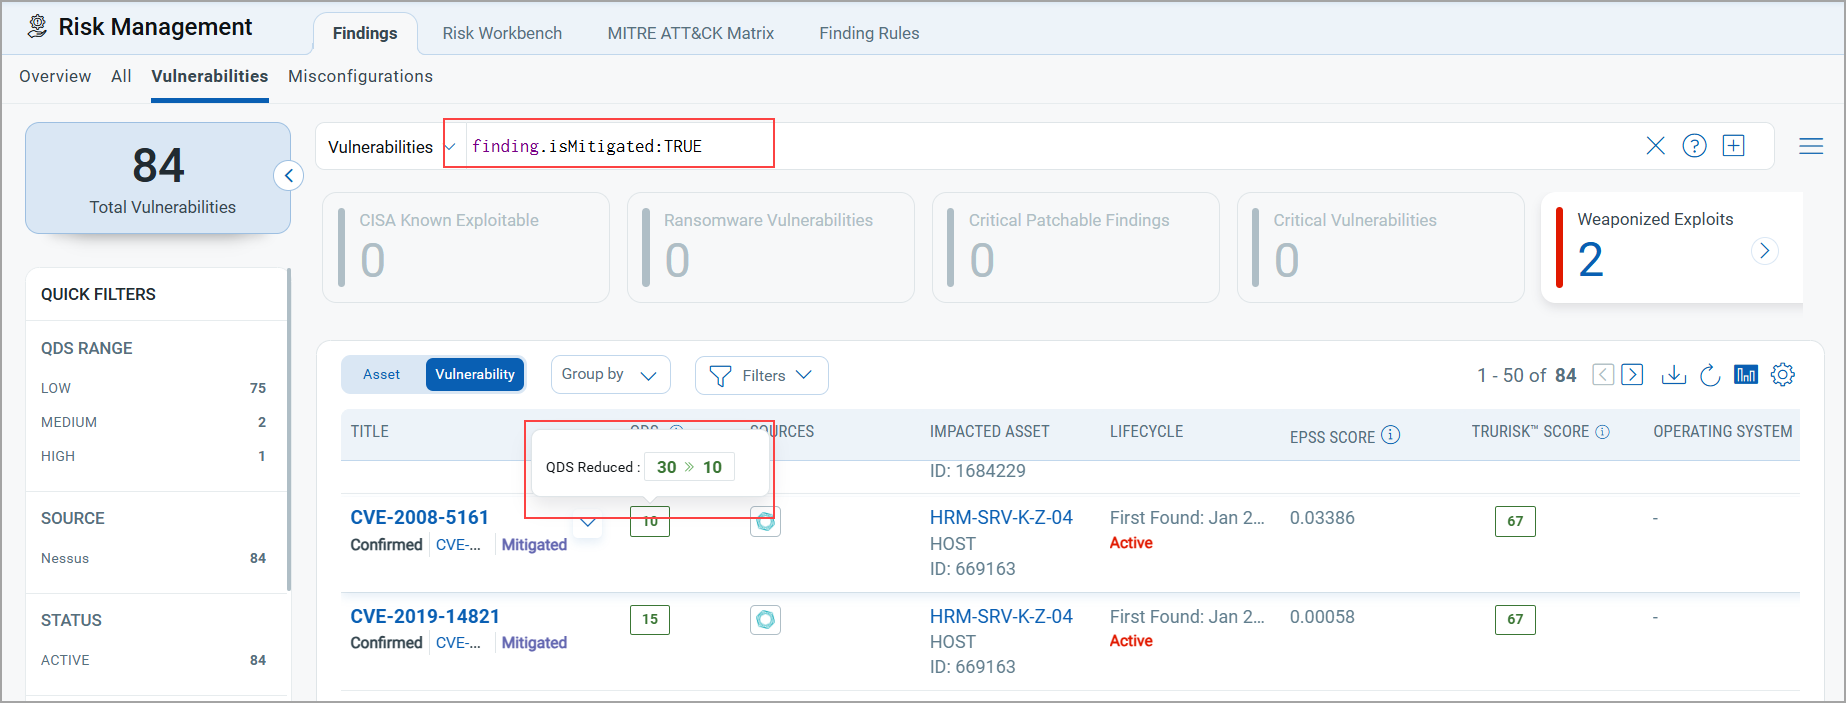
You can also view details on the QDS Details page, along with the mitigation method upon clicking the QDS score.
New Tokens Support for Mitigation
We have introduced two new tokens to get details related to mitigation.
| Token | Tab | Description |
|---|---|---|
|
finding.isMitigated |
Risk Management > Findings > Vulnerability Risk Management > Findings > Misconfiguration |
Use the token value as TRUE or FALSE to find vulnerabilities that can be mitigated.
|
|
finding.mitigated.method |
Risk Management > Findings > Vulnerabilities Risk Management > Findings > Misconfigurations |
Use this token to filter and identify vulnerabilities based on the specific method used to mitigate them.
Note: Mitigation method may vary from vendor to vendor. Currently, we are supporting findings from the Generic CSV. |
GroupBy Option
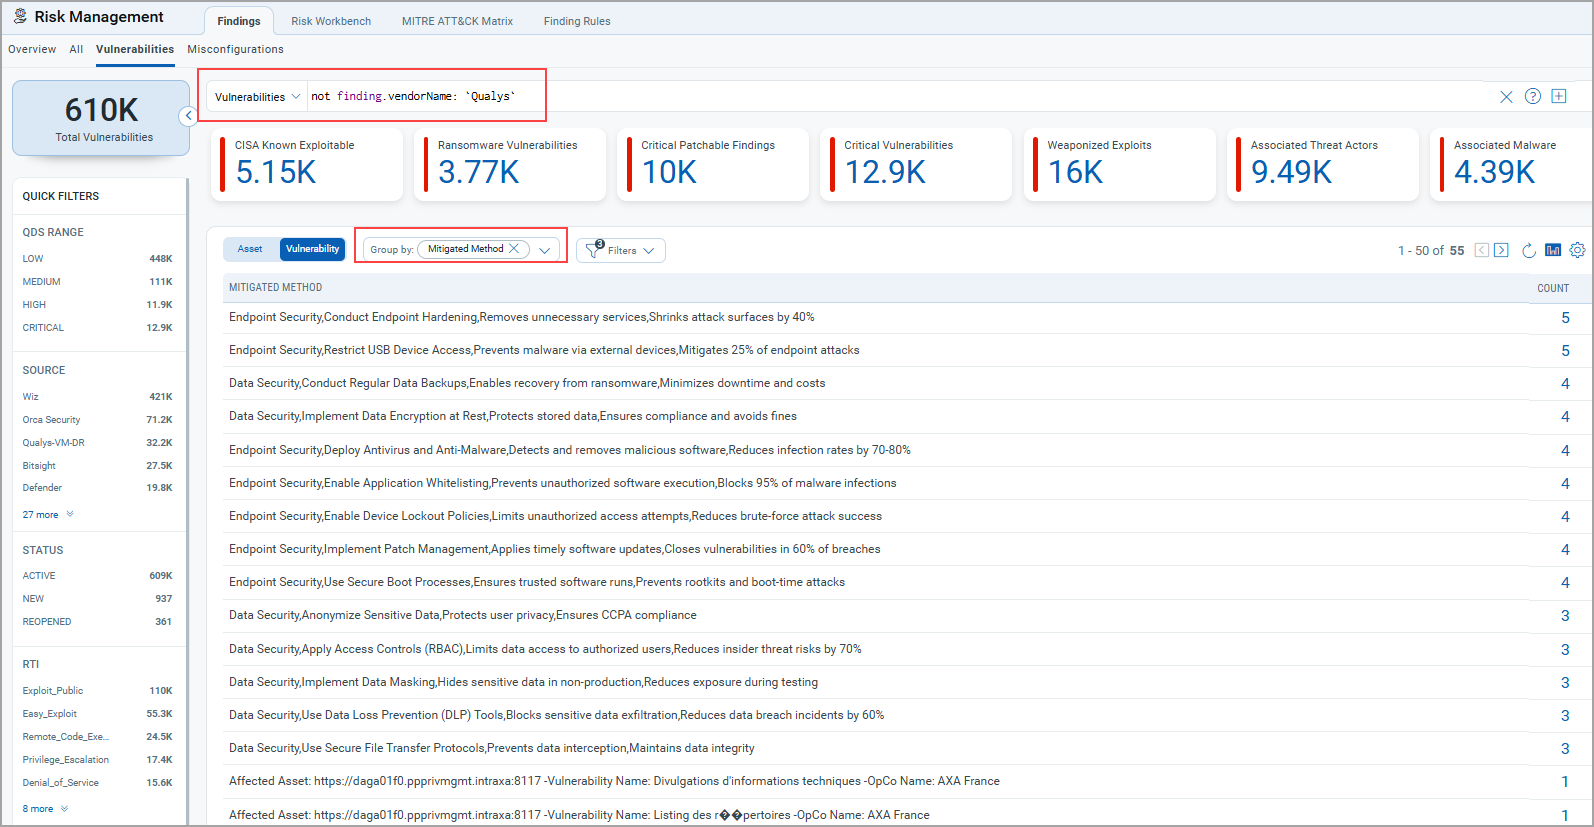
A new GroupBy Mitigation Method option allows you to filter the vulnerability listings based on the mitigation method applied. It provides clearer insight into how risks are being addressed across assets. To view the details, go to Filters, clear the selection for Excluded Vulnerabilities, and select GroupBy as Mitigation Method.
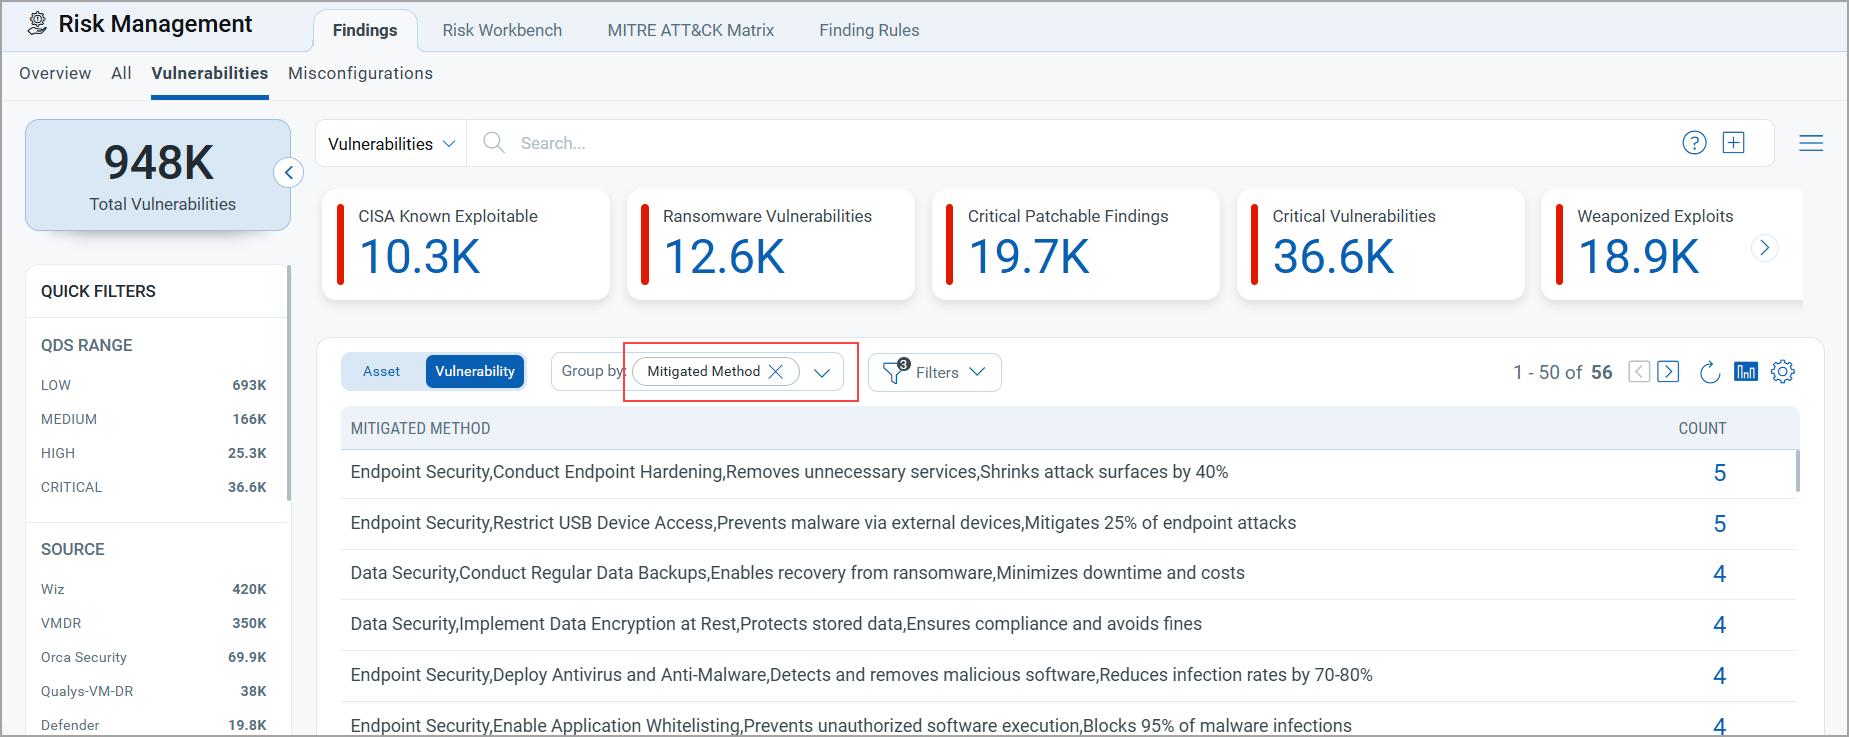
With this release, you can easily identify third-party findings using the mitigation.method group by option in QQL queries.
Use a QQL such as: not finding.vendorName: "Qualys"
This excludes Qualys findings and displays results from other sources.
By combining this with the Group by mitigation.method option, you can quickly filter and analyze vulnerability listings based on the mitigation methods applied by third-party sources.
Introduced Four New Widgets
With this release, we have introduced three new widgets:
- Arrival Rate and Burndown Rate Widget
- Funnel-Type Martini Glass Widget
- Risk Removal Velocity Widget
- Explore Business Entities Insights Widget
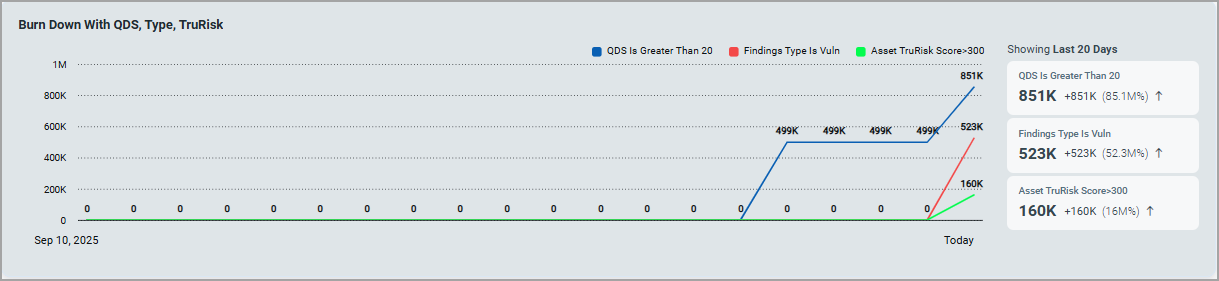
Arrival Rate and Burndown Rate Widget
The new Arrival Rate and Burndown Rate Widget provides a clear view of how risks are identified and fixed over time in a trendline chart. It helps risk teams understand if they are addressing new issues quickly enough and if any open problems are still within acceptable time limits.
Arrival Rate: Number of new findings added over time.
Burndown Rate: Number of findings resolved over time.
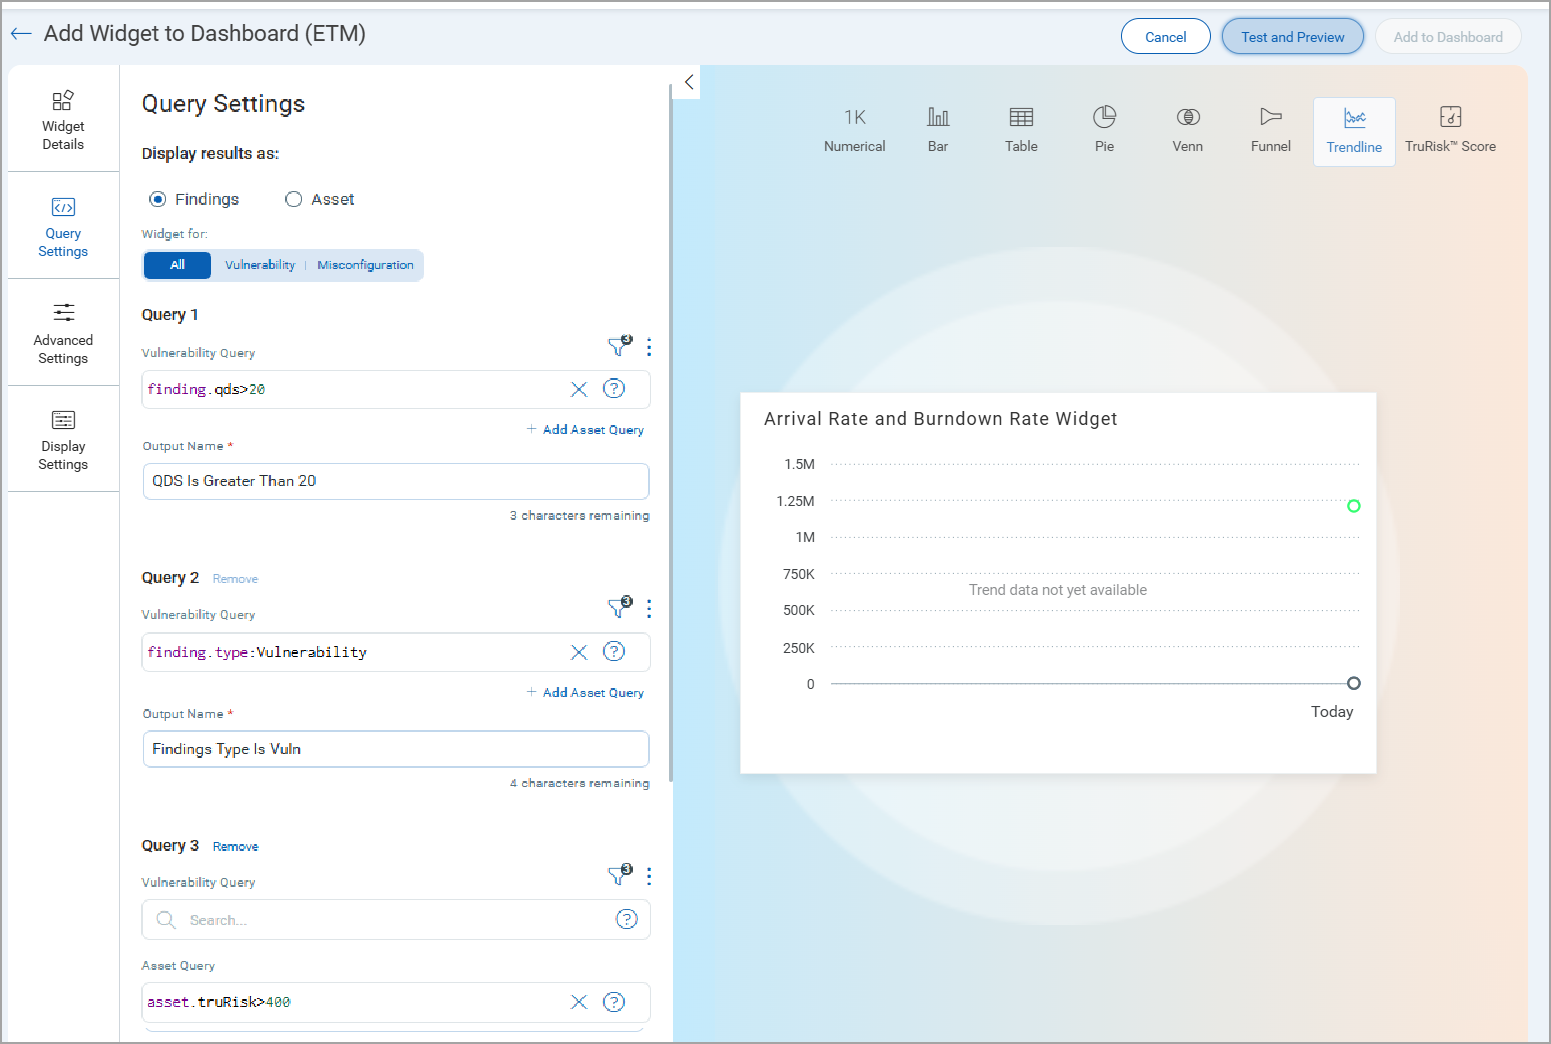
The Trend Line Chart now supports three queries, whereas previously it supported only two. Each query is visualized independently over time, enabling comparative trend analysis.
- Trendline Chart now supports three queries:
- Query 1: Base population (For example:
finding.qds>20) - Query 2: Filtered subset (For example:
finding.type:Vulnerability) - Query 3: Final actionable subset (For example:
asset.truRisk>400)
- Query 1: Base population (For example:
- Data Behavior
- Day 1 shows only raw data points; the trend line builds itself as new data arrives each day.
- Until enough data exists, users see a “Trend data not yet available”.
- Trend data refreshes every 24 hours, displaying a rolling 90-day window by default.
You can create your own widget, go to add Widget > Build your widget > enter the details to create the widget.
-
Provide Widget Name.
-
Select the chart type as Trendline, and add queries in Query Settings.
You can add up to three Queries.
-
(Optional) Display Settings for clarity.
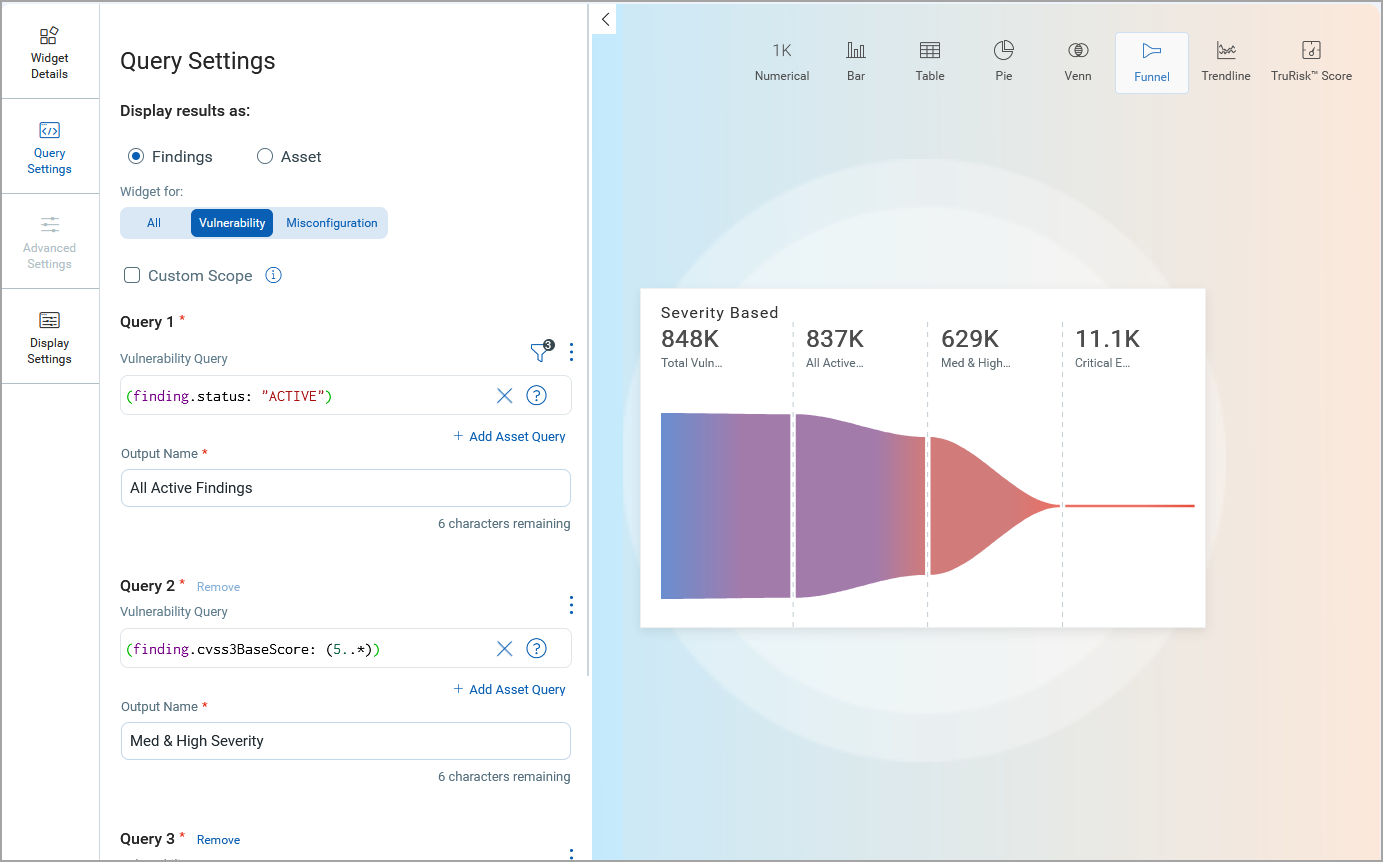
Funnel-Type Martini Glass Widget
We introduced the interactive Funnel-Type Martini Glass Widget, designed to help analysts visually narrow findings and assets through multi-layered filtering logic.
Key Highlights
The following are the key highlights of this widget:
- Enables progressive filtering for deep-dive analysis.
- Supports custom scoping for targeted investigations.
- Enhances visual clarity of prioritization logic and data reduction.
- Empowers analysts with flexible query control using QQL.
It is a clear, step-by-step visualization that shows how findings, assets, or business entities are narrowed down through prioritization. You can use this widget for vulnerabilities, misconfigurations, or both.
This widget helps users understand how their prioritization affects their work. It begins with a comprehensive set of data and then narrows down to the most critical issues that require attention.
The following screenshot illustrates how findings can be prioritized and filtered down from 848,000 to 11,100.
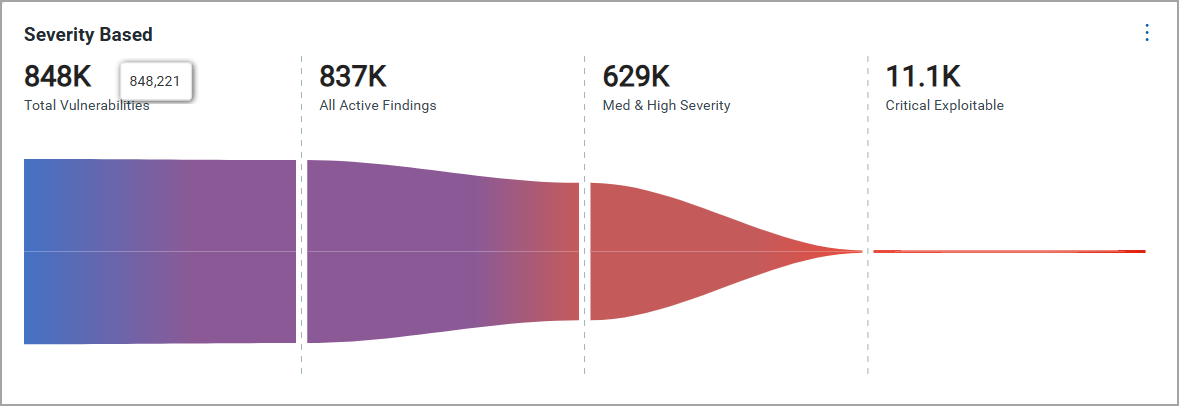
- Step-wise filtering lets you chain up to three queries:
- Query 1: All Active Findings
Start with your full set (for example, Active findings).
- Query 2: Med and High Severity
Narrow it down, for example,
QDS > 80%(finding.cvss3BaseScore: (5..*) - Query 3: Critical Exploitable
Extract the actionable items, such as
(finding.cvss3BaseScore > 8 and finding.riskFactor.rti: "Easy_Exploit").
- Query 1: All Active Findings
- Visual funnel format showing absolute numbers and percentages at each stage.
You can create your own widget by going to Add Widget > Build your widget > enter the details to create the widget.
-
Provide Widget Name.
-
Select the chart type as Funnel, and add queries in Query Settings.
You can add up to three settings.
-
(Optional) Display settings for clarity.
Risk Removal Velocity Widget
The Risk Removal Velocity Widget introduces a powerful way to visualize how fast risks are remediated across different scopes. It tracks the percentage of issues that are still unresolved over time and measures how long it takes to fix them by marking the Mean Time to Remediate (MTTR). This widget allows teams to compare their fixing performance, identify delays, and ensure they meet service level agreements (SLAs).
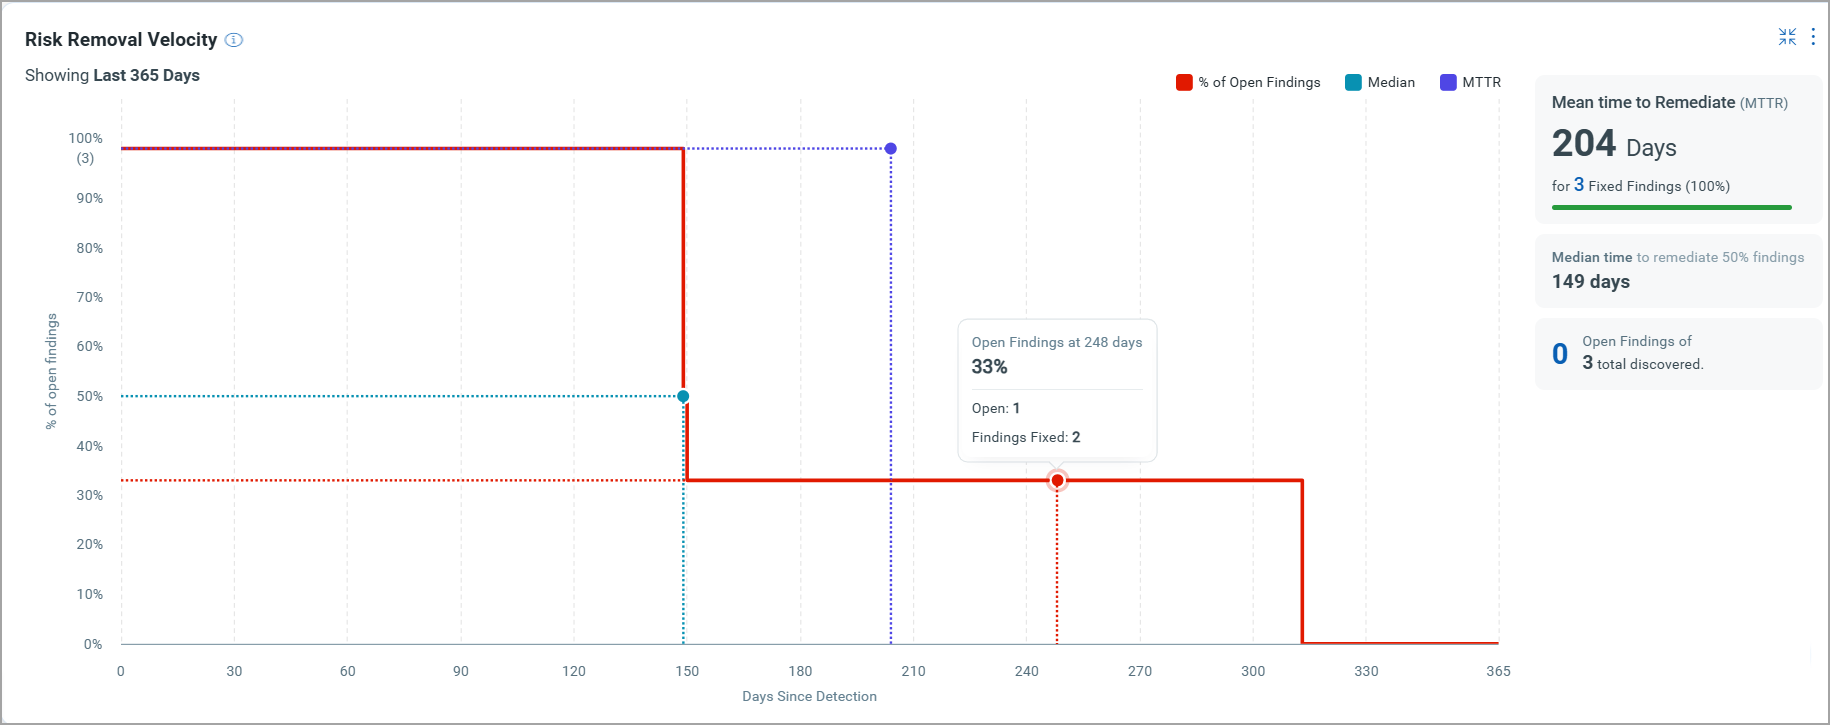
The graph consists of the following key elements:
- Curve: Line graph of the percentage of Open (unresolved) findings vs. time (in days).
- MTTR Marker: A vertical line indicating the point at which 50% of findings have been remediated.
- Hover Insights: Hovering over the graph reveals the number of findings at each point along the curve for added context.
- Summary: The top-right corner displays key metrics such as the MTTR for fixed findings and the total number of discovered findings.
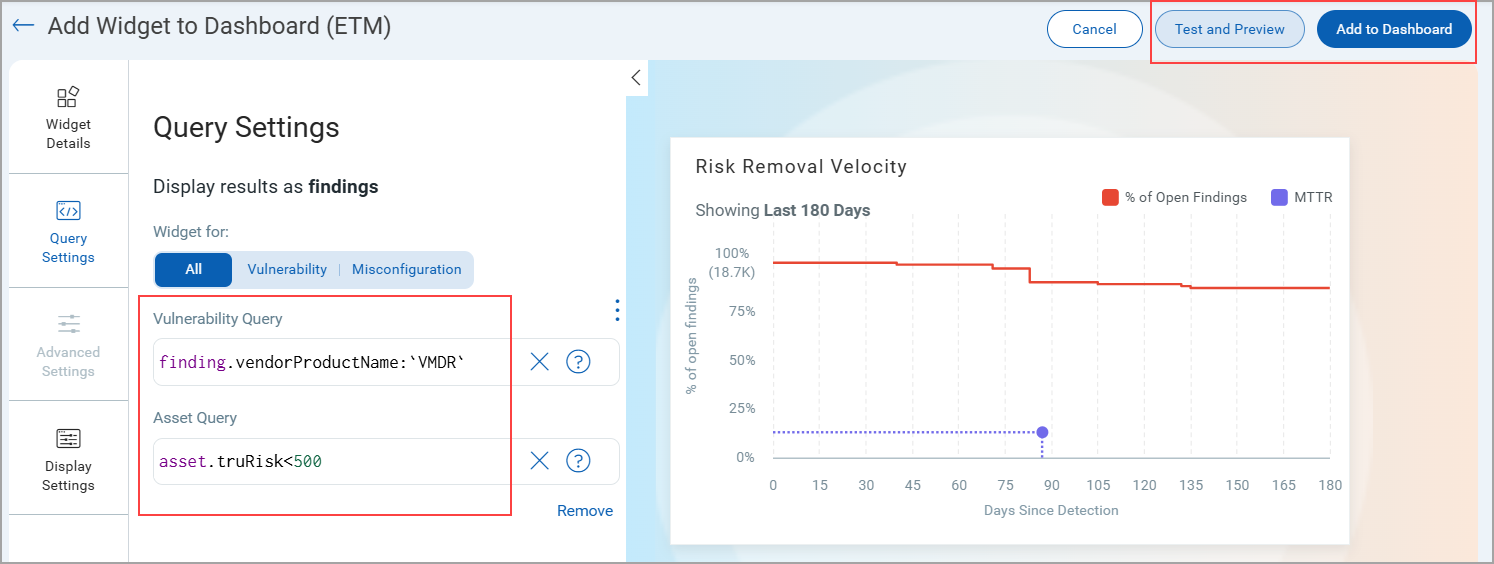
To add the widget to your dashboard, navigate to Dashboard, click Add Widget, and select Risk Removal Velocity from available ETM widgets.
You need to customize the widget by entering queries that suit your specific needs. We have pre-filled a sample query to illustrate the functionality for demonstration purposes.
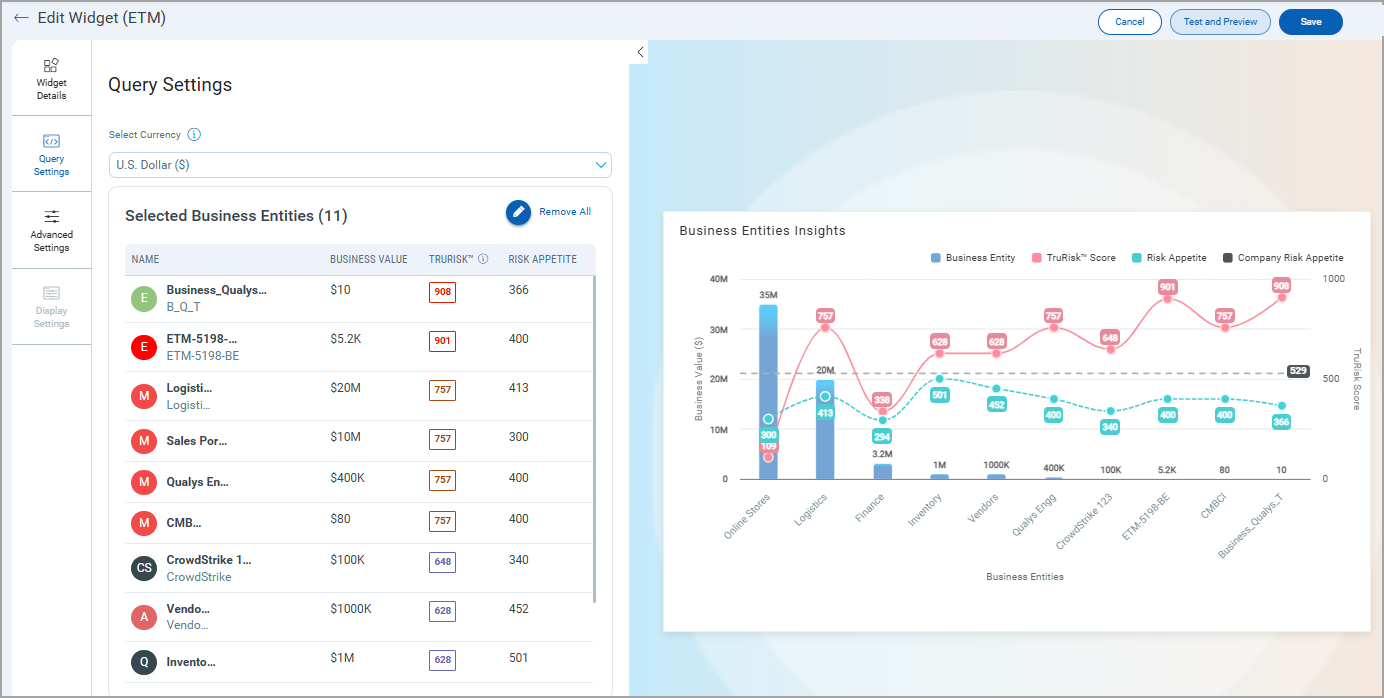
Explore Business Entities Insights Widget
We have introduced the Business Entities Insights Widget. This widget provides a consolidated view of business entities, their configured risk scores, and associated risk appetite, enabling risk teams to visualize their posture directly from the dashboard.
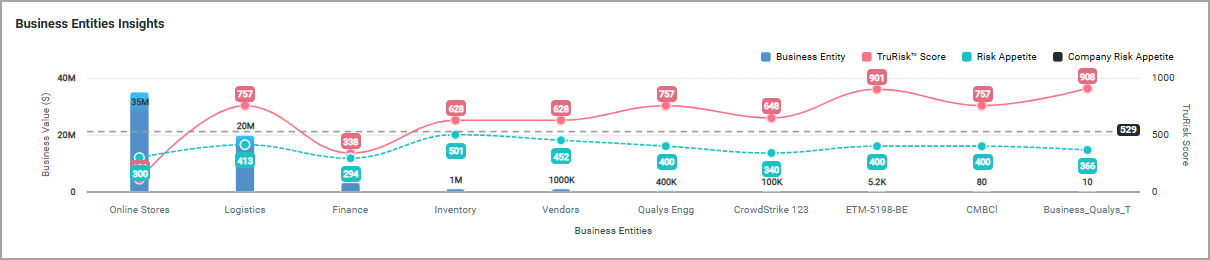
The widget helps in the following ways.
- Single View of Risk Posture
Consolidates business entities’ risk scores and appetite into one dashboard view. - Decision-Making Support
Enables leadership to prioritize entities with the highest exposure or those with the lowest tolerance. - Currency-Aware Filtering
Ensures financial comparability by grouping business entities under the same currency. - Customizable Insights
You can select up to 12 business entities, toggle parameters, and adjust display for tailored analysis. - Timely Updates
Any change in business entity values is automatically reflected in the dashboard.
To add the widget to your dashboard, navigate to Dashboard, click Add Widget, and select Explore Business Entities Insights from available ETM widgets.
You need to customize the widget by adding business entities that suit your specific needs.
Column Customization in Risk Management Tab
We have enhanced the Risk Management tab by introducing a customizable column selection feature across all three subtabs.
This enhancement gives users greater flexibility in personalizing their data view within the UI.
- All
- Vulnerabilities
- Misconfigurations
Previously, you could only customize the number of rows displayed, such as 50, 100, 150, 200. Now, you can also customize the columns displayed in the data table. We have added a Column Selection option under the gear icon in the Risk Management tabs.
Now, you can choose which columns to show or hide based on their preferences. It gives full control to select and rearrange desired columns. View only the most relevant data without clutter. Apply column customization individually for each tab.
To view this customization:
- Navigate to the ETM application > Risk Management Tab, and go to the required tab.
- Click the gear icon on the top-right of the data table.
- Select or clear the columns you want to display.
The following table lists all the columns that can be added to view the Findings list.
| All Tab | Vulnerabilities Tab | Misconfigurations Tab |
|---|---|---|
|
|
|
Optimized On-Demand TruRisk Prioritization for Better Performance
TruRisk™ score calculation currently works on-demand for all assets within scope. Asset-level scores are computed first, followed by tag-level scores using the defined tag score formula. While this works well for smaller data sets (with results available in ~5 minutes), performance can be impacted in large-scale environments, taking more time to complete. This impacts overall user experience, though results remain accessible.
We are introducing significant optimizations to improve scalability and response time. Now, analysts can prioritize active vulnerabilities and misconfigurations on-demand across tagged assets or selected Business Entities.
The new approach helps in
- Business Entity Selection
You can filter and select a Business entity, for example, HR, Research and Development, Engineering, and so on. - Tag-Based Asset Selection
You can filter and select assets using custom tags, such as Production, Finance, and Internet-facing assets. - Active Findings Aggregation
You can fetch all active vulnerabilities and misconfigurations associated with the selected scope. - Priority Filtering
You can filter by multiple attributes (for example, Common Attributes like Detection Score, TruRisk, Asset Criticality Score, Vulnerability, and Misconfiguration attributes as well) to focus on the most impactful issues. - Score Reduction Calculation
Triggering On-Demand Prioritization by clicking Refresh. It calculates and gives the reduced score. It helps to understand how much the score can be reduced after fixing the selected Findings.
To know more about On demand Prioritization, refer to ETM Online Help.
New Token for Risk Management
| Token | Tab | Description |
|---|---|---|
|
finding.cvePublishedDate |
Risk Management |
Search findings by specifying a date or date range corresponding to when CVE ID was published.
|
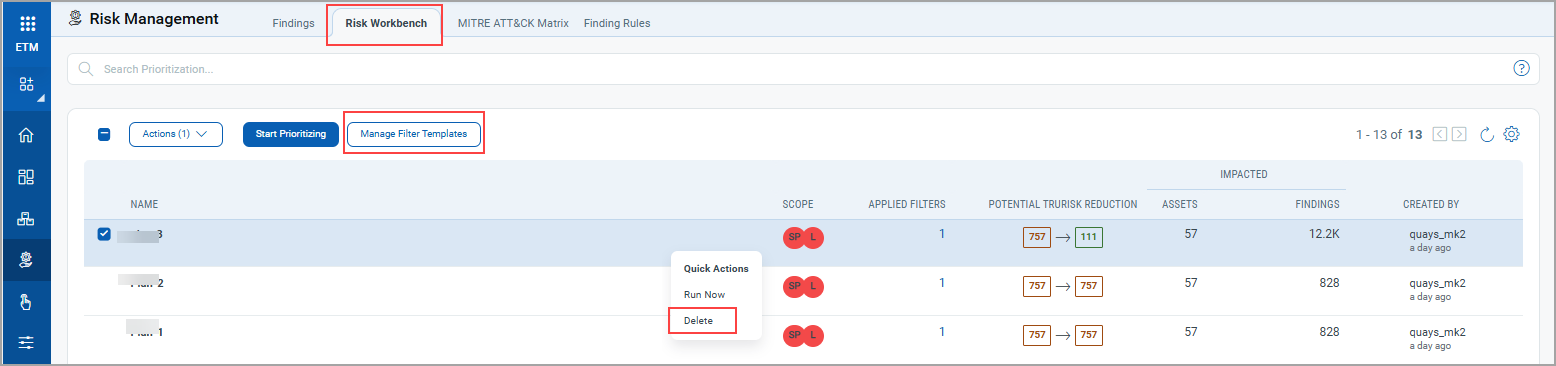
Delete Prioritization Report Templates
With this release, you can now delete custom Prioritization report templates in the ETM using the Manage Filter Template. A maximum of 13 templates can be active at any time. Note that system-generated templates cannot be deleted.
This new feature helps you
- Easily manage templates by deleting custom Prioritization report templates when no longer needed.
- Stay organized with clear separation. System templates remain protected while custom ones can be deleted.
You can view the option for deleting Prioritization Report Template in Risk Workbench tab.
Implementation of QQL Token Standardization
We have now implemented Qualys Query Language (QQL) token standardization across all Qualys applications. As part of this enhancement, ETM tokens are updated with new token names that follow a standard and consistent nomenclature.
The new token format follows the syntax: <entity>.<attribute>. For example, in the new token, finding.criticality, finding is the entity, and criticality is the attribute.
- Standardized Token Naming: The sensor, asset, and operating system tokens now follow the standardized naming convention. The tokens common to all Qualys applications have also been updated.
- Search Bar Updates: Only the new tokens are displayed in the auto-suggestion in the search bars within the UI. However, if you type the old token name manually, the QQL query still works. The old tokens will not be visible in the auto-suggestions on the UI.
- Backward Compatibility: The existing Dashboard widgets and Saved Search Queries will continue to support the old tokens in edit mode.
- Improved Interoperability: The standardized tokens make it easier to copy and reuse the search query from one application to another, eliminating the need to remember multiple token names for different applications and similar searches.
Updated Tokens
We have updated the token names in the ETM user interface.
Findings TokensFindings Tokens
| Old Token Name | New Token Name |
|---|---|
finding.firstFound |
finding.firstFoundDate |
finding.lastFound |
finding.lastFoundDate |
finding.ingestedOn |
finding.ingestedDate |
finding.reopened |
finding.reopenedDate |
| Old Token Name | New Token Name |
|---|---|
asset.lastLocation |
asset.lastLocation.name |
asset.lastUpdated |
asset.lastUpdatedDate |
businessApp:(businessCriticality |
businessApp.businessCriticality |
businessApp:(environment |
businessApp.environment |
businessApp:(id |
businessApp.id |
businessApp:(managedBy |
businessApp.managedBy.username |
businessApp:(name |
businessApp.name |
businessApp:(operationalStatus |
businessApp.operationalStatus |
businessApp:(ownedBy |
businessApp.ownedBy.username |
businessApp:(supportGroup |
businessApp.supportGroup |
businessApp:(supportedBy |
businessApp.supportedBy.username |
sensors.activatedForModules |
sensor.activatedForModules |
interfaces:(address |
asset.interface.address |
interfaces:(dnsAddress |
asset.interface.dnsAddress |
interfaces:(gatewayAddress |
asset.interface.gatewayAddress |
interfaces:(hostname |
asset.interface.hostname |
interfaces:(interfaceName |
asset.interface.name |
interfaces:(macAddress |
asset.interface.macAddress |
interfaces:(manufacturer |
asset.interface.manufacturer |
interfaces:(netmask |
asset.interface.netmask |
agent.agentID |
agent.id |
agent.lastInventory |
agent.lastInventoryDate |
agent.lastActivity |
agent.lastActivityDate |
agent.udcManifestAssigned |
agent.isUdcManifestAssigned |
alibaba.instance.region.code |
alibaba.instance.regionCode |
alibaba.instance.region.name |
alibaba.instance.regionName |
alibaba.instance.region.code |
alibaba.instance.regionCode |
alibaba.instance.region.name |
alibaba.instance.regionName |
inventory:(created |
asset.inventory.createdDate |
inventory:(lastUpdated |
asset.inventory.lastUpdatedDate |
inventory:(source |
asset.inventory.source |
hardware |
hardware.name |
asset.assetID |
asset.id |
asset.created |
asset.createdDate |
accounts.username |
account.username |
asset:(org.company |
asset.org.company |
aws.tags |
aws.tag |
aws.tags:(key |
aws.tag:(key |
aws.tags:(value |
aws.tag:(value |
connectors.connector.name |
connector.name |
connectors.connectorId |
connector.id |
connectors.firstDiscovered |
connector.firstFoundDate |
connectors.lastDiscovered |
connector.lastFoundDate |
customAttributes:(connectorId |
customAttributes.connectorId |
customAttributes:(key |
customAttributes.key |
customAttributes:(value |
customAttributes.value |
easm.tags.name |
easm.tag.name |
ibm.tags:(name |
ibm.tag.name |
ibm.tags:(value |
ibm.tag.value |
middlewareManifestVersion |
asset.middlewareManifestVersion |
pcManifestVersion |
asset.pcManifestVersion |
scaManifestVersion |
asset.scaManifestVersion |
qualysCorrelationID |
agent.qualysCorrelationId |
udcManifestVersion |
asset.udcManifestVersion |
vmManifestVersion |
asset.vmManifestVersion |
oci.compute.ociId |
oci.compute.id |
oci.tags:(key |
oci.tag.key |
oci.tags:(namespace |
oci.tag.namespace |
oci.tags:(type |
oci.tag.type |
oci.tags:(value |
oci.tag.value |
oci.vnic:(macAddr |
oci.vnic.macAddr |
oci.vnic:(nicIndex |
oci.vnic.nicIndex |
oci.vnic:(privateIp |
oci.vnic.privateIp |
oci.vnic:(publicIp |
oci.vnic.publicIp |
oci.vnic:(subnetCidrBlock |
oci.vnic.subnetCidrBlock |
oci.vnic:(subnetId |
oci.vnic.subnetId |
oci.vnic:(subnetName |
oci.vnic.subnetName |
oci.vnic:(vcnId |
oci.vnic.vcnId |
oci.vnic:(vcnName |
oci.vnic.vcnName |
oci.vnic:(virtualRouterIp |
oci.vnic.virtualRouterIp |
oci.vnic:(vlanTag |
oci.vnic.vlanTag |
oci.vnic:(vnicId |
oci.vnic.vnicId |
openPorts.port |
openPorts:(port |
passiveSensor.lastUpdated |
passiveSensor.lastUpdatedDate |
processors |
processor.name |
processors.coresPerSocket |
processor.coresPerSocket |
processors.multithreadingStatus |
processor.multiThreadingStatus |
processors.numberOfCpu |
processor.noOfCpu |
processors.numberOfSockets |
processor.noOfSockets |
processors.speed |
processor.speed |
processors.threadsPerCore |
processor.threadsPerCore |
sensors.firstEasmScanDate |
sensor.firstEasmScanDate |
sensors.firstEasmVmScanDate |
sensor.firstEasmVmScanDate |
sensors.lastComplianceScan |
sensor.lastComplianceScanDate |
sensors.lastEasmScanDate |
sensor.lastEasmScanDate |
sensors.lastEasmVmScanDate |
sensor.lastEasmVmScanDate |
sensors.lastFullScan |
sensor.lastFullScanDate |
sensors.lastPcScanDateAgent |
sensor.lastPcAgentScanDate |
sensors.lastPcScanDateScanner |
sensor.lastPcScannerScanDate |
sensors.lastVmScan |
sensor.lastVmScanDate |
sensors.lastVmScanDateAgent |
sensor.lastVmAgentScanDate |
sensors.lastVmScanDateScanner |
sensor.lastVmScannerScanDate |
sensors.pendingActivationForModules |
sensor.pendingActivationForModules |
services:(description |
service.description |
services:(name |
service.name |
services:(status |
service.status |
software:(architecture |
software.architecture |
software:(authorization |
software.authorization |
software:(authorizationDetectionScore |
software.authorizationDetectionScore |
software:(category |
software.category |
software:(category1 |
software.category1 |
software:(category2 |
software.category2 |
software:(component |
software.component |
software:(discoverySources |
software.discoverySources |
software:(edition |
software.edition |
software:(firstFound |
software.firstFoundDate |
software:(hasRunningInstance |
software.hasRunningInstance |
software:(installDate |
software.installDate |
software:(isPCSupported |
software.isPCSupported |
software:(isPackage |
software.isPackage |
software:(isPackageComponent |
software.isPackageComponent |
software:(isRequired |
software.isRequired |
software:(lastUpdated |
software.lastUpdatedDate |
software:(license.category |
software.license.category |
software:(license.subcategory |
software.license.subcategory |
software:(lifecycle.detectionScore |
software.lifecycle.detectionScore |
software:(lifecycle.eol |
software.lifecycle.eol |
software:(lifecycle.eos |
software.lifecycle.eos |
software:(lifecycle.ga |
software.lifecycle.ga |
software:(lifecycle.stage |
software.lifecycle.stage |
software:(marketVersion |
software.marketVersion |
software:(name |
software.name |
software:(product |
software.product |
software:(publisher |
software.publisher |
software:(supportStage |
software.supportStage |
software:(version |
software.version |
software:(installPath |
software.installPath |
tags.name |
asset.tag.name |
whoIs:(creationDate |
whoIs:(createdDate |
asset:(domain |
asset.domain |
asset:(isp |
asset.isp |
asset.lastBoot |
asset.lastBootDate |
asset.ownedBy |
asset.ownedBy.username |
asset.supportedBy |
asset.supportedBy.username |
asset.supportGroup |
asset.supportGroupasset.supportGroup |
asset.managedBy |
asset.managedBy.username |
Risk Acceptance Tokens Support for Alerting
With this release, we have extended support for Risk Acceptance tokens to create alerts. This enhancement allows you to incorporate risk acceptance details when defining alert conditions. This update improves alerting flexibility by enabling users to track and respond to findings based on their associated Risk Acceptance parameters.
Supported Risk Acceptance tokens are
- finding.riskAcceptance.reasonType
- finding.riskAcceptance.type
- finding.riskAcceptance.ruleId
- finding.riskAcceptance.createdDate
- finding.riskAcceptance.startDate
- finding.riskAcceptance.endDate
For details and more examples, refer ETM Online Help.
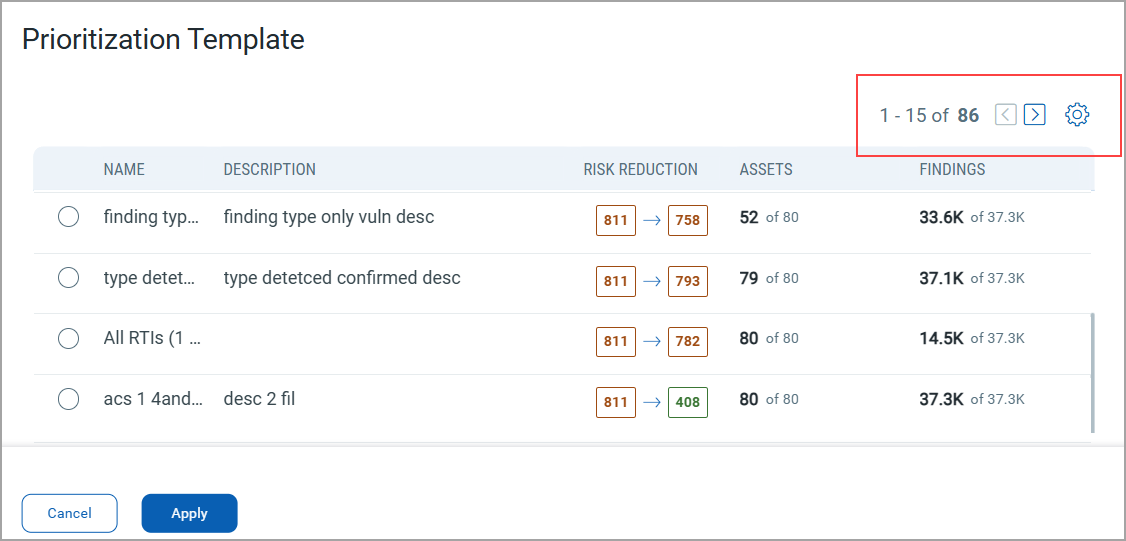
Pagination Support for Templates in Prioritization
With this release, we have enhanced our prioritization page by introducing pagination support. This improvement makes it easier to manage larger sets of templates, resulting in faster page loading and preventing your browser from slowing down, even when dealing with numerous templates. You can now navigate through your templates one page at a time, ensuring that as you add more templates, the system continues to operate smoothly.
To view these settings, navigate to the Risk Management tab > Risk WorkBench subtabs. Define the scope, and while selecting the prioritization approach, click View All. You can view the pagination support provided for templates.
Issues Addressed
The following reported issues are fixed in this release.
| Component | Description |
|---|---|
|
ETM User Interface |
There was a discrepancy in the Top Risk Factors Count. Previously, the Top Risk Factors displayed on the ETM Home page displayed a different count compared to the Overview page in the Findings tab. The discrepancy occurred because the Home page displayed counts for findings, while the detail page also included total assets. To avoid this confusion, we have improved the UI by introducing a new field:
This update ensures greater clarity and consistency between the Home page and Findings Overview. |
|
ETM User Interface |
A discrepancy was identified in the TruRisk™ Score tab under Asset Details, where the same vulnerabilities appeared with different statuses depending on the view: In the CVE tab, vulnerabilities appeared with an Active status. In the QID tab, the same vulnerabilities appeared with Fixed status. We fixed this issues now, any finding without a CVE ID is now re-ingested with the appropriate CVE ID. The earlier finding without a CVE ID will be marked as Invalid and dropped. |
|
ETM User Interface |
An intermittent issue was observed where, upon clicking Test Connection, the expected pop-up message (Connection Successful or Connection Failed) is not displayed. In such cases, users had to refresh the page and re-test the connection to view the result. The issue is fixed. The pop-up messages for both Test Connection Successful and Test Connection Failed now appear reliably without requiring a page refresh. |
|
ETM Dashboard |
The issue is resolved regarding the ETM Dashboard, where the Closed option in the filter was previously unchecked by default in dashboard widgets. As a result, vulnerabilities associated with closed QIDs were incorrectly included in the widget data counts. The default filter behavior has been corrected. The ETM Dashboard widgets now properly exclude closed findings, ensuring that vulnerability data reflects only active findings as intended. |