Dashboard
QRadar displays a dashboard with 12 widgets. These widgets display different details and allow users to select a date range.
To select a date range :
Go to Qualys FIM > Dashboard > Select a date range for which you want to view the changes.
The different widgets of the dashboard are:
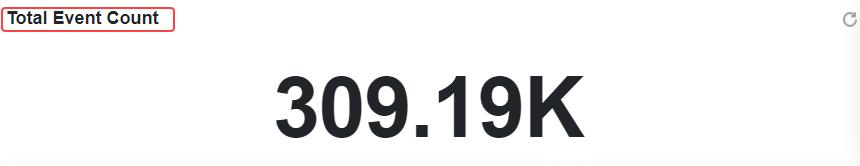
- Total Event Count – Displays count of total FIM Events in the selected date range.
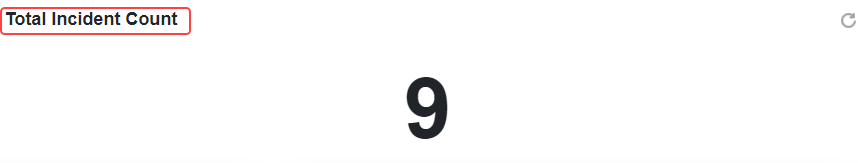
- Total Incident Count – Displays the total number of FIM incidents in the selected date range.
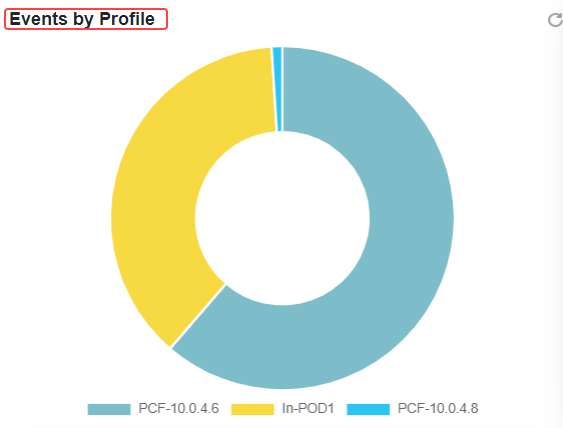
- Events by Profile – Displays profile-wise distribution of events. The profile's name and the number of events are displayed on the mouse hover.
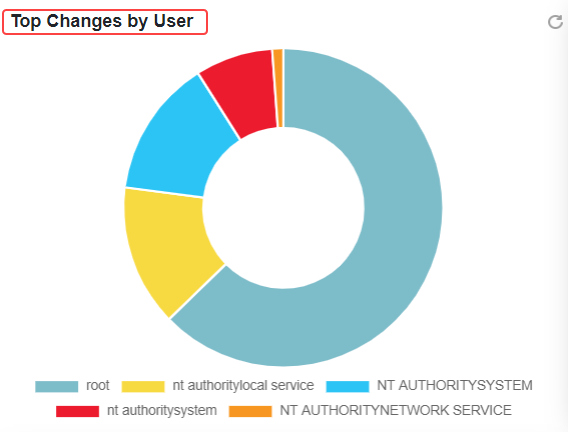
- Top Changes by User – The top changes done by the user in FIM events are displayed here.
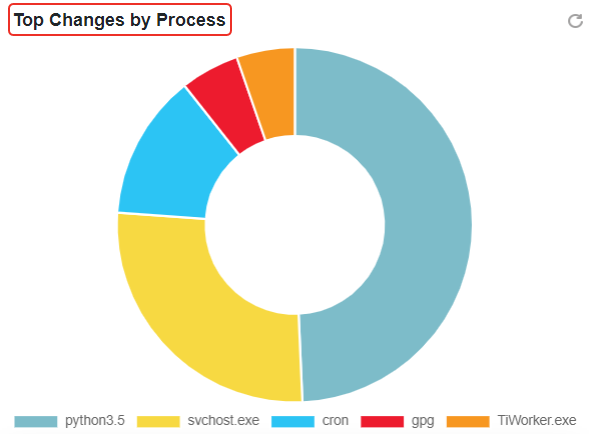
- Top Changes by Process – The top changes done by process in FIM events are displayed here.
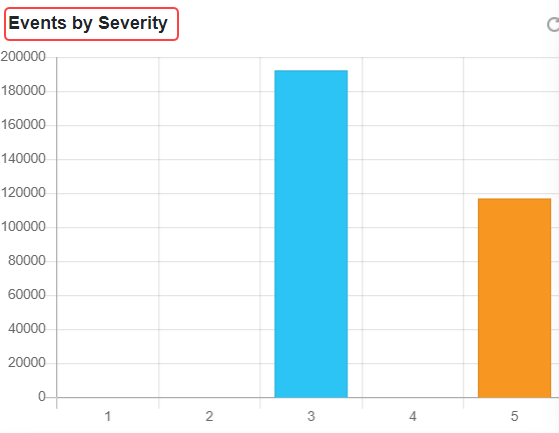
- Events by Severity – Displays severity-wise distribution of all FIM Events in the selected date range. By hovering over the mouse, the severity bars show the count of events.
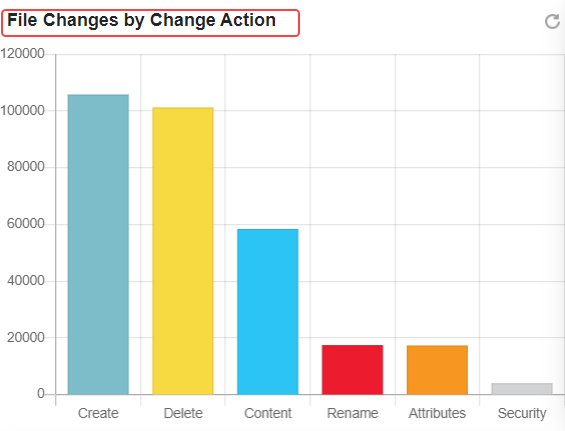
- File Changes by Change Action – FIM Events are displayed here for the file changes by their change action. The top 10 actions for file changes are presented with their count.
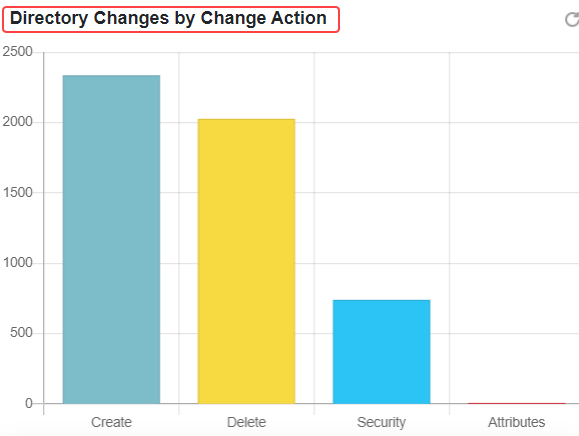
- Directory Changes by Change Action – Graphical display of directory changes by change action in the selected date range.
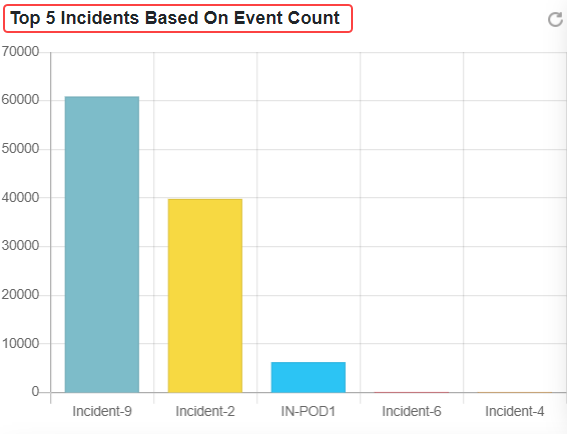
- Top 5 Incidents Based on Event Count – Graphical display of top 5 incidents based on event count in the selected date range.
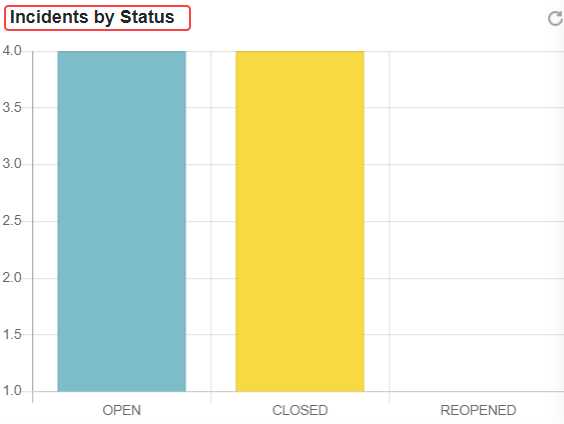
- Incidents by Status – Graphical display of incidents by their status in the selected date range.
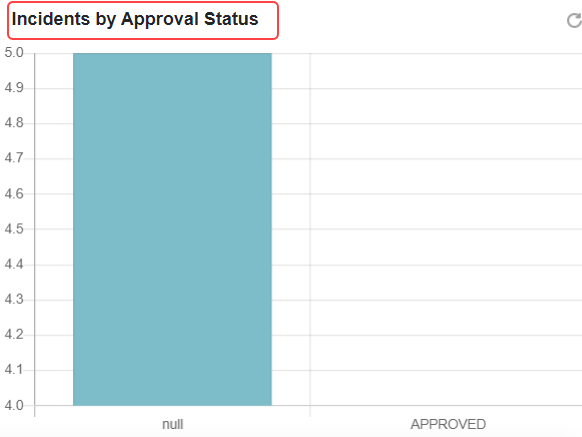
- Incidents by Approval Status – Graphical display of incidents by their approval status in the selected date range.
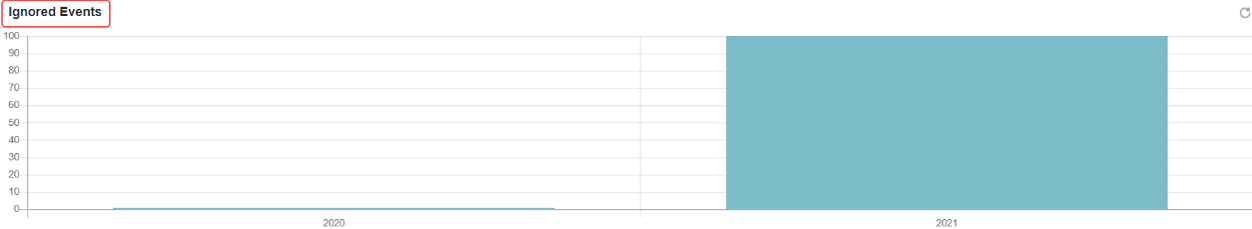
- Ignored Events – Graphical display of total FIM Ignored Events in the selected date range. Information in the bar chart is displayed according to:
- If the start and end date difference is in the year(s), show the bar chart year-wise.
- Else, If the start and end date difference is in the month(s), show the bar chart month-wise.
- Else, If the start and end date difference is in the day(s), show the bar chart day-wise.
- Else, If the start and end date difference is in the hour(s), show the bar chart hour-wise.
- Else, If the start and end date difference is in the minute(s), show the bar chart minute-wise.
If the date difference is > 30 days, it is converted to a month.