Reviewing Job Results
Once the Windows, Linux, or Mac deployment job or rollback (Windows assets only) job is created, it runs immediately (On-Demand) or on a specified schedule. You can view the results of a job run, whether all patches got successfully installed/rolled back or there are failures.
Viewing Patch Installation Date Details
Viewing Job Results for Recurring Jobs
Viewing Job Results
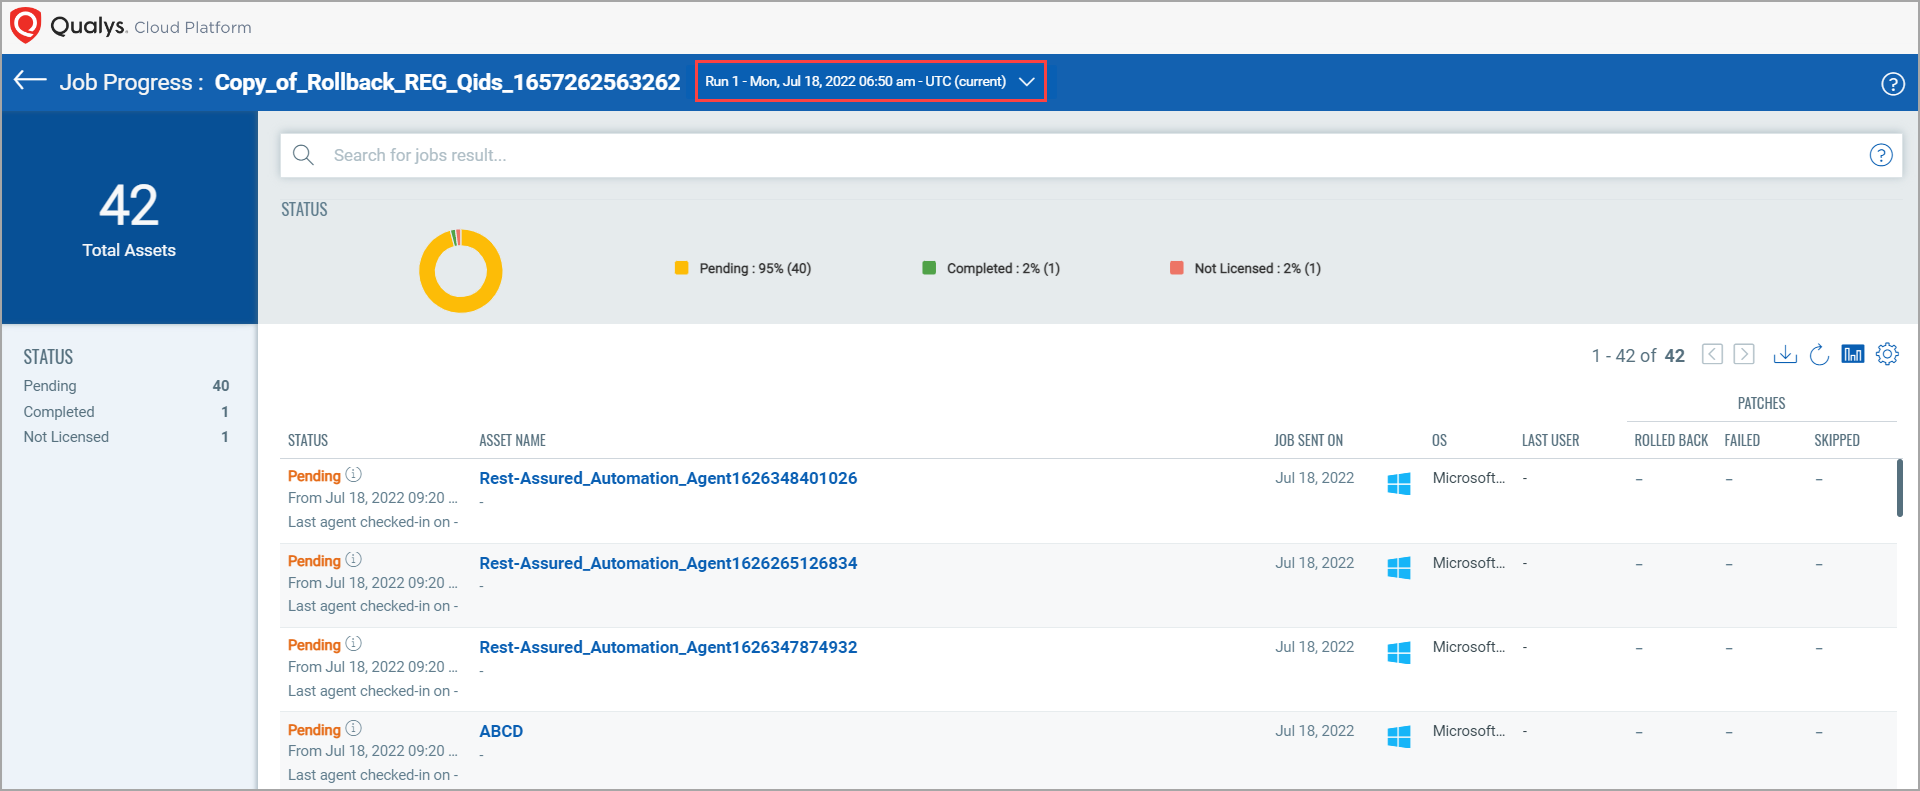
To view the job results, go to Jobs, then from the Quick Actions Menu of a job, click View Progress.
- You can see the assets on which the patch deployment/rollback job was run, and the job status in the STATUS column. Also, in the PATCHES column, you can see the Installed, Failed, and Skipped patches details.
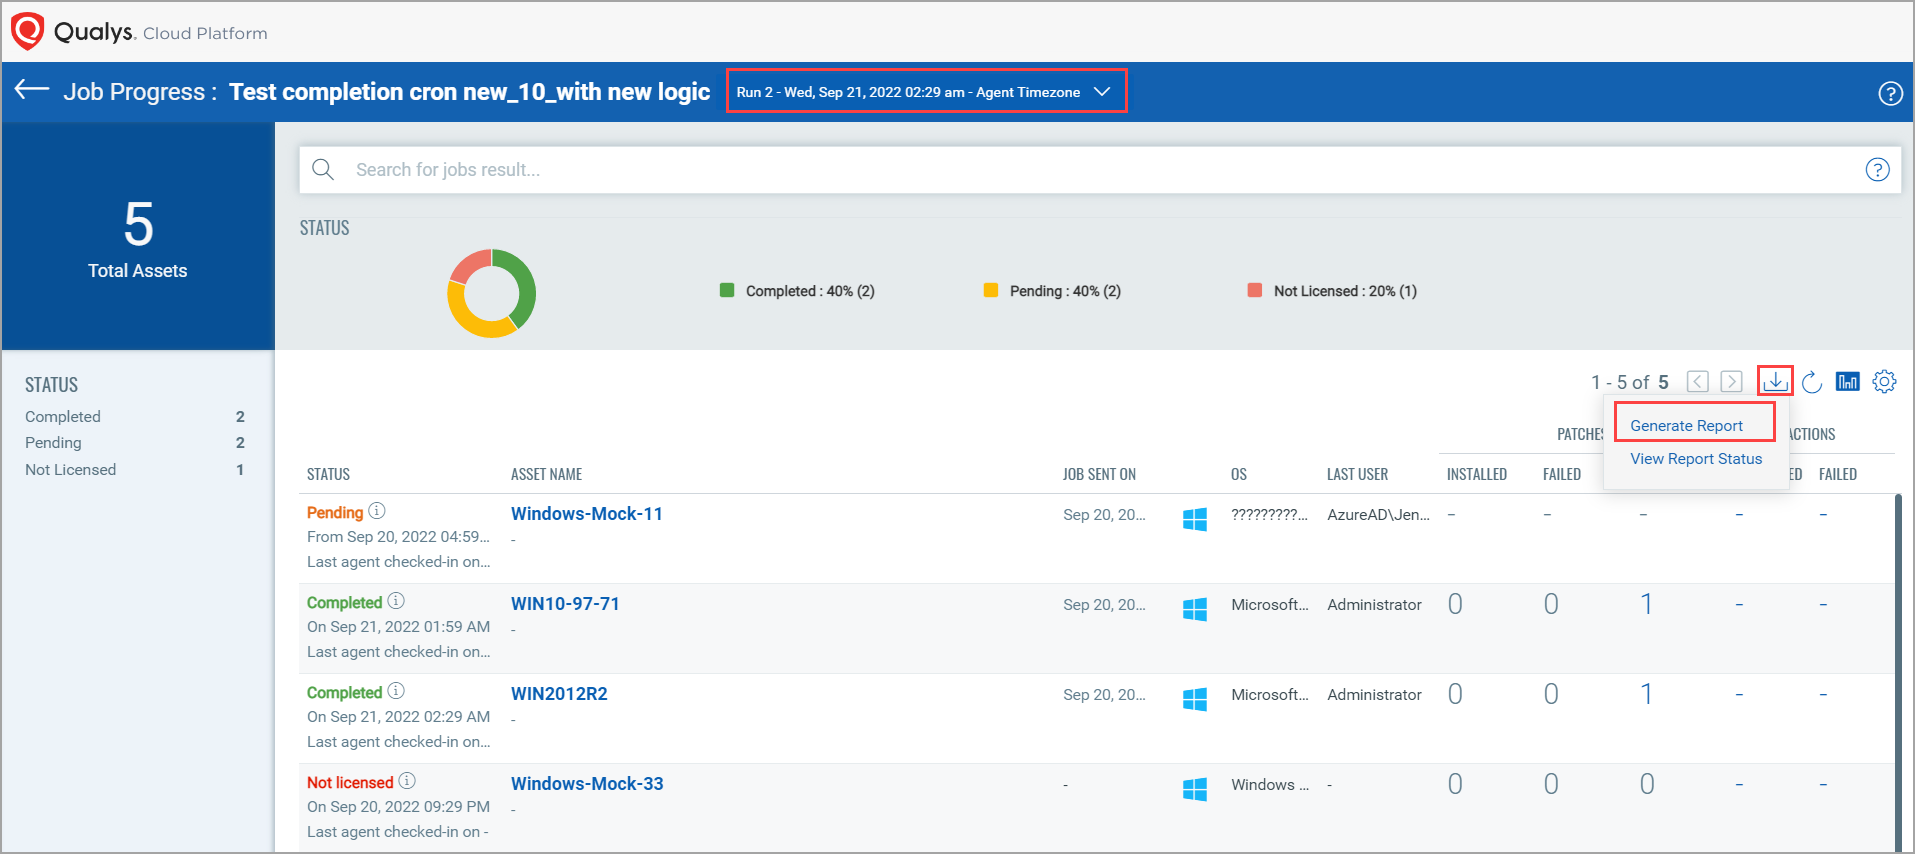
- As shown in the following screen capture, you can see the assets that are in different patch deployment job result statuses. Unlicensed assets are displayed as Not Licensed in the results.
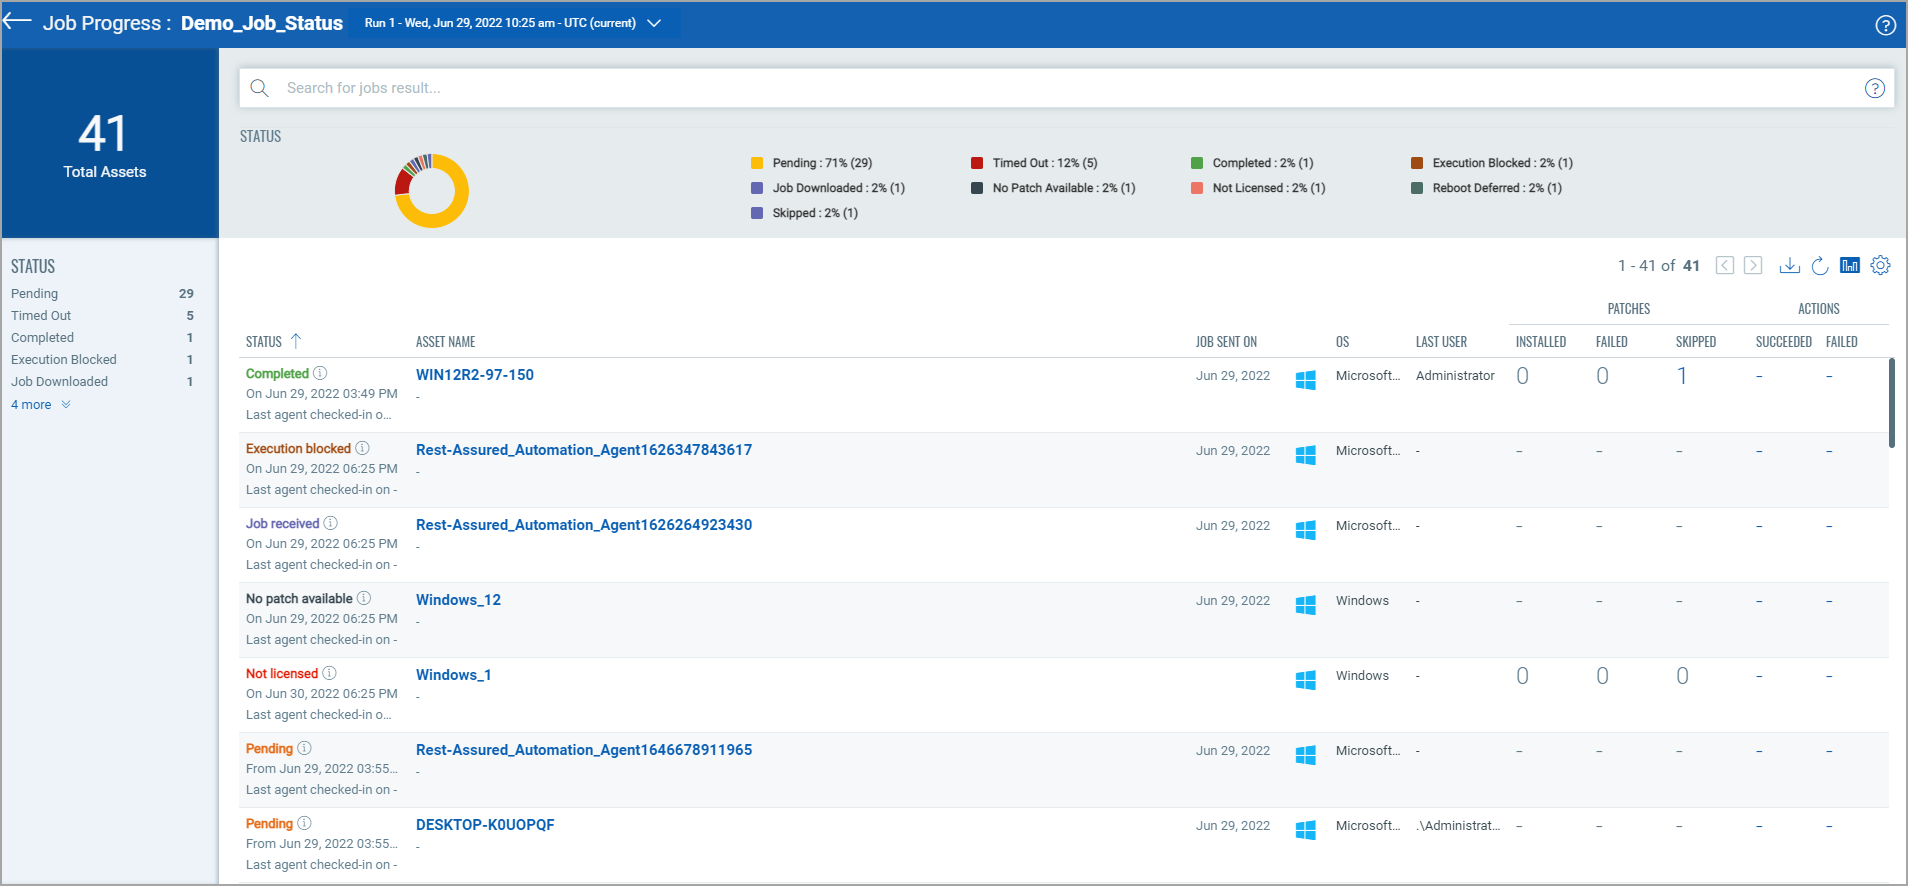
The patch job is skipped for the Linux assets for which the job was Not Applicable due to different platforms of assets and patches. Such assets are shown as "Not Applicable" on the UI.
- The pie chart provides a percentage-wise breakup of all asset statuses and allows you to select one or more statuses to filter assets. This pie-chart shows all statuses even if you choose any other status from the left panel.
- You can also see the following patch count for Windows jobs:
- INSTALLED: Number of patches that were successfully deployed on the agent in the latest job run.
- FAILED: Number of patches that failed to install due to some errors on the agent in the latest job run.
- SKIPPED: Number of patches that were skipped in latest job run.
A few patches might be skipped because the patches are not applicable for the asset, superseded by another patch, or are already installed.
The error logs for failed patches of Linux patch jobs are stored only for 14 days.
Job activities corresponding to the reboot messages and notifications displayed for the asset, are logged at the following location:
% USERPROFILE%\AppData\Local\Qualys\QualysAgent\QAgentUiLog.txt
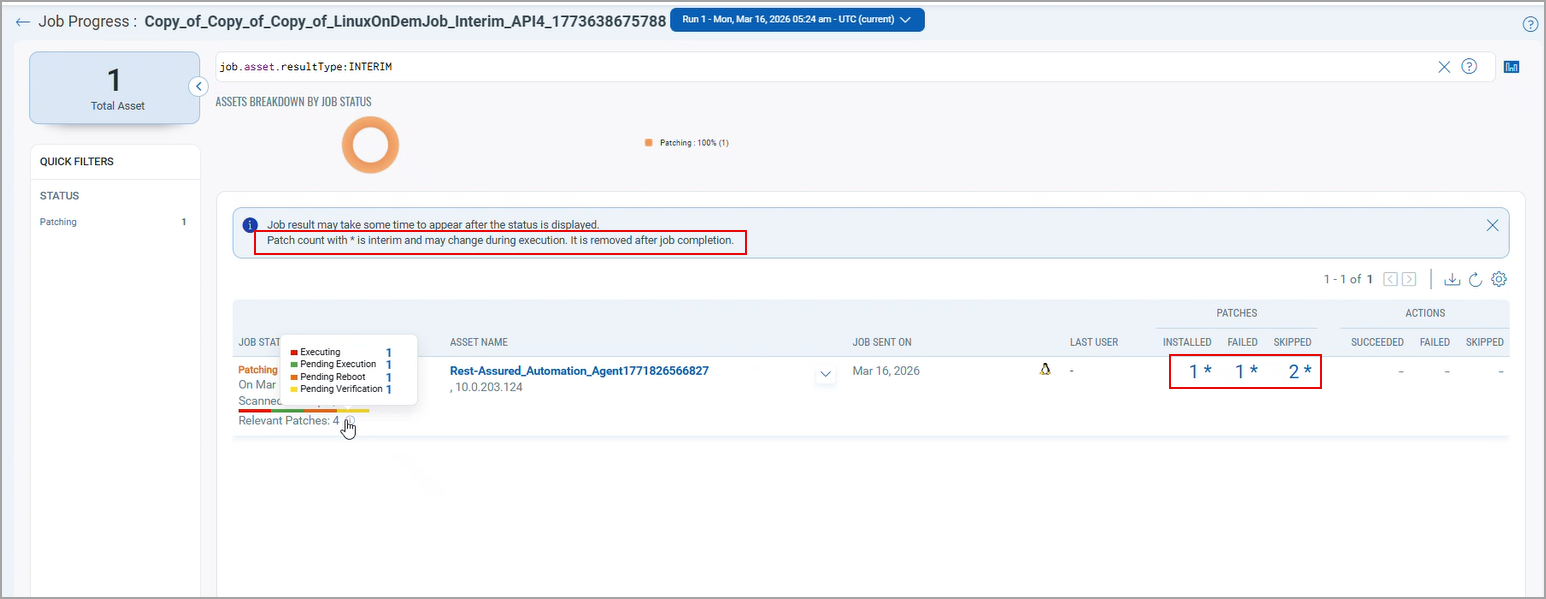
- When patching starts on your assets, you receive the interim job results when the job takes a longer time to complete. In the interim job results, when you hover over the progress bar, you can see the relevant patches number and an info icon next to it. When you click the info icon, you can see the interim job results and associated number of patches. When you click the associated number of patches, the 'Patching Status' window is shown that details out the interim job results and patch names. The interim job results are "Executing", "Pending Execution", "Pending Reboot", and "Pending Verification".
Under the Patches column, the number of Installed, Skipped and Failed patches are marked with an asterisk (*) to indicate that the count is interim and may change as the job progresses. Once the job execution is complete, the asterisk symbol is removed and final patch counts are displayed. The interim message Patch count with * is interim and may change during execution, it is removed after job completion is also removed from the Job Progress page. you can monitor patch job progress throughout the job life cycle. Even after execution completes, you can continue to view patch counts for assets awaiting reboot. After the reboot is completed, the job status finally updates to Completed or Completed with Failure.
You can use thejob.asset.resultType:INTERIMQQL token to filter the interim job results on the Job Progress and Aggregated Job Progress page.
- Executing: Patches that are being installed.
- Pending Execution: Patches that are pending for installation.
- Pending Reboot: Patches for which an asset reboot is required as the patch job is effective only after the assets are rebooted.
- Pending Verification: Patches for which post-install validation is pending, that is, the patch scan after the job completion is pending.
- When you see the status of your assets from the "Job Progress" page, you can see
 icon next to the asset status. Upon clicking this icon, you can see a tool tip where the status of your asset is mentioned as Pending Reboot. It also includes the name of the job in which the asset needs a reboot. As a result, you get clarity that the asset needs a reboot in another job, and that is the reason your current job cannot proceed on the asset.
You can see this icon and "Pending", "Job Sent", "Job Received", and "Execution Blocked" asset statuses.
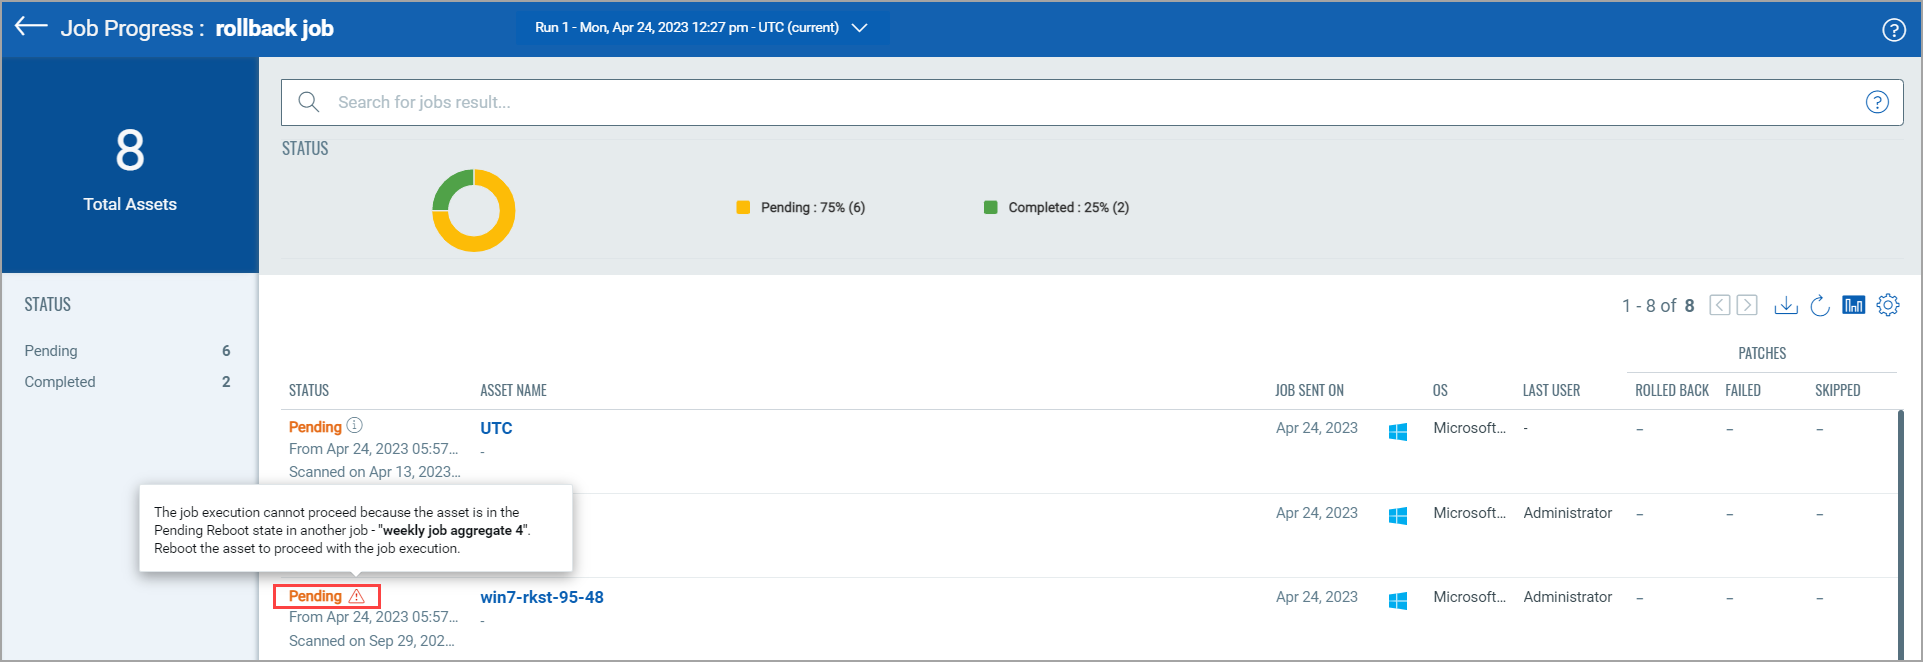
You can also see this on the “Job Progress”, “Job Details, and “Aggregated Jobs Progress View” pages.
You can still view the deactivated assets on the Job Progress page that were part of the job before deactivation. The asset data of these deactivated assets is retained for 45 days from the date of deactivation.
You can request to restore the asset data including jobs data associated with the deactivated assets within 45 days of deactivation. To request data recovery, you must contact your Technical Account Manager.
Click here to learn more about the data retention period for deployment job results.
Important to Know
When you view the job progress of a Linux Job with "Completed" status and if the status of some of the patches is "Failed", an additional status text 'Partially Successful' is shown for such failed patches.
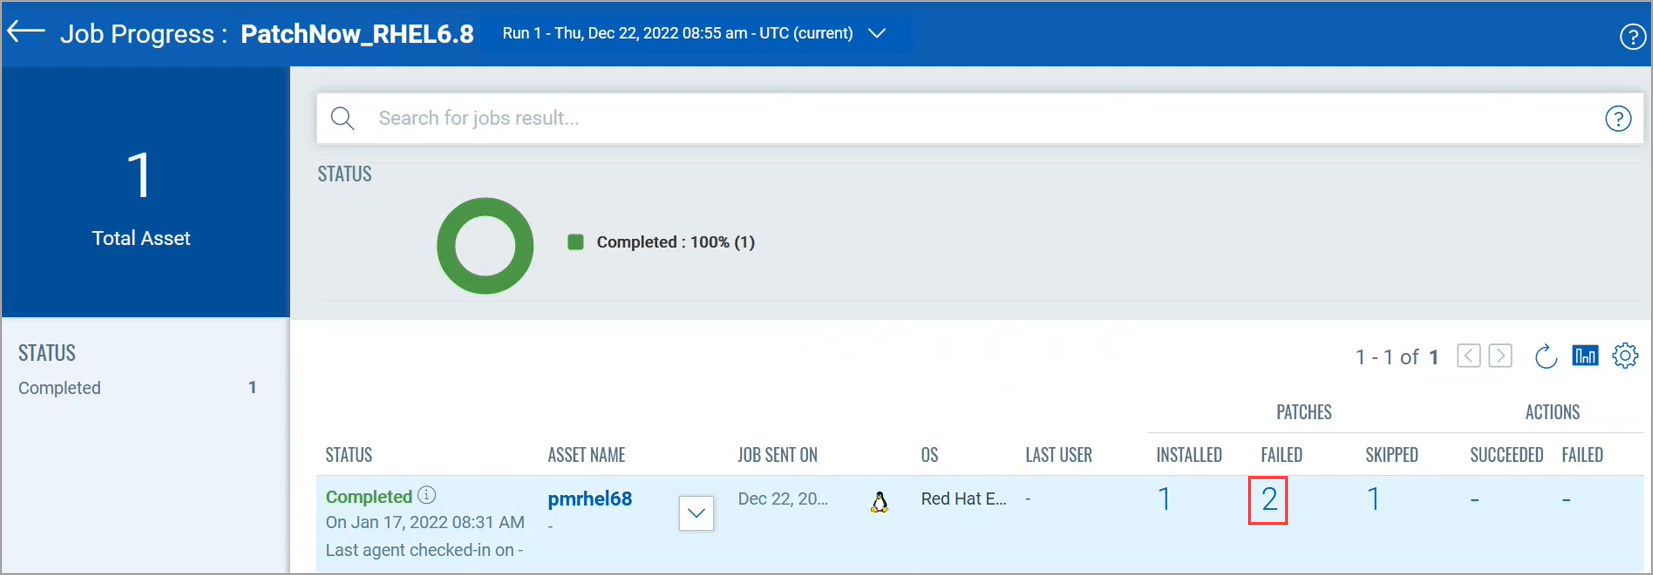
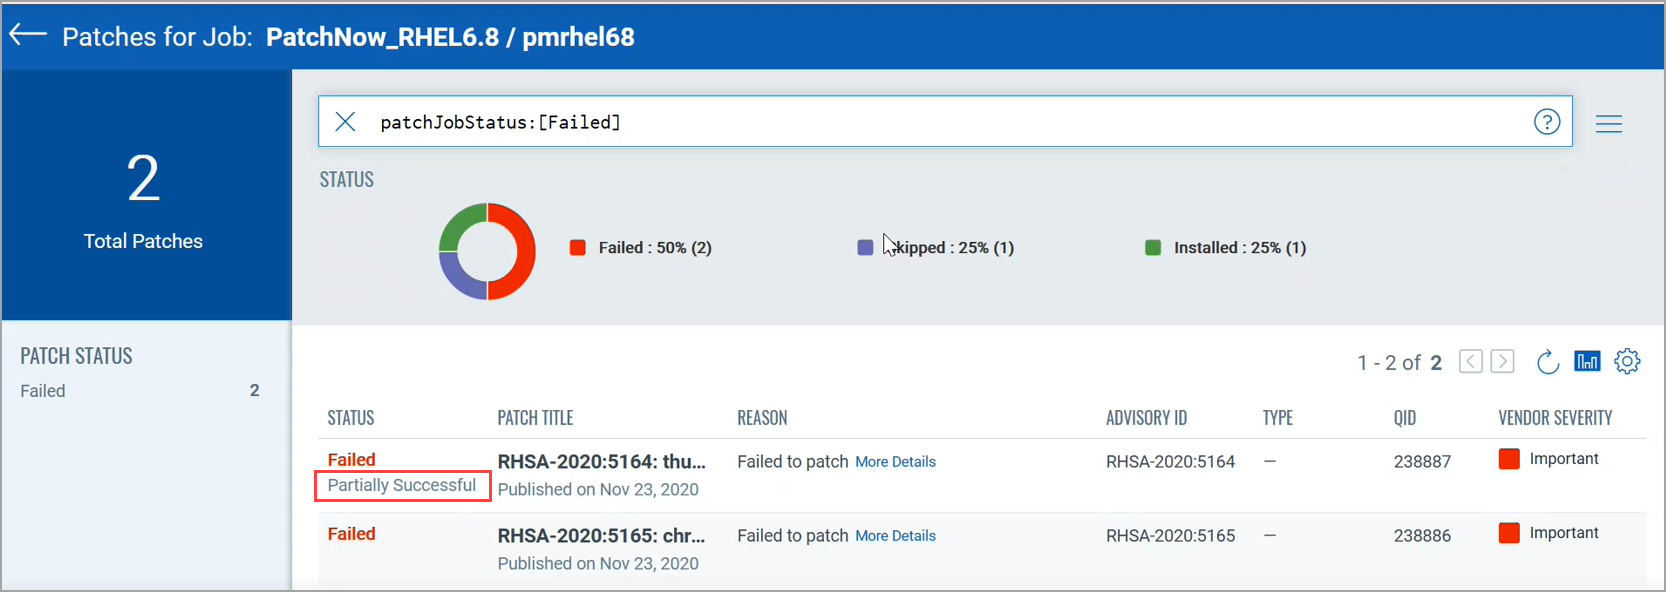
This additional text is shown for the failed patches when some of the packages from the failed patch are successfully installed.
When no packages from the Failed patch are successfully installed, the additional text is not shown that indicates the 100% patch failure.
As a result, this additional status text helps users to distinguish between the totally failed and partially successful patches.
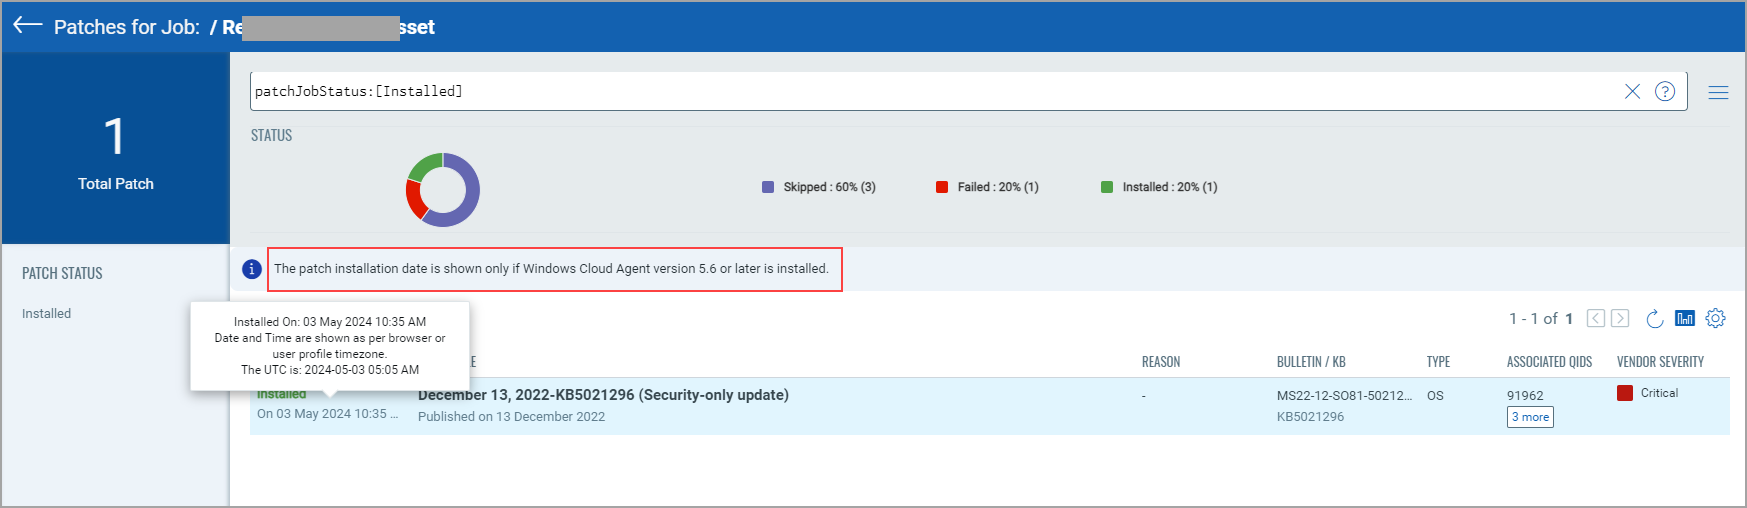
Viewing Patch Installation Date Details
You can view the installation date and time of patches installed on Windows, Linux, and Mac assets. The patch installation date and time are shown according to your browser (user profile) timezone and the UTC timezone.
Important to Know!
The patch installation date is shown only when the following cloud agent versions are installed:
- Windows platform: Agent version 5.6 or later
- Linux platform: Agent version 6.4 or later
- Mac platform: Agent versions Intel 6.1.0 or later and ARM 6.2.0 or later
Complete the following steps to view the patch installation date.
- From the Jobs tab, click the required tab (Windows, Linux, or Mac).
- Click View Progress from the Quick Actions menu of a job with Assets Responded status.
- Click the Installed patches count on the Job Progress page.
Note: Alternatively, you can click View Details from the Quick Actions menu and click Installed patches count from the Assets tab. - You can see the Patch installation date on the Patches for Job page.
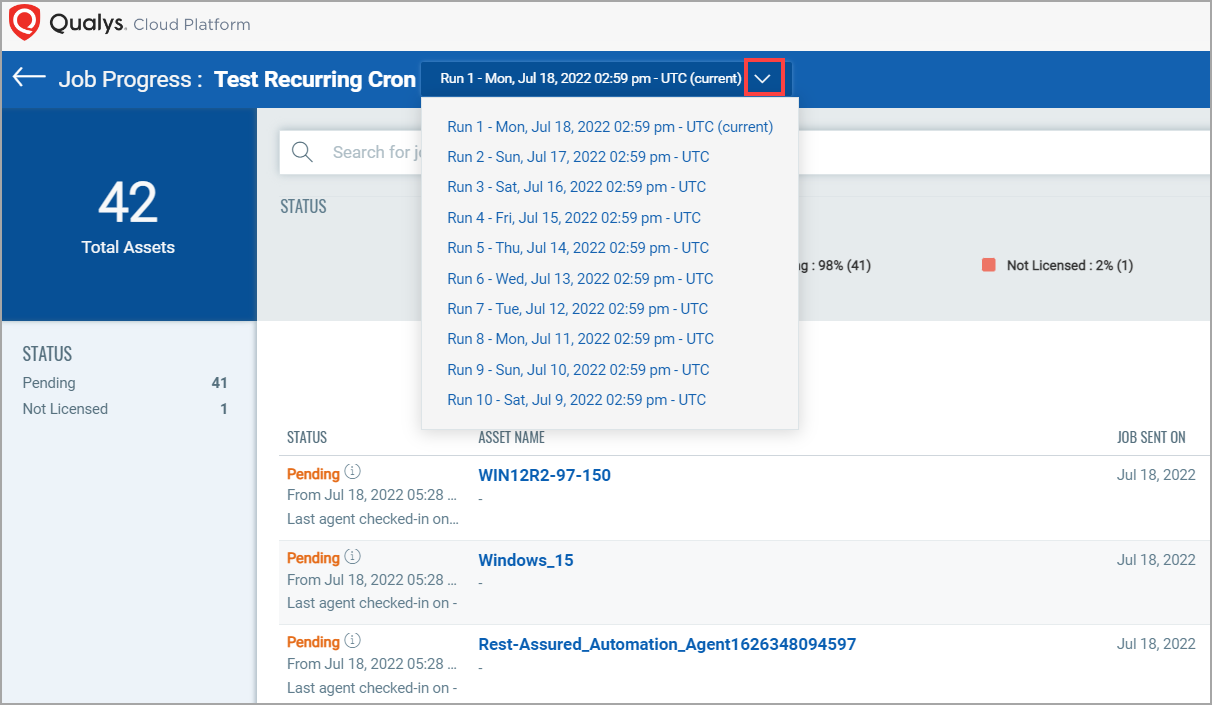
Viewing Job Results for Recurring Jobs
For recurring jobs, you can see the job result history of the latest ten job runs. By default, the latest job run instance is shown. You can see an individual job run by expanding the list that is next to the job name. The list includes the details, such as job run number, job run date, and the time zone. By clicking a particular run from the list, you can see the patching status of your assets for that job run.
- When a job is scheduled to run in a specific time zone, the job run history list shows the time details according to UTC.
- When the job runs according to the agent time zone, the job run history list shows the time details according to the Agent Timezone.
Good to Know About Recurring Jobs
- From the Patch Management 1.9.0.0 release, the results for the last 10 job runs are shown as and when they are received. In the earlier releases, only the latest job run results were shown.
- For all jobs, except jobs with “Disabled” status, the assets count shown in the Assets column on the "Jobs" page is dynamic in nature. The count is shown as per the latest job run. When the job manifest is sent to the agent in the next job run, the asset count gets changed.
- On the "Job Progress" page, any tag changes made are reflected in your next job run.
- When you view details for a particular recurring job from the Quick Actions menu, you see the asset details for the latest job run instance only.
- For Windows jobs, you can download the job progress report for an individual job run instance of the recurring job. To download the report, from the quick actions menu of a particular job, click View Progress. From the Job Progress page, select the job run and click the Download icon and then click Generate Report.
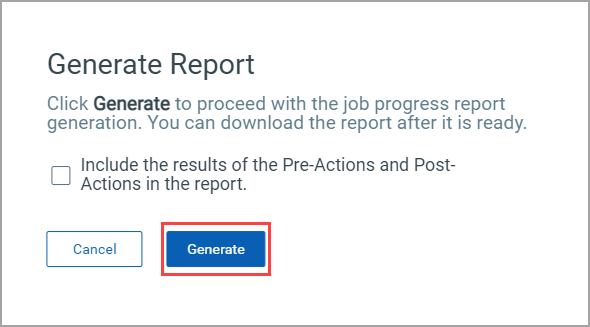
From the Generate Report message window, choose whether you want to include the results of pre-actions and post-actions in the report and click Generate.
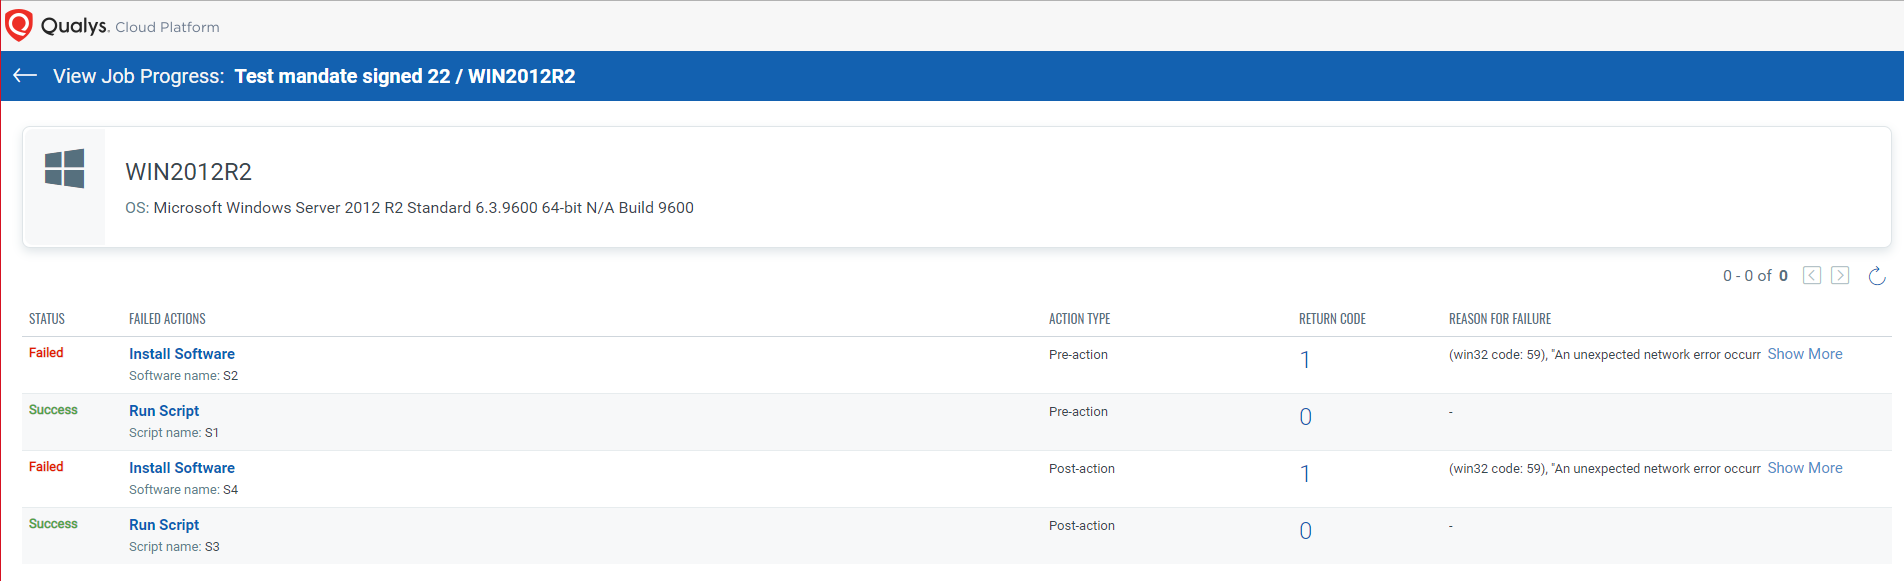
Viewing Action Result Details
You can now add actions that you want to execute before and after the patches are installed for the Windows, Linux, and Mac Deployment jobs. For more information, see About Pre-Actions and Post-Actions.
The View Actions option on the Job Progress page allows you to view results details of actions after the job is executed.
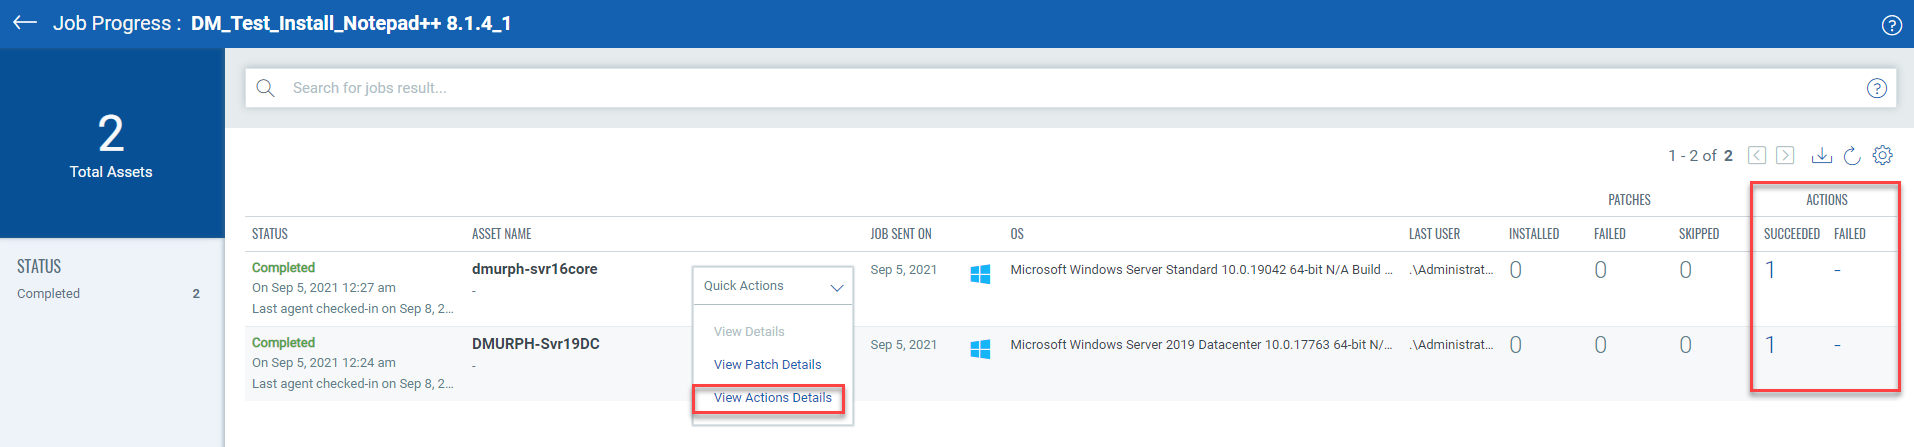
You can view action details from the Job Progress option:
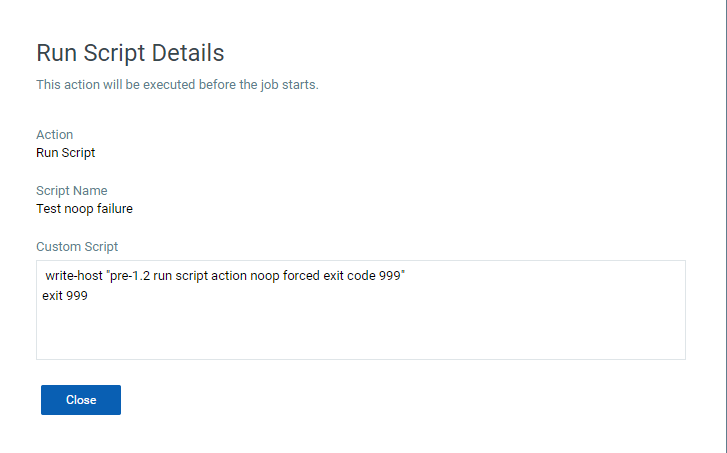
To view the script that was executed, click individual actions:
Viewing Job Progress Details
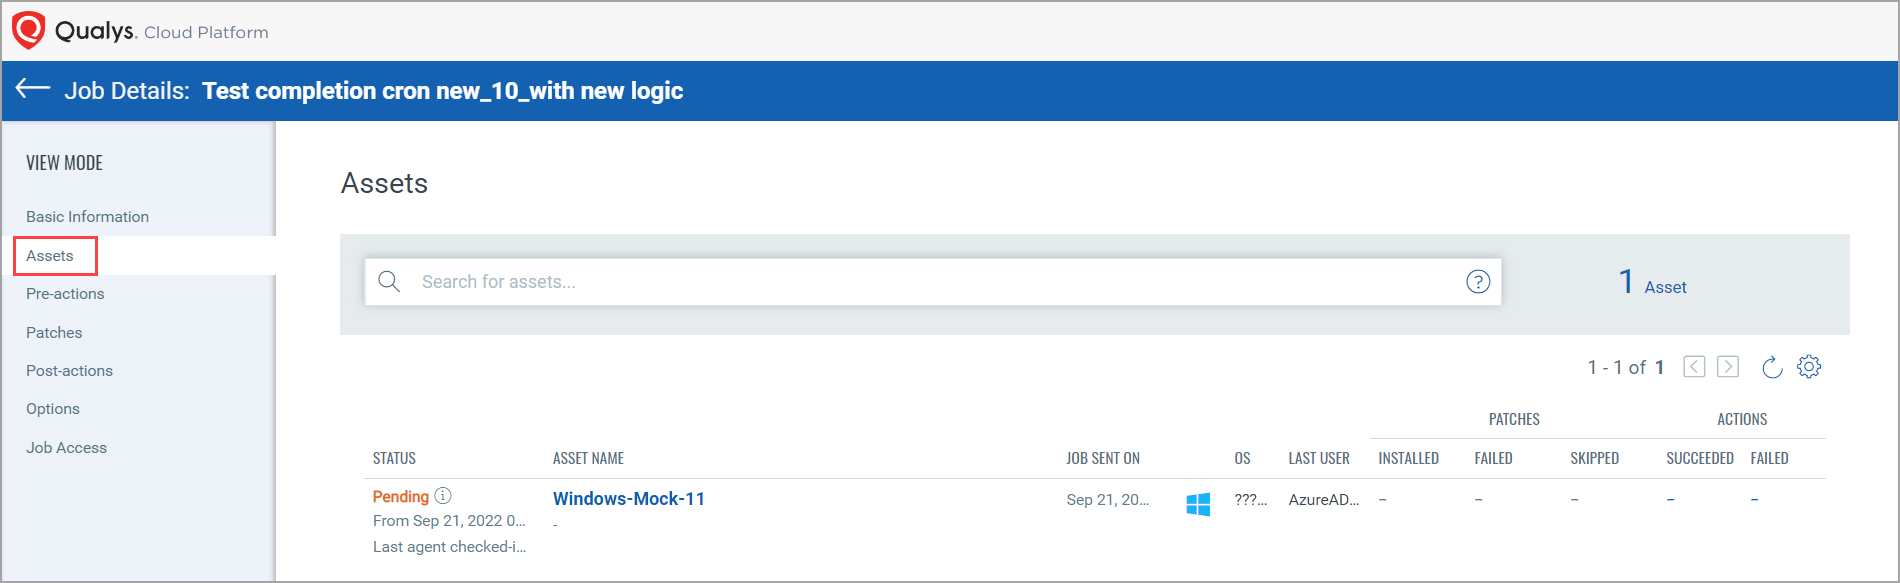
You can see the job progress details for a job by clicking View Details from the Quick Actions Menu. You can see the following tabs to see the respective details.
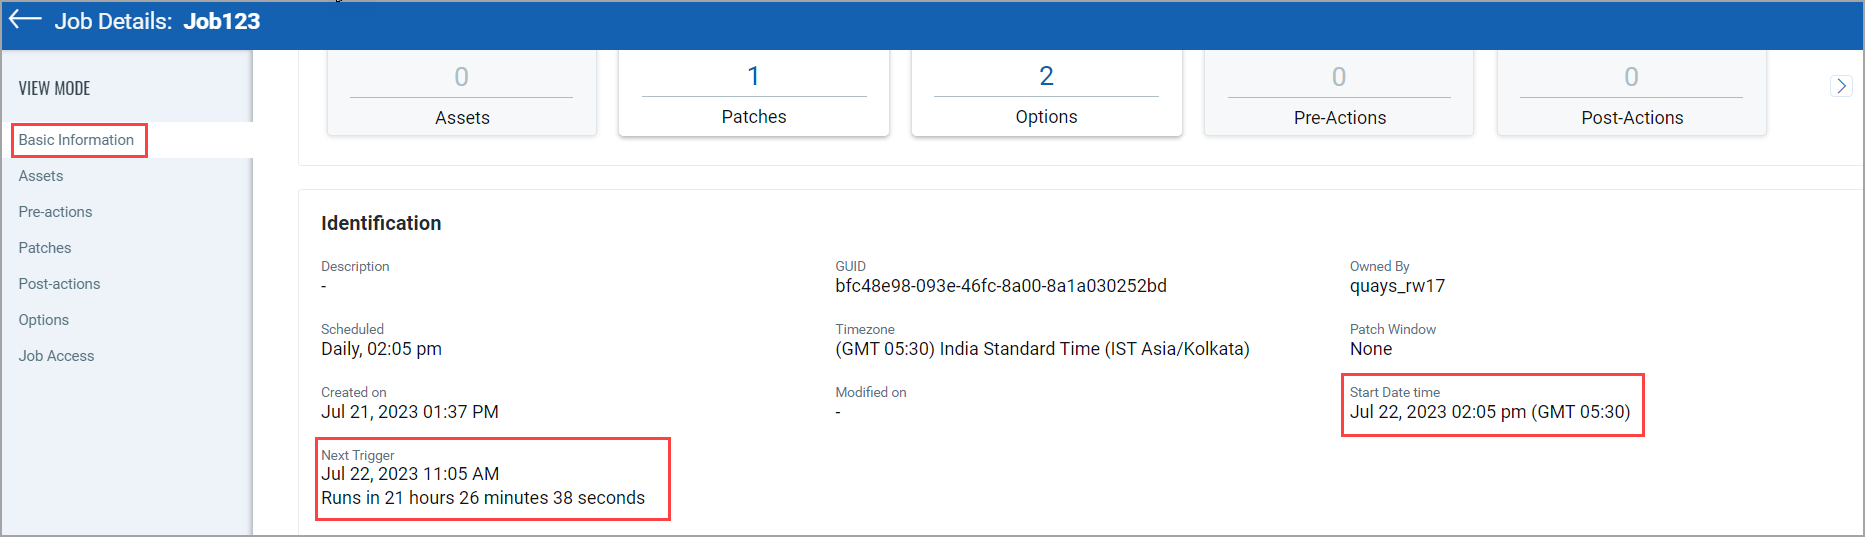
Basic Information
You get the job details, such as job status and type. The tiles, such as Assets, Patches, and Options, are also shown. You are navigated to the respective tab if you click the count from those tiles. In the Identification section, you can see the job details.
Important to Know
- Next Trigger details: The date and time when the manifest is sent to the agent. The manifest is sent approximately three hours before the job starts.
- Start Date time details: The date and time when the job starts.
Note: Irrespective of the system time zone, the Next Trigger and Start Date time details are shown based on the browser time zone.
Assets
You can see the assets that are part of the job. Also, you can see the installed, failed, and skipped patches details and so on.
Pre-actions
You can see the pre-actions details if the pre-actions are included at the time of job creation.
Patches
You can see the patches details
Post-actions
You can see the post-actions details if the post-actions are included at the time of job creation.
Options
The deployment and reboot communication options you selected at the time of job creation.
Job Access
You can see details of the co-author users who can edit this job.