Release 1.10
January 12, 2024
What's New?
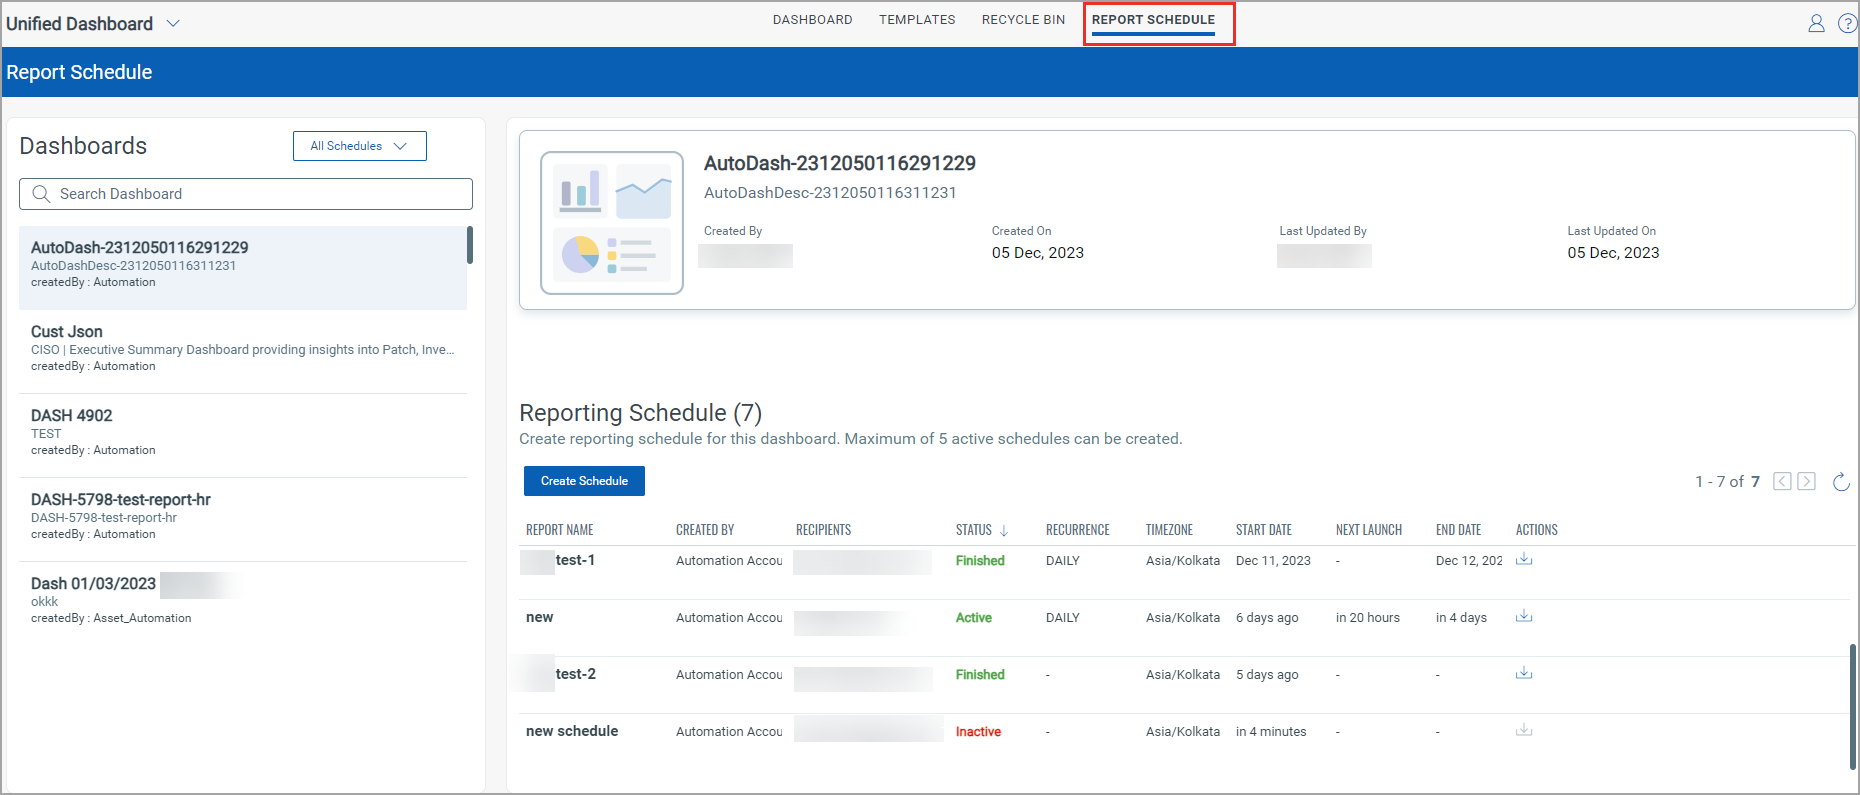
Introduced Report Schedule tab
The Report Schedule tab collectively lists all the dashboards along with the option that gives you information about the reports created by any user or current user. This tab reduces your time to generate data, with all the report schedules and its dashboard information at one place. These reports can be downloaded and shared in .PDF file format.
Use the Report Schedule tab, to search Dashboards and view their schedules using the following options:
- All Schedules - Use this option to list all dashboards that have schedules created by any user.
- My Schedule - Use this option to list all dashboards which has schedules created by the current user.
- Non Schedule - Use this option to list dashboards that do not have any schedules.
For more information to perform quick actions on a report, refer Report Scheduling and Report Schedule section in UD online help.
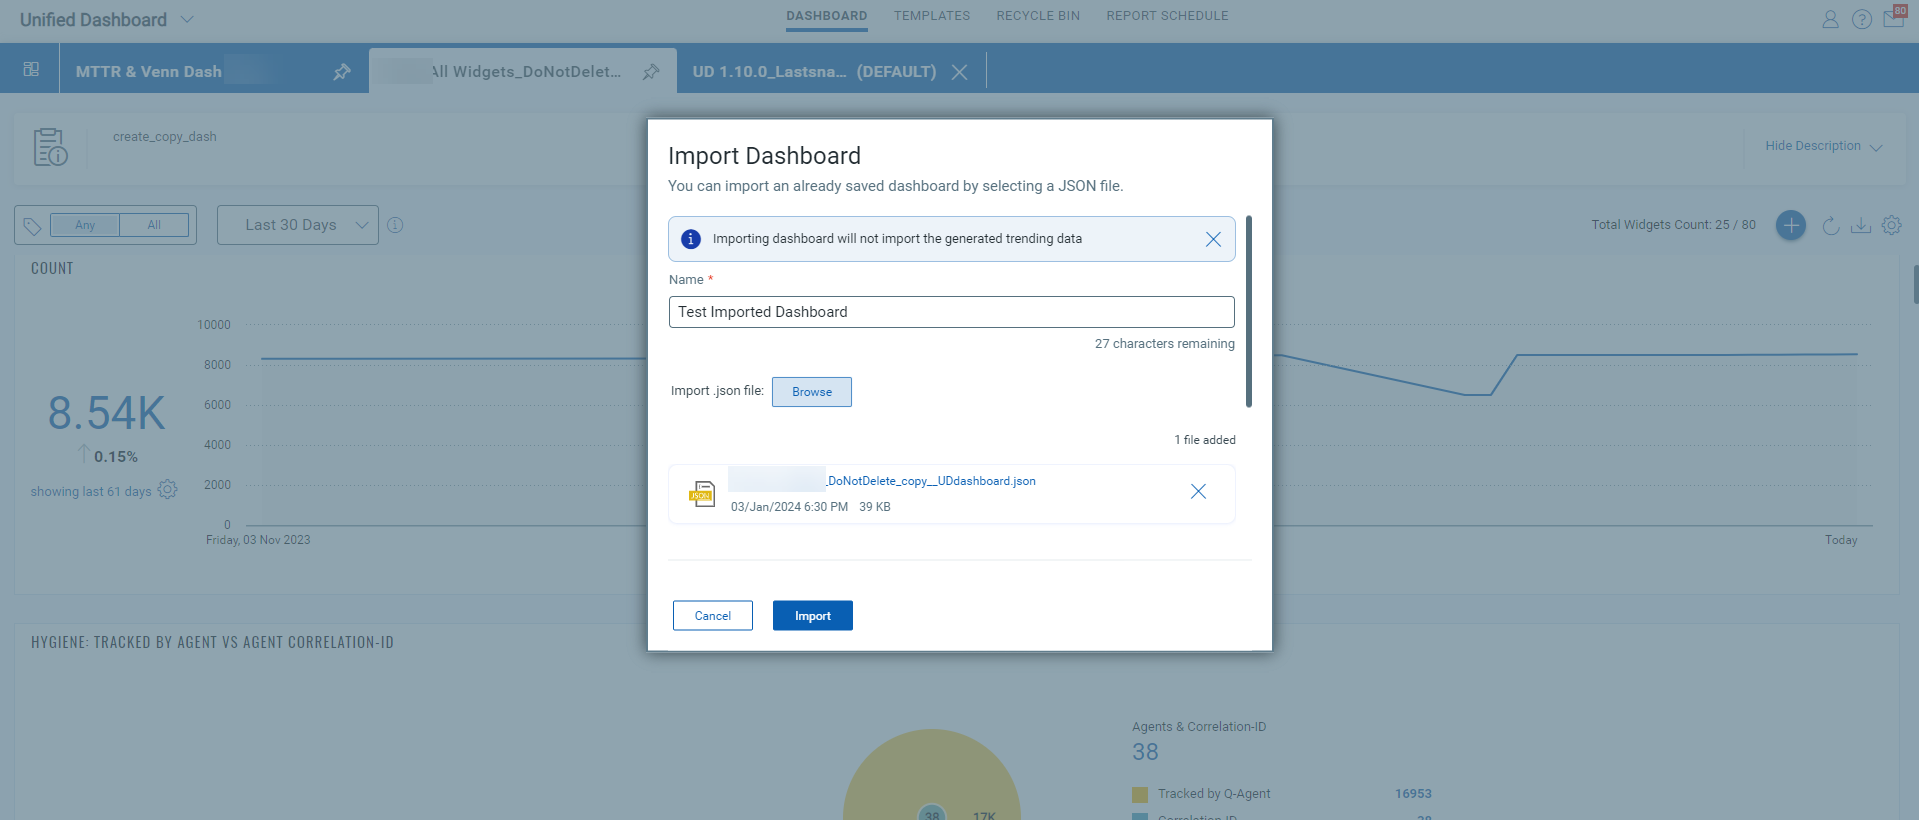
Enhancement in the Import Dashboard
Previously, when you imported a .JSON file to the dashboard, the Trending toggle from the widgets had to be manually enabled. From this release, when a .JSON file is imported, the Trending toggle is, by default, enabled if it was previously enabled in the exported dashboard.
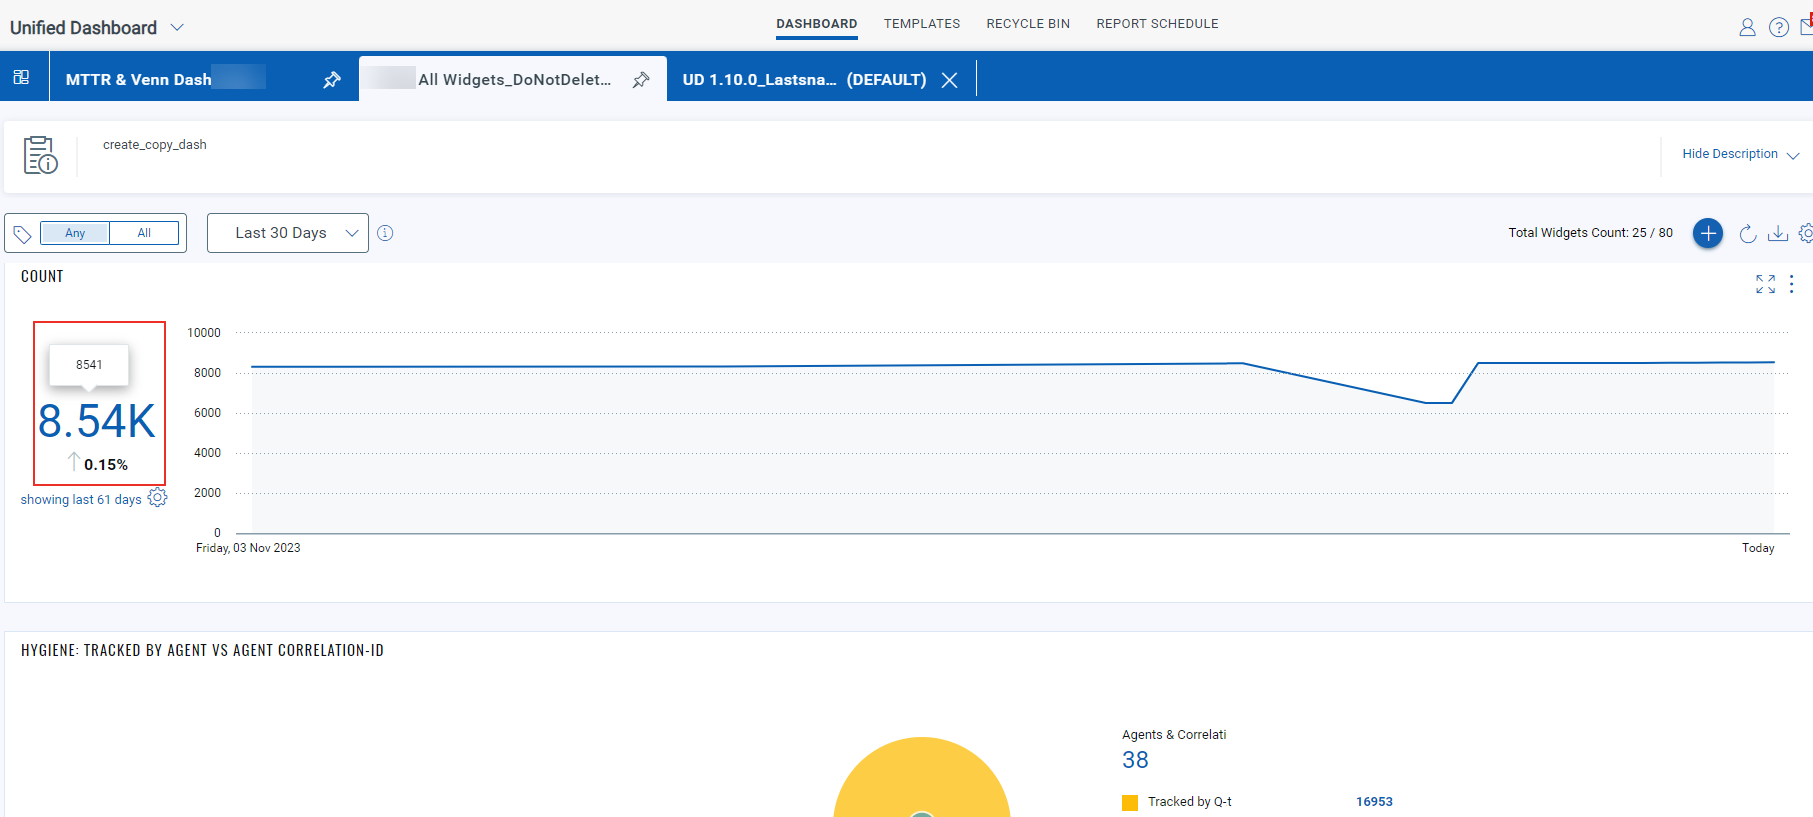
Enhancement in Dashboard Widgets
Previously, only the round-off trending count value on the dashboard widgets was visible. We have enhanced the trend count appearance on the dashboards to display the exact count value. On the dashboard, hover over the trending count or on the trending line value to view the precise count.
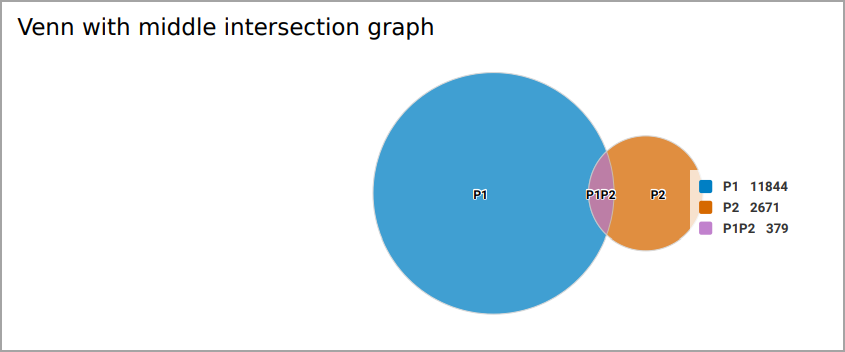
Enhancement in Venn Diagram PDF Report
The Venn Diagram widget has been enhanced with the labels and values of each circle and overlapping circle being represented in the PDF report. The following screenshot is an example of the Venn Diagram with intersection graph in the PDF report:
Issues Addressed
| Category/Component | Issue |
| UD-VM
|
We have fixed an issue where the widget colors on the Dashboard user interface appear exactly as in the dashboard report. |
|
UD-VM |
The layout discrepancy issue for the dashboard report and the scheduled dashboard report is now resolved. |
|
UD-VM |
Previously, while working on multiple tabs, the user could not tag the dashboard temporarily for the session unless the Keep Selection Persistent toggle is enabled. Now, the user can tag dashboards for the particular logged-in session, and selected tags are shown even after switching the tabs. |
|
UD-VM |
Initially, all decimal values between 1 and 99 were shown on the widgets. Now, the issue is fixed, and any decimal value above 99 and below 100 is shown on widgets. |