Viewing Asset Details in VMDR OT
On the Assets tab, you get a detailed consolidated view of your industrial assets. These devices in your industrial network are discovered and profiled by the Qualys Network Passive Sensor.
While this real-time asset inventory provides you with details related to asset metadata, it also helps you gauge the security posture of your industrial IT environment and mitigate the risk of potential cybersecurity threats by managing vulnerabilities well in advance.
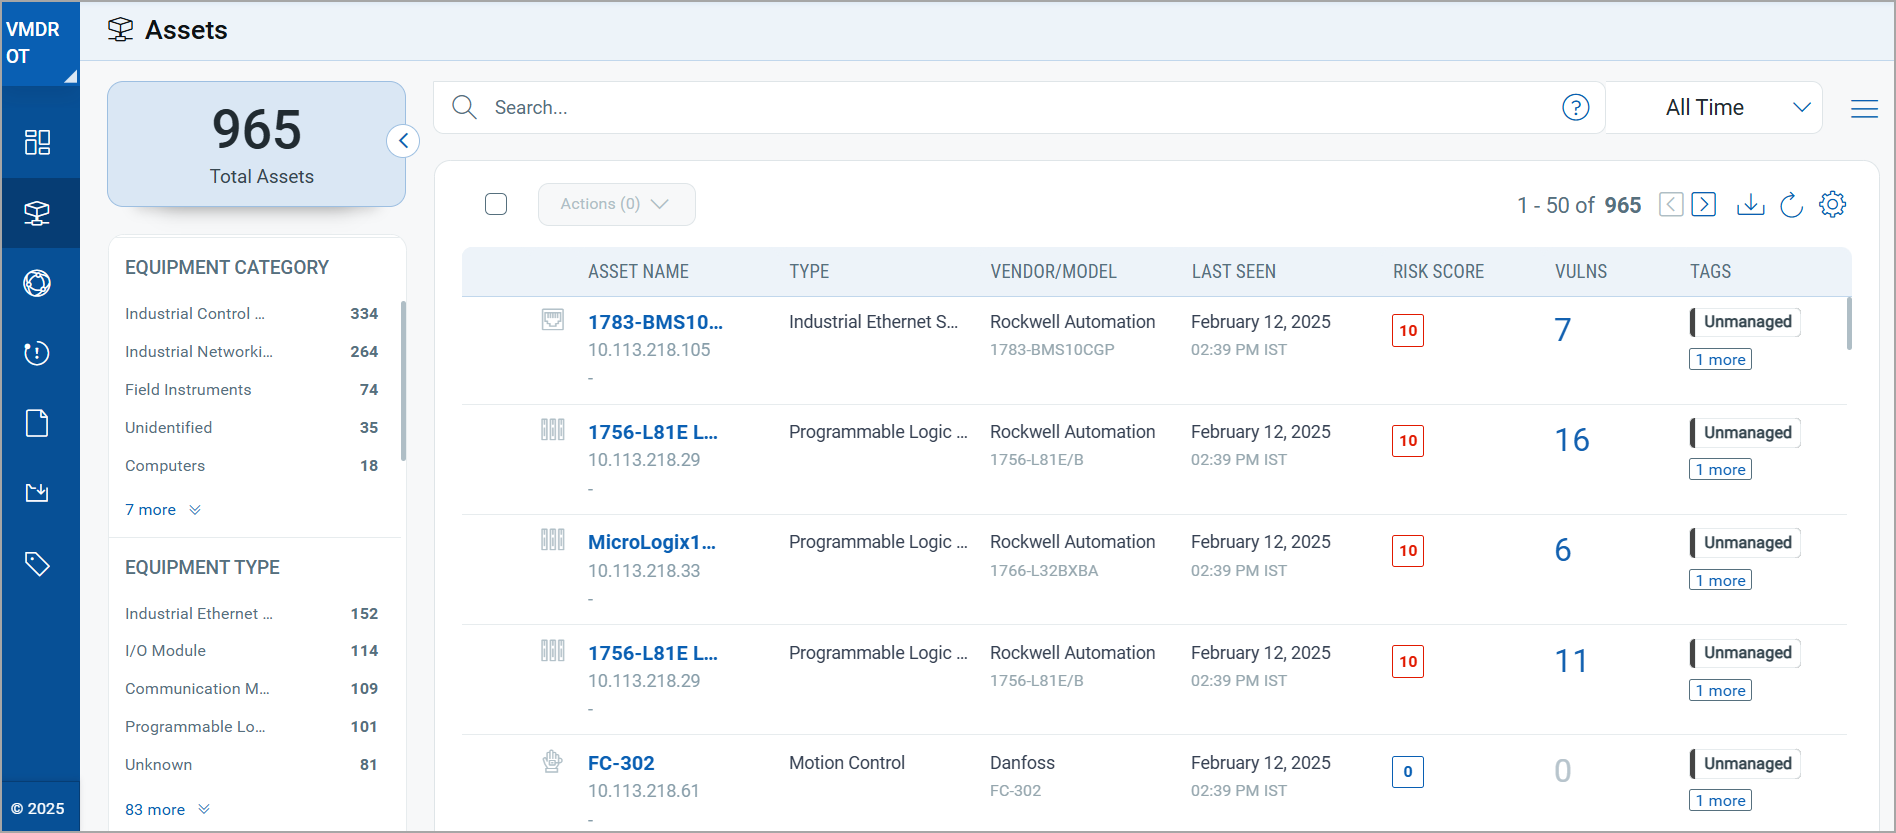
The assets table contains the list of discovered assets along with the following details:
|
Column |
Description |
|---|---|
|
Asset Name |
Displays the name of the discovered asset. If no name is available, the IP address or MAC address is shown as the identifier. Click the asset name to view its detailed information. |
|
Criticality |
Indicates the business criticality level assigned to the asset. The criticality score ranges from 1 to 5, where a higher value represents greater importance to your operational environment. |
|
TruRisk™ Score |
Shows the Qualys TruRisk score for the asset. This score quantifies the overall risk posed by the asset based on factors such as vulnerability severity, asset criticality, and threat intelligence. A higher score indicates greater risk. |
|
Type |
Displays the equipment type of the asset, such as Programmable Logic Controller (PLC), Human Machine Interface (HMI), Motion Control, Industrial Ethernet Switch, Communication Module, Distributed Control System (DCS), or OT Endpoint, among others. |
|
Vendor/Model |
Shows the vendor name and model number of the asset as identified by the Qualys Network Passive Sensor or Industrial OCA. For example, Rockwell Automation - PowerFlex 525 3P 460V 1.0HP. |
|
Last Seen |
Indicates the date and time when the asset activity was last detected on the network. This helps identify inactive or potentially decommissioned assets. |
|
Vulns |
Displays the total count of vulnerabilities detected on the asset. Click the count to navigate to the vulnerability details for the asset. |
|
Tags |
Shows the tags associated with the asset. Tags help you organize and categorize assets for easier management and filtering. |
In the upper left corner, you see the total count of the industrial assets in your network.
In the search bar, you can build QQL queries to narrow down the scope of your asset search by using the supported search tokens. For more information, see Search Tokens for VMDR OT.
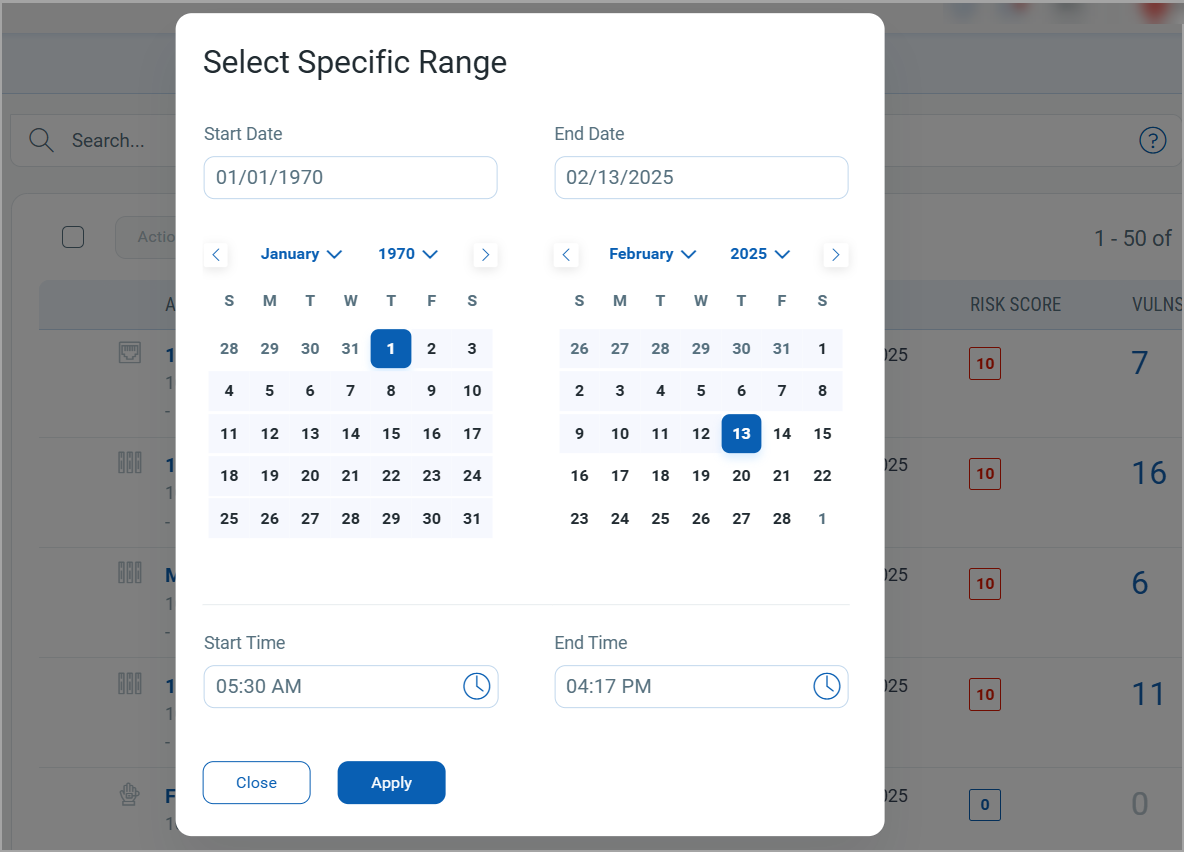
Using the date and time range selector next to the search bar, you can select to view assets discovered within a specific time period.
If you are interested in viewing granular details of an asset, click the asset name. The Asset Details page contains asset information divided into various sections.
You can expand the Inventory, Network, Security, and Source sections from the left pane and see various tabs under each section. To know more about the details you can see from these tabs, refer to the following topics:
Inventory Section Details
Asset Inventory gives you visibility into the assets, granting you a detailed, multidimensional view of each one that encompasses its IT data.
The following tabs are available under the Inventory section:
You can find the following details from the Asset Summary tab:
| Field | Description |
|---|---|
| Asset Summary | |
| Asset Name |
The display name of the asset. Click the edit icon next to the name to modify it. |
| Criticality Score |
The assigned criticality score of the asset. For more information, refer to Asset Criticality Score (ACS). |
| TruRisk™ Score |
The calculated risk score based on vulnerabilities and security posture. For more information, refer to TruRisk™ Score. |
| Last Seen | The most recent timestamp when the asset activity was detected on the network. |
| Identification | |
| Asset Id | Unique identification number of the asset assigned by Qualys. |
| IPv4 Address | The assigned IPv4 address of the asset used for network communication. |
| IPv6 Address | The assigned IPv6 address of the asset, if available. |
| State | The current state of the asset. |
| MAC | The MAC address of the asset. |
| Equipment Class | The broad equipment class of the asset, such as OT. |
| Equipment Category |
The category of the equipment, such as Field Instruments. You can modify the category by clicking the edit icon. |
| Equipment Type |
The specific equipment type, such as Motion Control. You can modify the type by clicking the edit icon. |
| Purdue Level |
The purdue level at which the asset operates. You can change the purdue level by clicking the edit icon. |
| Discovery Protocol | The protocol used to discover the asset. |
| Device Id | The device identifier of the asset. |
| Location | The location of the asset. |
| Vendor Id | The vendor identifier of the asset. |
| Hardware Cataloged | Indicates whether the asset hardware is cataloged. |
| Description |
A description of the asset. You can modify the description by clicking the edit icon. |
| Activity | |
| Last Source | The source that last detected the asset, such as Industrial OCA. |
| Last Seen | The most recent timestamp when the asset was detected. |
| First Seen | The first timestamp when the asset was detected. |
| Tags | |
|
Displays the tags assigned to the asset. Click Add Tags to assign additional tags. You can select Add to favorites or Change tag color from the more options menu. |
|
System InformationSystem Information
The System Information tab provides a comprehensive view of an OT asset’s technical profile, including hardware specifications, operating system or firmware details, and protocol-specific information. The sections displayed depend on the data discovered for the asset.
This tab displays detailed information grouped into the following sections:
| Field | Description |
|---|---|
| Specifications | |
| Manufacturer | The manufacturer of the detected asset, for example Rockwell Automation. |
| MAC Manufacturer | The vendor associated with the asset MAC address. |
| Product | The product name of the asset, for example Allen-Bradley PowerFlex 525 AC Drives. |
| Model | The specific model of the asset, for example PowerFlex 525 3P 460V 1.0HP. |
| Serial No. | The serial number of the asset. |
| Operating System | The operating system or firmware running on the asset, for example Rockwell Automation Firmware 5.001. |
| Firmware Version | The firmware version detected on the asset. |
| Hardware Version | The hardware version of the asset, if detected. |
| Software Version | The software version detected on the asset, if available. |
| Order Id | The order identifier associated with the asset. |
| Product Code | The product code of the asset. |
| Add-on | |
| Displays additional add-on details for the asset. | |
| Protocol Specific Info | |
| Displays protocol-specific details discovered for the asset. | |
View Raw Discovery Data
Click the View Raw Discovery Data to view the asset data in JSON format. You can copy this data for further analysis.
Business InformationBusiness Information
The Business Information tab provides business context for an asset by mapping it to ownership, environment, support structure, and associated business applications.
For more information, refer to CSAM Online Help.
Edit Basic Information
You can update the business information associated with the asset by clicking  .
.
Network Section Details
The Network section provides visibility into the network connectivity and traffic patterns of the asset.
The following tabs are available under the Network section:
Network InformationNetwork Information
You can view the details about the network connection of the asset in the Network Information tab. The details are grouped under Interface Details.
| Field | Description |
|---|---|
| IPv4 Address | The assigned IPv4 address of the asset used for network communication. |
| IPv6 Address | The assigned IPv6 address of the asset. |
| MAC Address | The MAC address of the network interface. |
| MAC Manufacturer | The vendor associated with the MAC address of the network interface. |
| Domain | The domain to which the asset belongs. |
| DNS Server | The DNS servers configured for name resolution. |
| Default Gateway | The IP address of the router that provides access outside the local network. |
| Protocols | The protocols used for network communication by the asset. |
The Network Map tab provides a visual representation of network connections for the asset. It displays source and destination asset relationships along with associated traffic details.
The following details are displayed:
| Column | Description |
|---|---|
| Source Asset | The source asset in the network connection. |
| Source Asset Type | The type of the source asset. |
| First Seen |
The date and time when the source asset was first observed in this connection. |
| Last Seen | The most recent date and time when the source asset was observed in this connection. |
| Destination Asset | The destination asset in the network connection. |
| Destination Asset Type | The type of the destination asset. |
| Protocol/Transport Protocol | The protocol or transport protocol used for the connection. |
| Port | The port used for the connection. |
| Total Usage | The total traffic usage for the connection. |
The Open Ports tab displays all network ports detected on the asset along with details about the services running on those ports. This information helps you assess exposure, identify unauthorized services, and track changes over time.
The following port details are displayed:
| Column | Description |
|---|---|
| Ports | The port number detected as open on the asset. |
| Protocol | The network protocol associated with the port (for example, TCP, UDP). |
| Service | The identified service running on the port (for example, SSH, HTTP). |
| Service Description | Additional context about the detected service, if available. |
| Last Detected On | The date and time at which this port was last detected. |
Traffic SummaryTraffic Summary
You can see the traffic details for Clients and Servers, such as To and From date details, Total Ingress, and Total Egress.
Security Section Details
The Security section provides a comprehensive security posture of an asset by consolidating risk, vulnerability, exposure, and compliance–related insights. The tabs displayed in this section give you actionable visibility into the asset’s security health and help you prioritize remediation effectively.
The following tabs are available under the Security section:
VulnerabilitiesVulnerabilities
The Vulnerabilities tab displays the vulnerabilities detected on the asset. You can filter vulnerabilities by severity and view patchable vulnerabilities. The tab displays Confirmed Vulnerabilities and Potential Vulnerabilities with summary counts by severity.
The following details are displayed for each vulnerability:
| Column | Description |
|---|---|
| QID | The Qualys ID of the vulnerability. Click the QID to view vulnerability details. |
| Vulnerability Title | The title or name of the vulnerability. |
| Severity | The severity level of the vulnerability. |
| Age | The duration since the vulnerability was first detected. |
| QDS | The Qualys Detection Score assigned to the vulnerability. |
| CVE IDS | The CVE identifiers associated with the vulnerability, with links to the NVD database. |
| Rack/Slot | The rack and slot information of the asset, if applicable. |
Patachable Vulnerabilities
You can filter the vulnerabilities by availablity of patch. Click Patachable Vulnerabilities located on top-right corner of the Vulnerabilities tab.
The TruRisk™ Score tab provides a detailed, asset-level view of risk by correlating technical findings with business context. It helps you understand how risky an asset is, why it is risky, and which factors contribute most to that risk, enabling effective prioritization and remediation.
Asset overview
At the top of the page, you can view the primary asset details:
| Field | Description |
|---|---|
| Asset Name | The unique name assigned to the asset. |
| IP | The IP address associated with the asset. |
| Asset Type | Indicates the type of asset, such as OT Device. |
| Owner | Identifies the person or group responsible for the asset. |
| OS | Displays the operating system or firmware running on the asset. |
TruRisk™ Score overview
The TruRisk™ Score represents the overall risk associated with the asset and is derived from:
- Business criticality of the asset
- Security risk factors
- Asset location within the network
The score ranges from 0 to 1000 and is categorized into the following severity levels:
- Low: 0 - 499
- Medium: 500 - 699
- High: 700 - 849
- Critical: 850 - 1000
If the TruRisk™ score is not yet calculated, a message is displayed prompting you to scan the asset to generate the score.
TruRisk™ calculation details
The TruRisk™ Score and its Contributing Factors section displays the contributing factors that affect the asset risk score.
The following contributing factor details are displayed:
- Business Criticality: The asset criticality score contributing to the risk, displayed out of 5.
- Top Risk Factors: The top factors contributing to the overall risk score.
- Recently Trending: Risk factors that are recently trending.
- Risk Calculation: Expandable section showing the risk calculation details.
For more information on TruRisk Score calculation, refer to TruRisk™ Score.
Source Section Details
The Source section provides visibility into how and from where the asset was discovered.
The following tabs are available under the Source section:
The Passive Sensor tab provides the details of the sensor that reported the asset. For assets discovered by the Qualys Passive Sensor, this tab shows sensor information for the asset interfaces.
The Industrial OCA tab displays details of the industrial Out-of-Band Configuration Assessment (OCA) project from which the asset was imported.
The following information is displayed:
| Field | Description |
|---|---|
| Project Name | The name of the Industrial OCA project from which the asset was imported. |
| Plant Location | The plant location associated with the project. |
| File Name | The name of the uploaded project file. |
| File Hash | The hash value of the uploaded project file. |
| Uploaded On | The date and time when the project file was uploaded. |
| Vendor | The vendor associated with the asset in the project. |
| Extension Type | The file extension type of the uploaded project file. |
| User | The user who uploaded the project file. |
The following summary count cards under the Assets tab are shifted to VMDR OT > Dashboard:
- High Risk Devices
- Devices With Vulnerabilities
- Newly Discovered
- Inactive Devices
For more information, refer to Managing Dashboard.