Managing VMDR OT Dashboard
To visualize the assets and vulnerability postures, add widgets to the dashboard. The dashboard tab is the home page for VMDR OT.
To see the VMDR OT dashboard, select VMDR OT from the application selector. On the dashboard, there are summary count cards like high-risk devices, newly discovered devices, new vulnerabilities, active vulnerabilities, and so on by default.
The summary count cards previously available under the Assets tab have been shifted to Dashboard. You need to create a new Dashboard to view the new summary count cards.
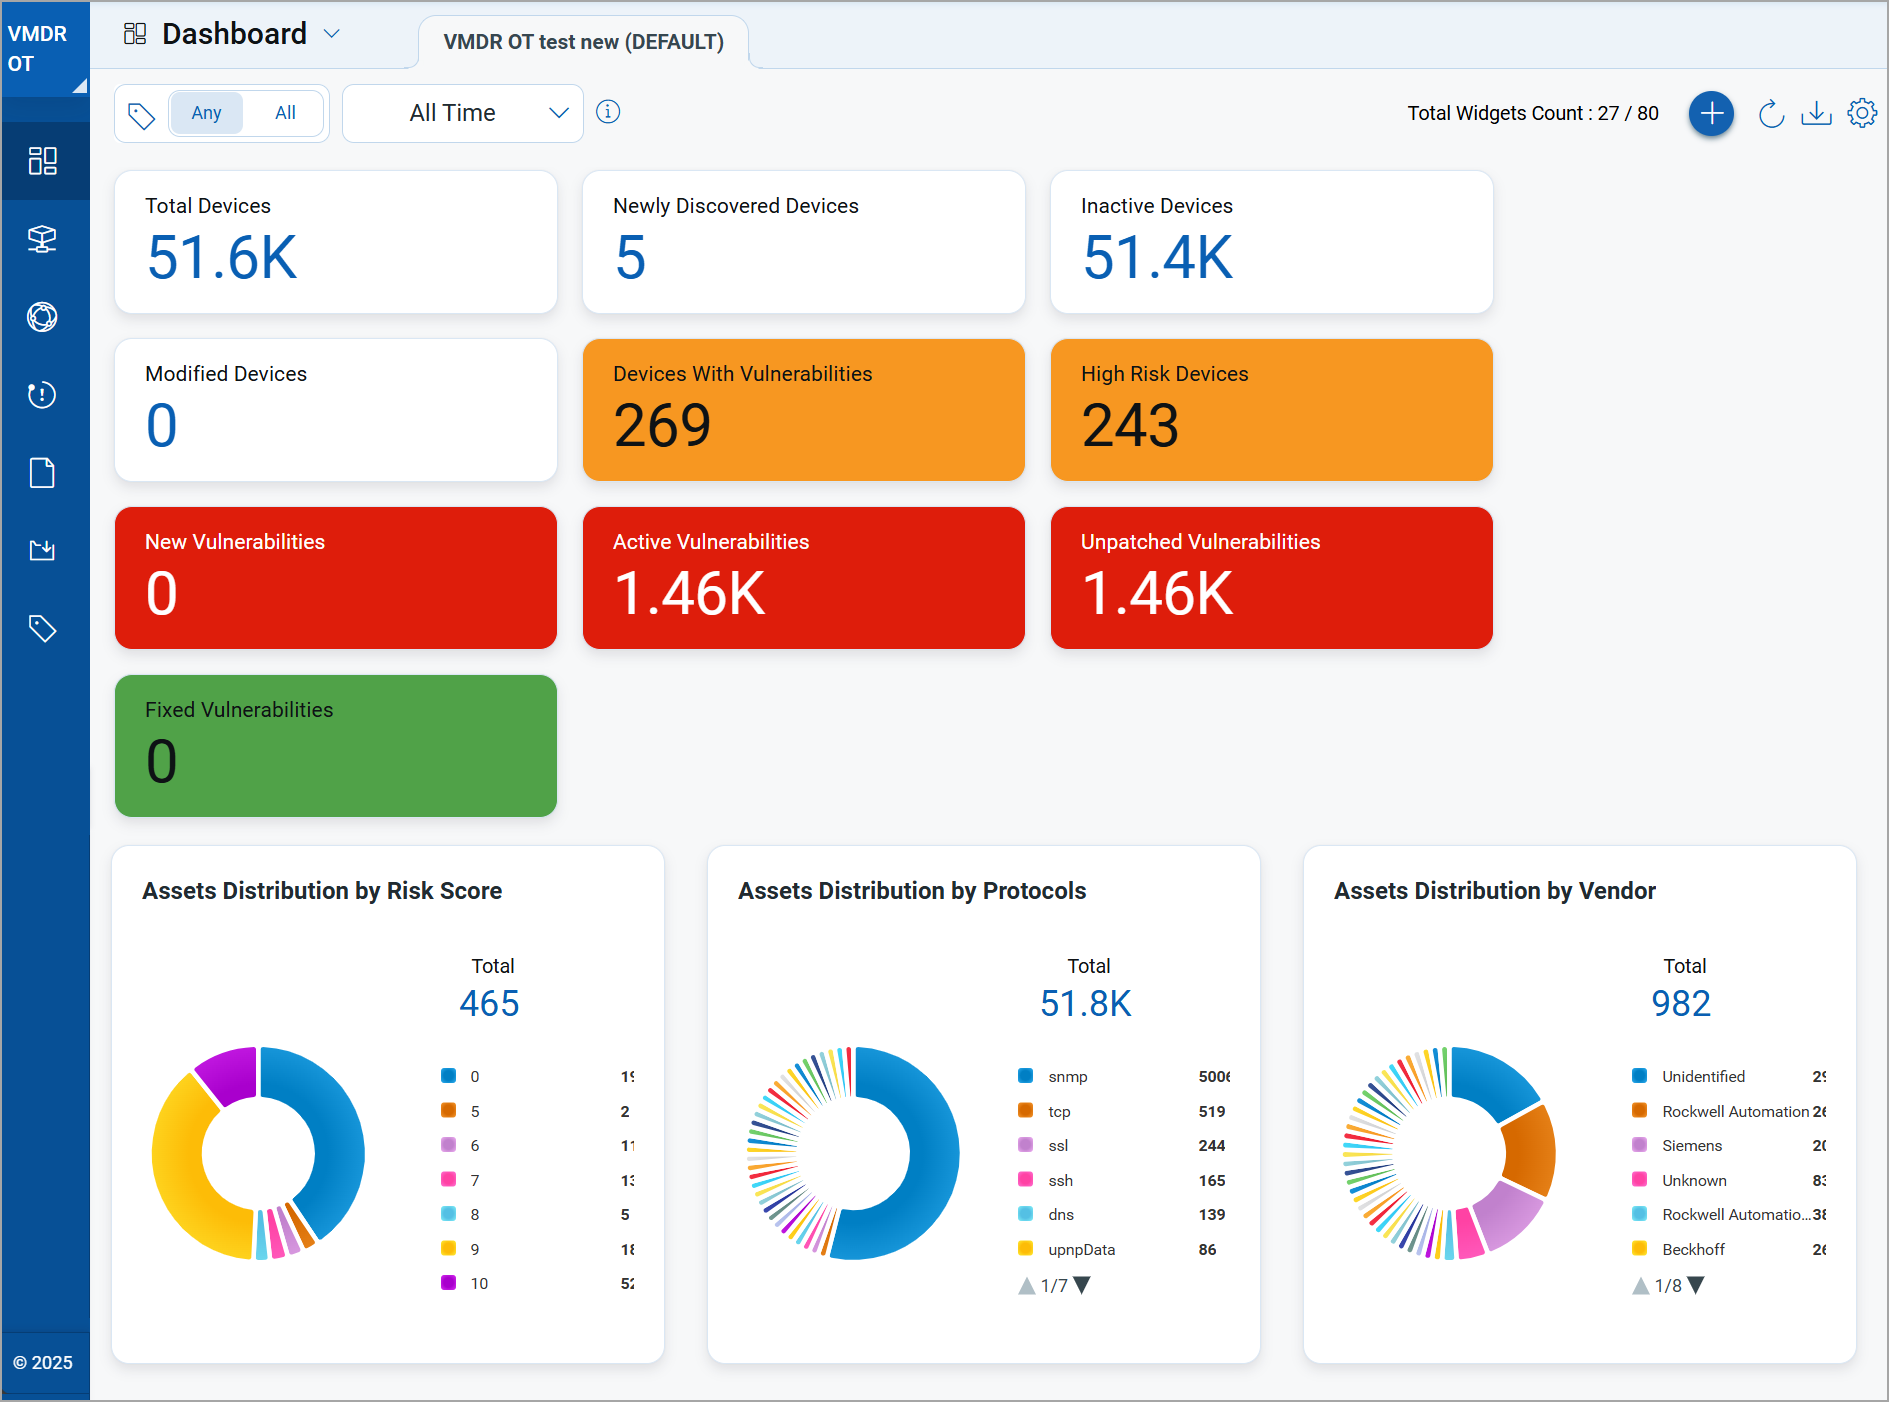
There are different widgets like asset distribution by risk score, asset distribution by protocol, asset distribution by vendors and various widgets based on vulnerabilities by type, vulnerabilities by severity, and so on. Add widgets can be used to add VMDR OT-related widgets.
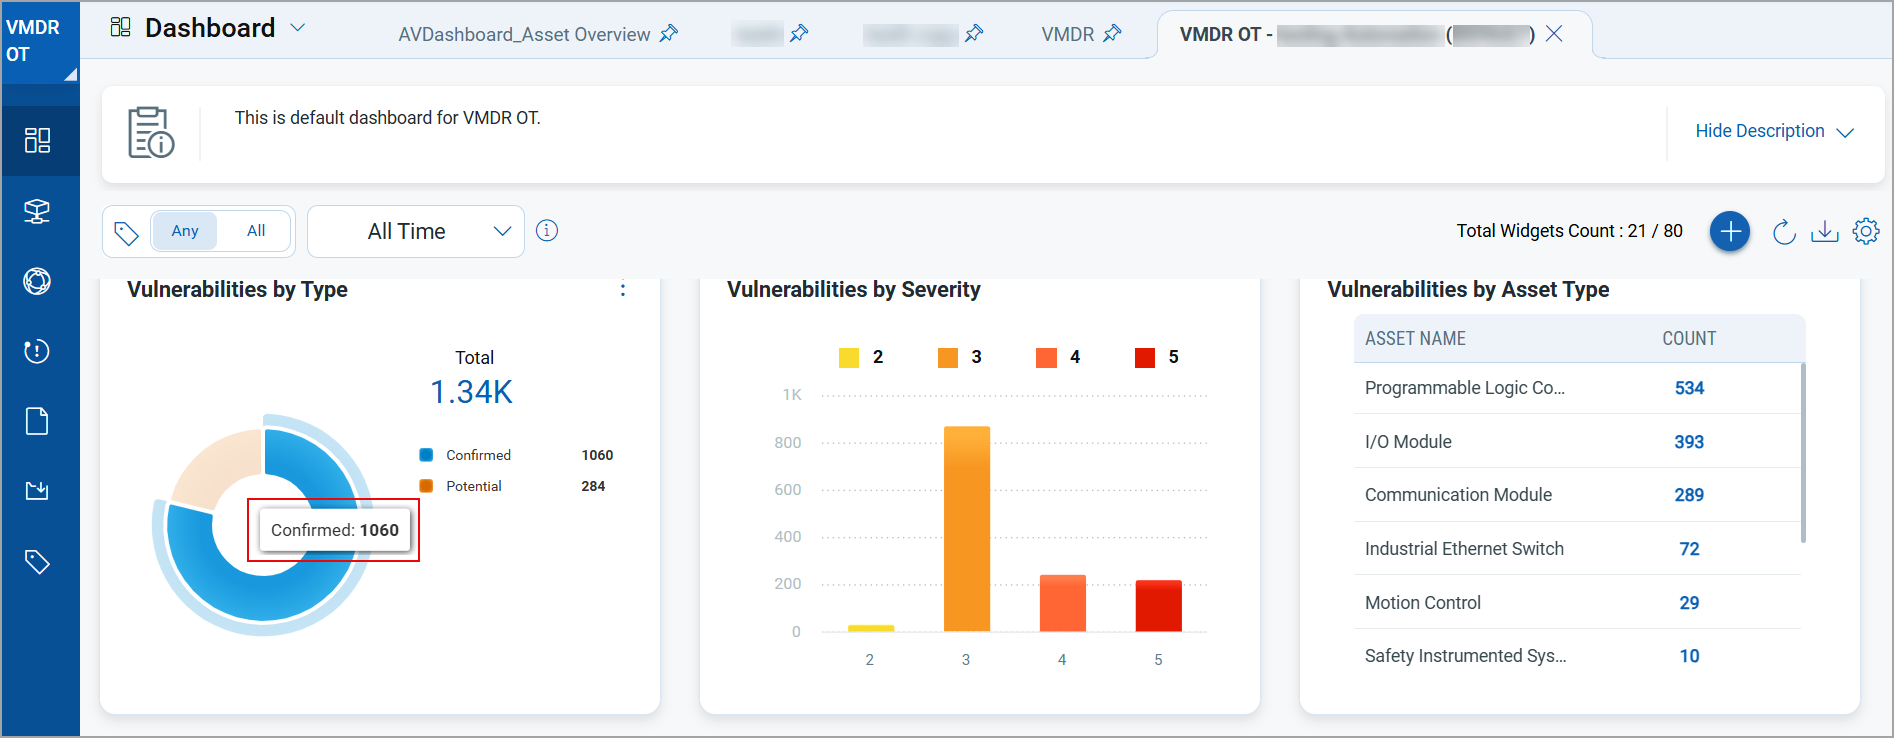
The widgets are interactive; clicking the specific part of the widget redirects to the related tab.
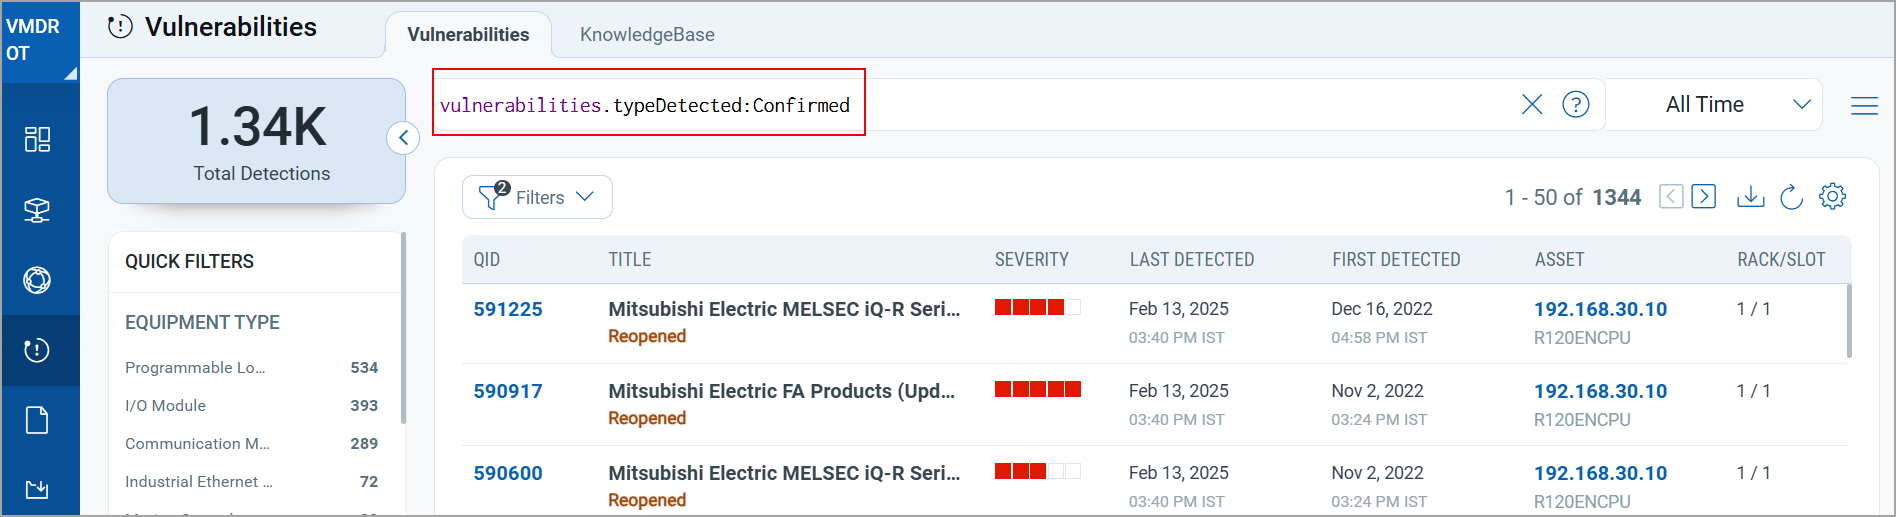
For example, here in the VULNERABILITIES BY TYPE widget, clicking Confirmed takes you to the Vulnerabilities tab for the details of confirmed vulnerabilities.
The confirmed vulnerability details are displayed.
Dynamic dashboards help you customize the way you view your information. Qualys provides a default dashboard to get started.
Viewing Unified Dashboard
Dashboards help to visualize the assets, see the threat exposure, leverage saved searches, and quickly fix the priority of vulnerabilities.
Qualys VMDR OT integrates with Unified Dashboard (UD) to bring information from all Qualys applications into a single place for visualization. UD provides a powerful, new dashboarding framework and platform service that will be consumed and used by all other products to enhance the existing dashboard capabilities.
Qualys VMDR OT offers several dashboards out-of-the-box. Each dashboard displays a short description of the information it offers. It is easy to configure widgets to pull information from other applications and add them to the dashboard. As per requirement, many dashboards can be added to customize the view.
See the Unified Dashboard help for more information.