VMDR OT Release 1.2
April 21, 2025
Introduced New Reports Tab
In this release, we have added a new Reports tab that allows you to create, schedule, edit, download, and delete VMDR OT reports. Reports provide all detailed information in one file, eliminating the need for manual data compilation and significantly saving time and effort.
You can create and generate detailed reports of Assets, Vulnerabilities, and Networks using predefined templates. You can also schedule reports to run at specific dates and times, automating the report generation process so you do not have to generate them manually each time. These schedule details are available to view under the Reports > Schedules tab.
Additionally, reports can be downloaded in CSV format for further analysis.
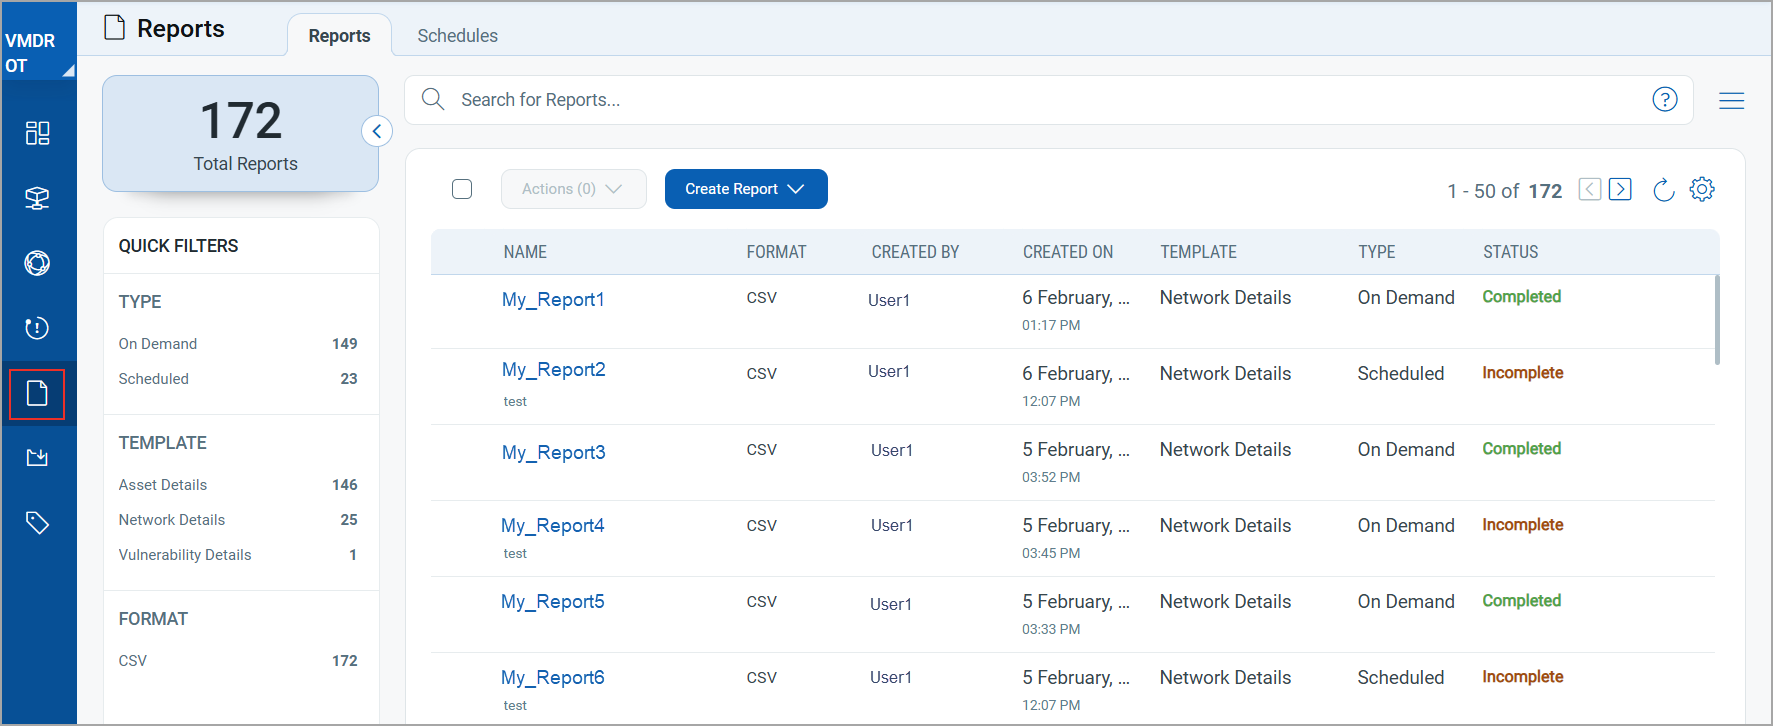
For more information on VMDR OT reports, refer to VMDR OT Online Help.
Ability to View External IPs
With this release, you can now view the list of all external IPs (unidentified IPs) that are communicating with your organization's internal IPs. This feature helps you to:
- Monitor communications between internal IPs and external IPs.
- Detect suspicious connections.
- Identify potential security threats.
An External IP is defined as any IP that is outside the organization’s network or not configured in the organization's internal asset group.
When an external IP communicates with an internal IP, it is labeled as External in the Network > List View tab. The total number of external IPs is displayed below this indication. You can also view this information about a particular asset on Asset Details > Network > Network Map.
Click on the total number of IPs to view the details for each external IP.
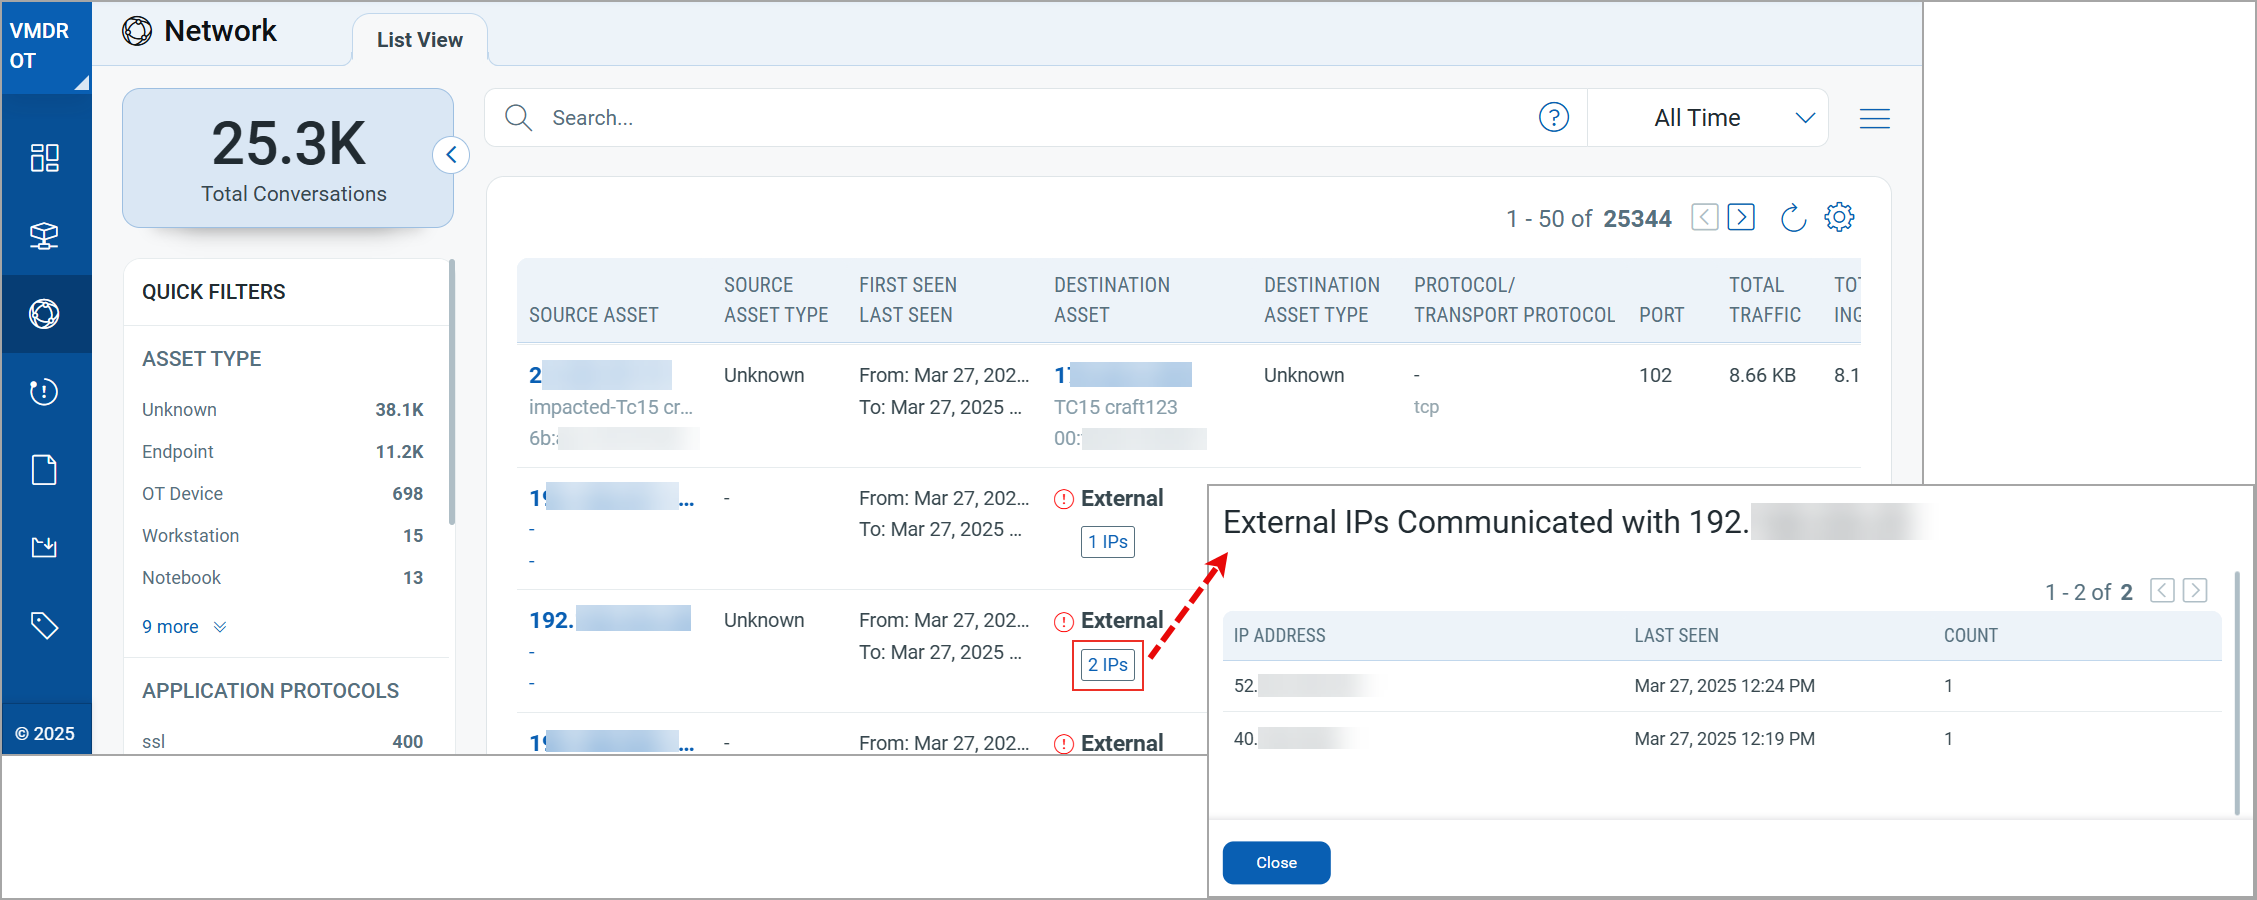
For external IPs to be listed in the VMDR OT > Network > List View tab, the required version of the NPS appliance should be 2.0 and above.
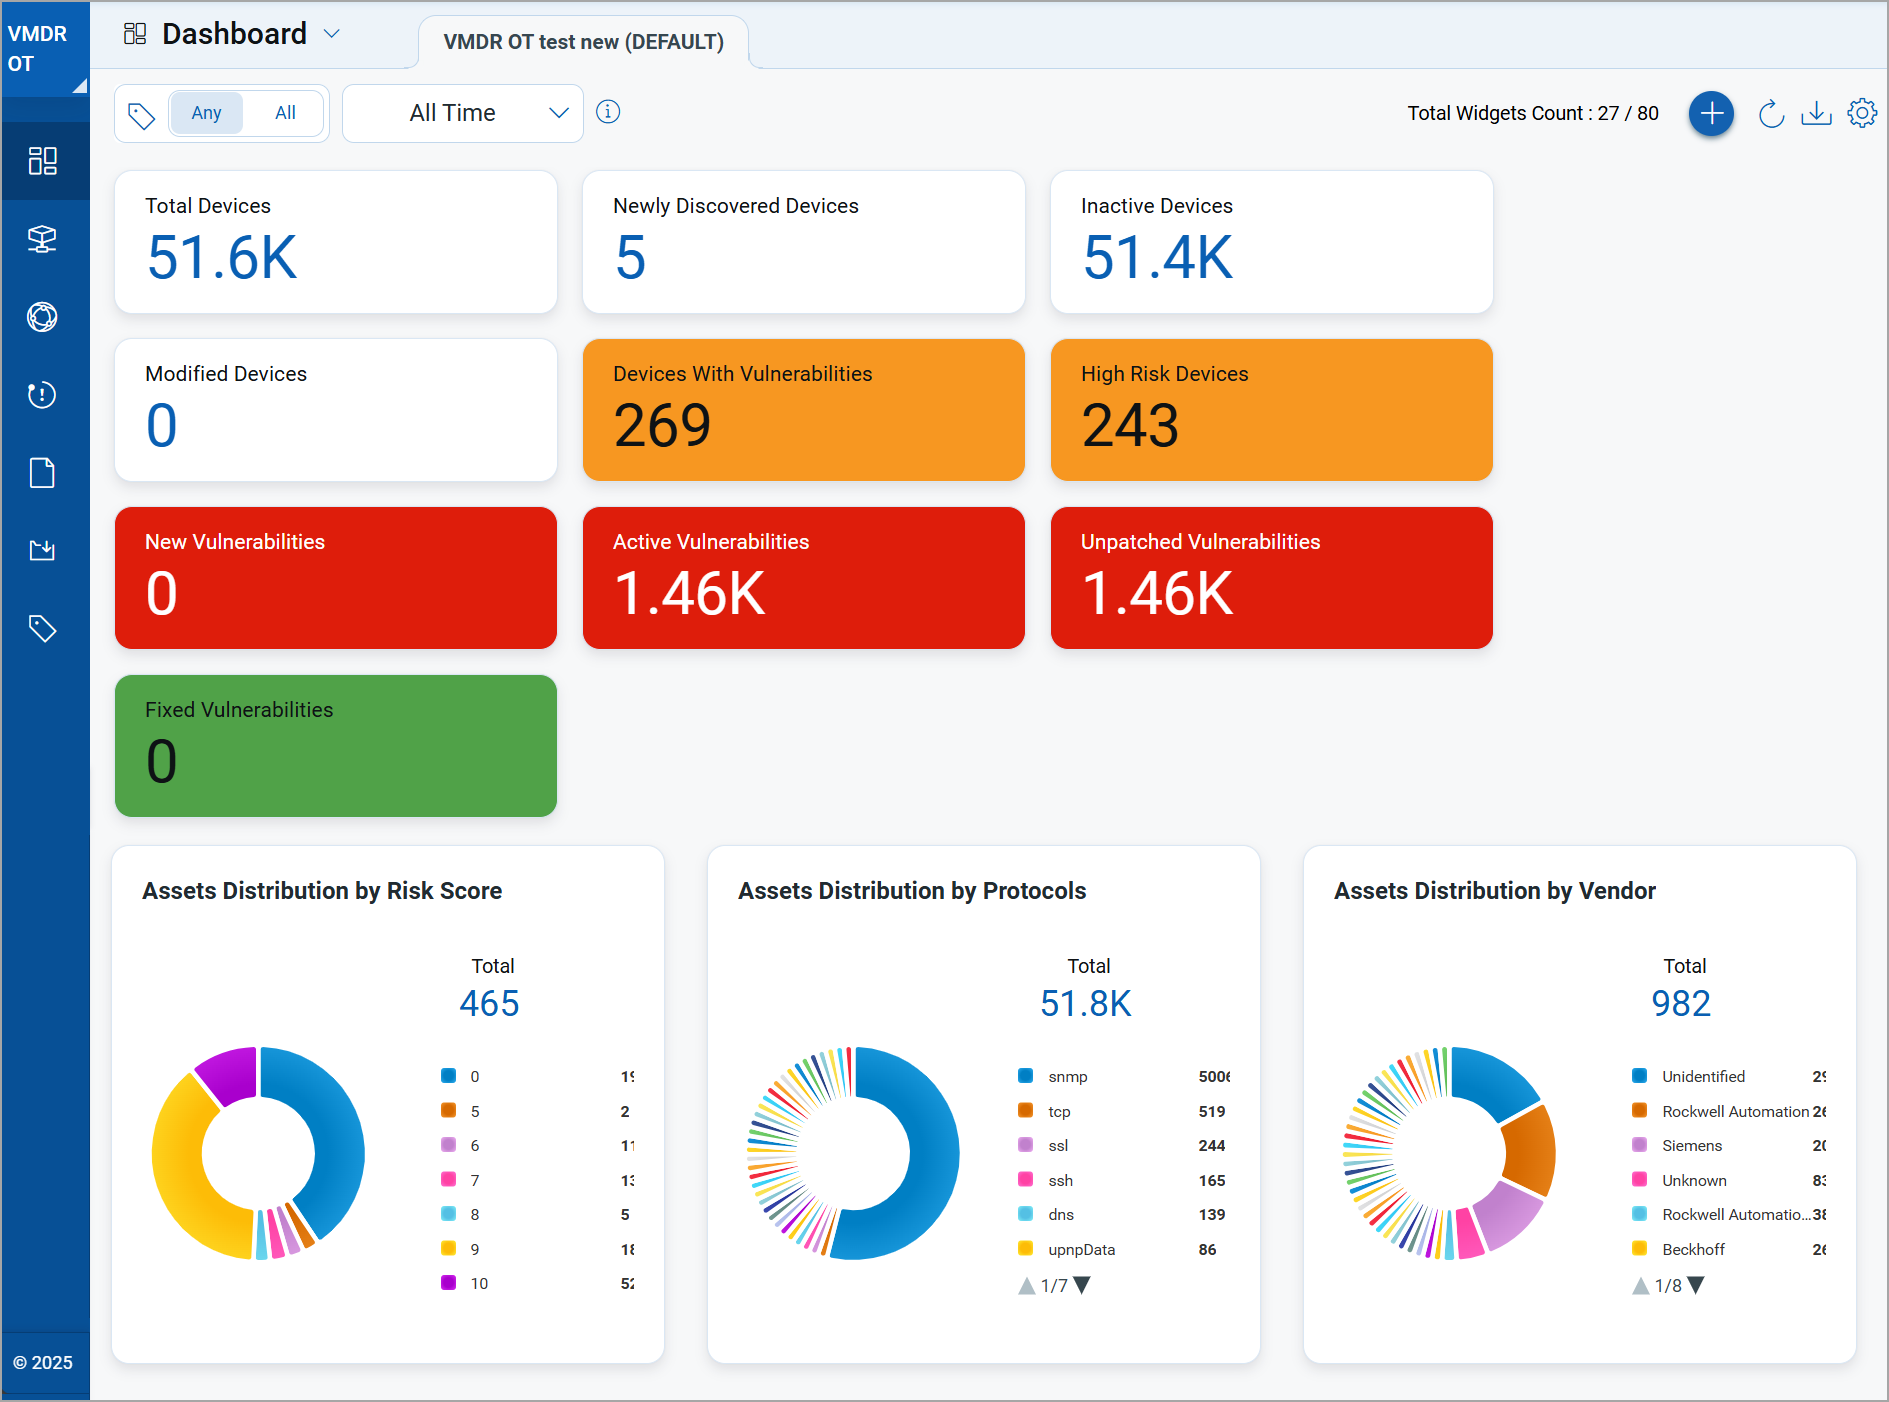
New Summary Count Cards on VMDR OT Dashboard
The summary count cards previously available under the Assets tab have been moved to the Dashboard tab. The following summary cards are now available on the Dashboard tab:
- Newly Discovered Devices
- Inactive Devices
- High-Risk Devices
- Devices With Vulnerabilities
You must create a new Dashboard to view the new summary count cards.
Support for Parsing New File Formats
In this release, we have enhanced the asset information import functionality to support additional project file formats from vendors such as Beckhoff, Siemens, and Red Lion Controls.
You can now import the following new project file formats.
| Vendor | Engineering Tool | Project File Formats |
|---|---|---|
| Beckhoff | TwinCAT 2.x | .zip, .tsm, .wsm |
| Siemens | TIA Portal | .zap16 |
| Red Lion Controls | Crimson | .cd32 |
New Tokens for Reports Tab
| Token/Description | Description | Example |
|---|---|---|
| createdBy: | Use this token to search reports based on the user who created the report. | createdBy: John |
| report.format: | Use this token to search reports based on the report format. | report.format: csv |
| report.name: | Use this token to search reports based on the report name. | report.name: my-sample-report |
| report.status: | Use this token to search reports based on the report status. The report statuses include:
|
report.status: Completed |
| report.template: | Use this token to search reports based on the report templates. The report templates include:
|
report.template: Asset Details |
| report.type: | Use this token to search reports based on the report generation type. The generation types include:
|
report.type: Scheduled |
New Tokens for Network Tab
| Token/Description | Description | Example |
|---|---|---|
| traffic.external. address: |
Use this token to search the network traffic using the external IP. | traffic.external.address: |