View Asset Details
The Assets section lists the Images and Containers discovered along with their metadata information like ports, networks, services, users, installed software, and so on. The assets are listed along with their associations like associated containers and hosts for an image, other containers from the same parent image. Users can search for images and containers based on their attributes.
ClustersClusters
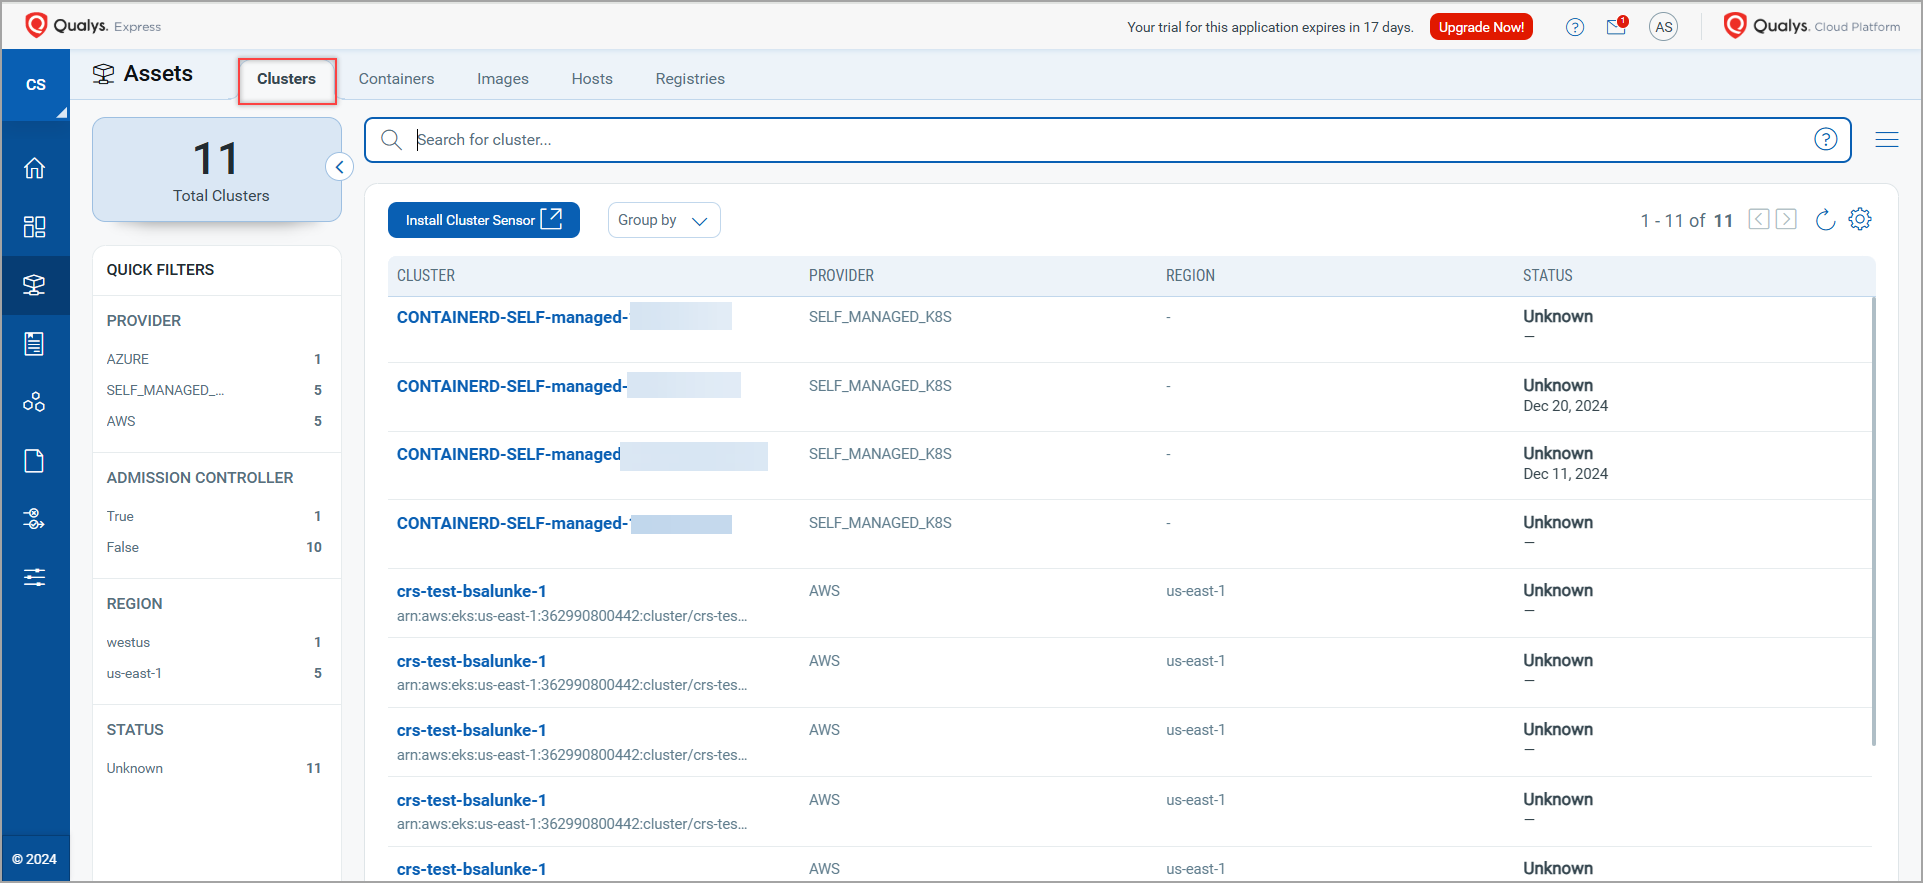
The Assets > Clusters tab shows the discovered clusters and their details.
| Column Name | Description |
| CLUSTER | Shows the name of the cluster. |
| PROVIDER | Shows the name of the cloud provider. For example, 'AWS'. |
| REGION | Indicates the region in which the cluster is deployed. |
| STATUS | Specify if the cluster is,
|
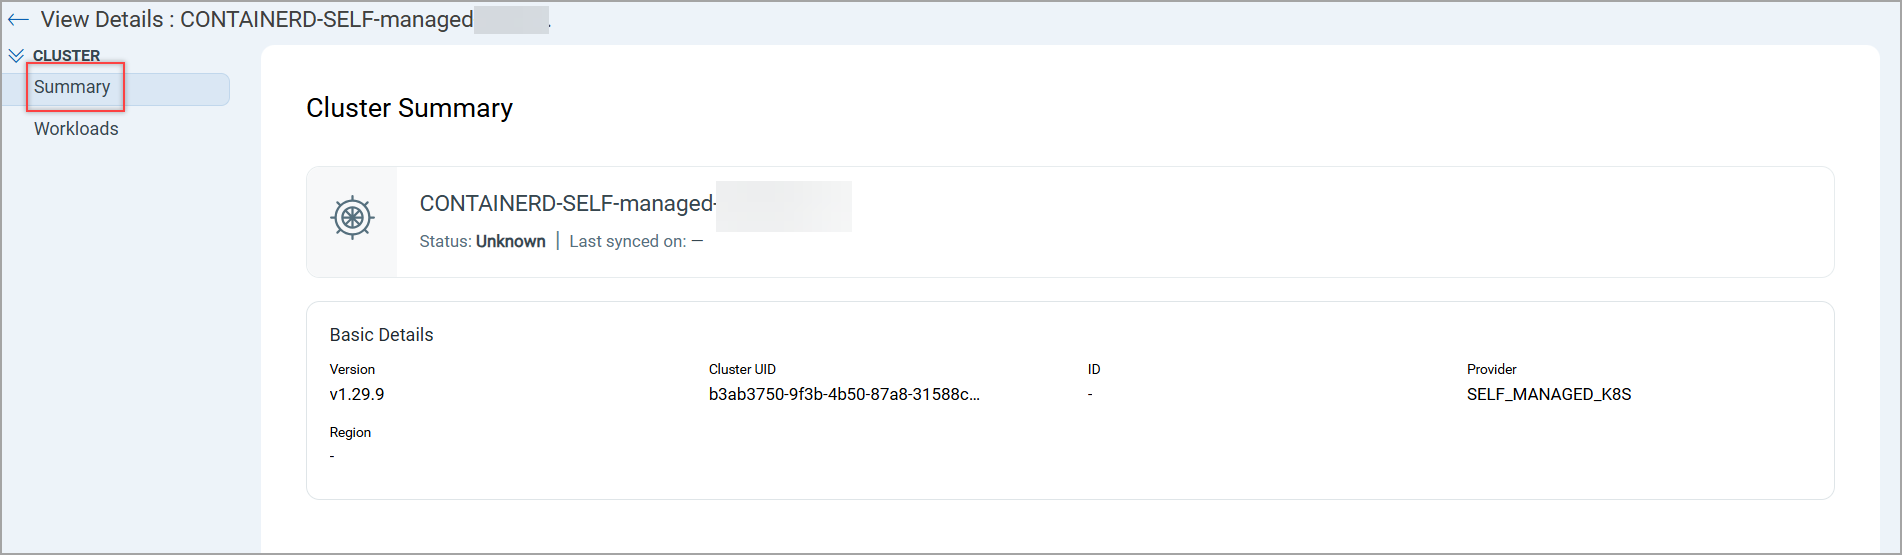
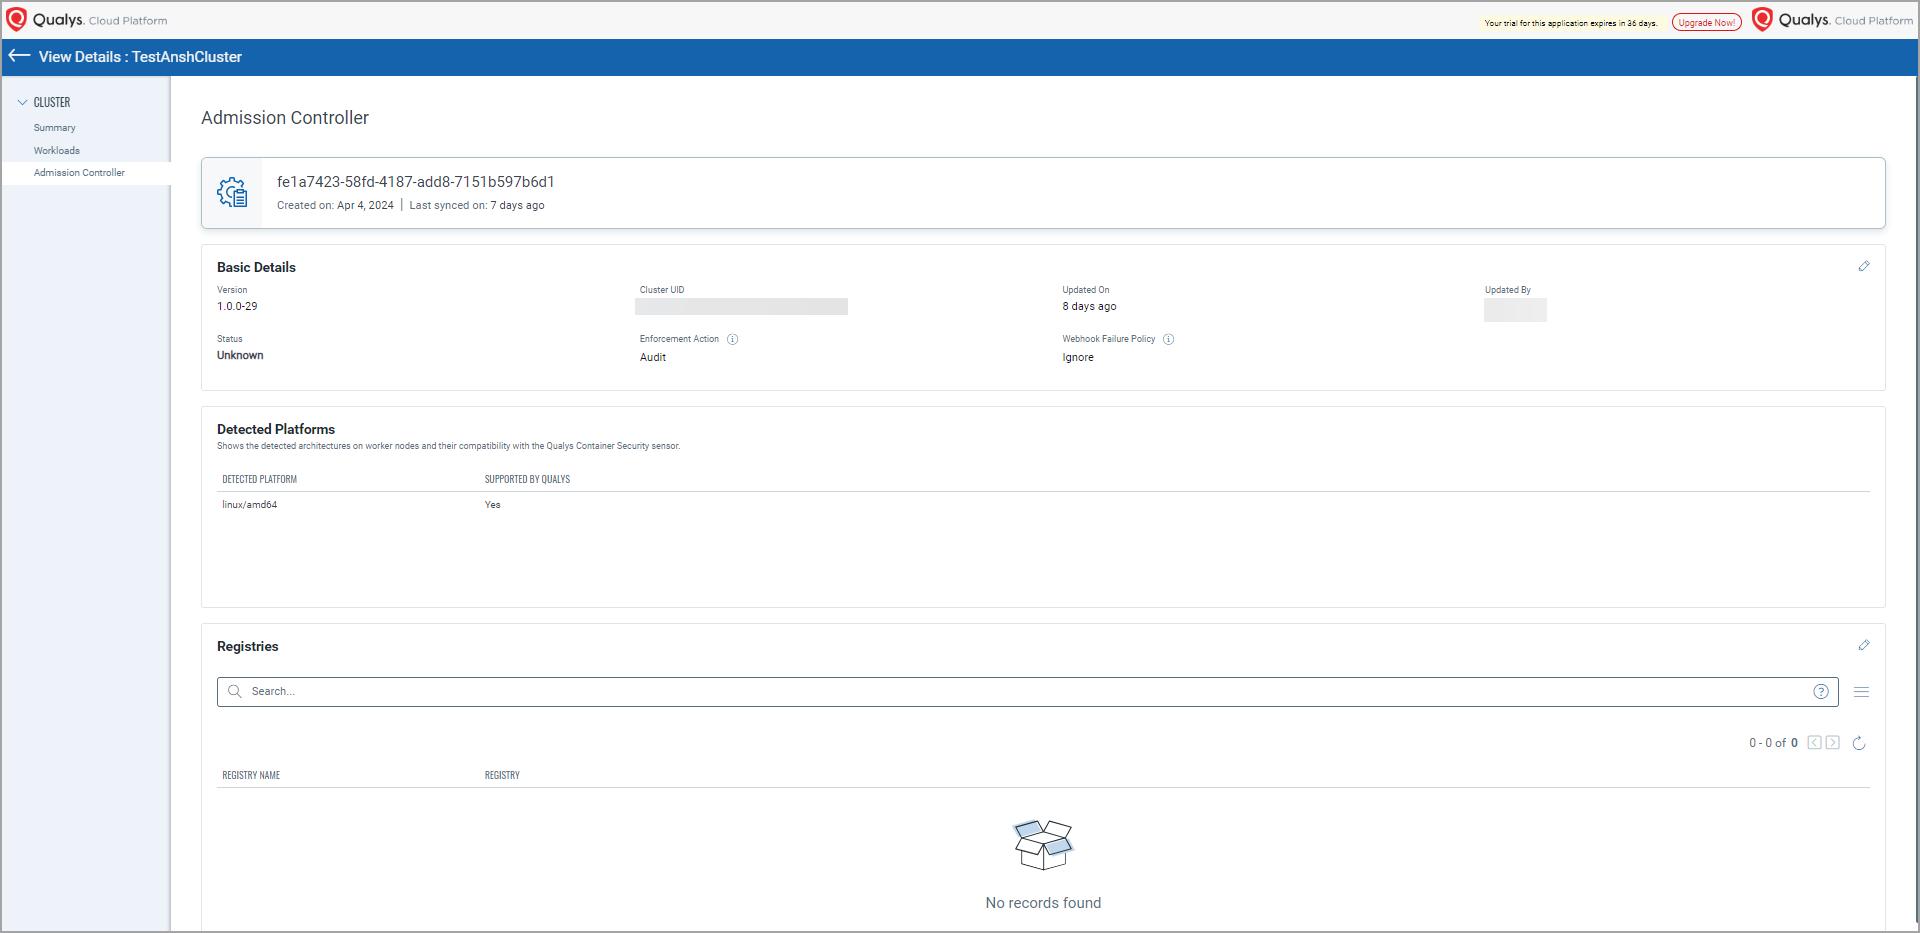
View Cluster Details
Select View Details from the Quick Actions menu to see Cluster Summary. This page gives you detailed information about the cluster, its IDs, cloud provider, and region in which the cluster is deployed.
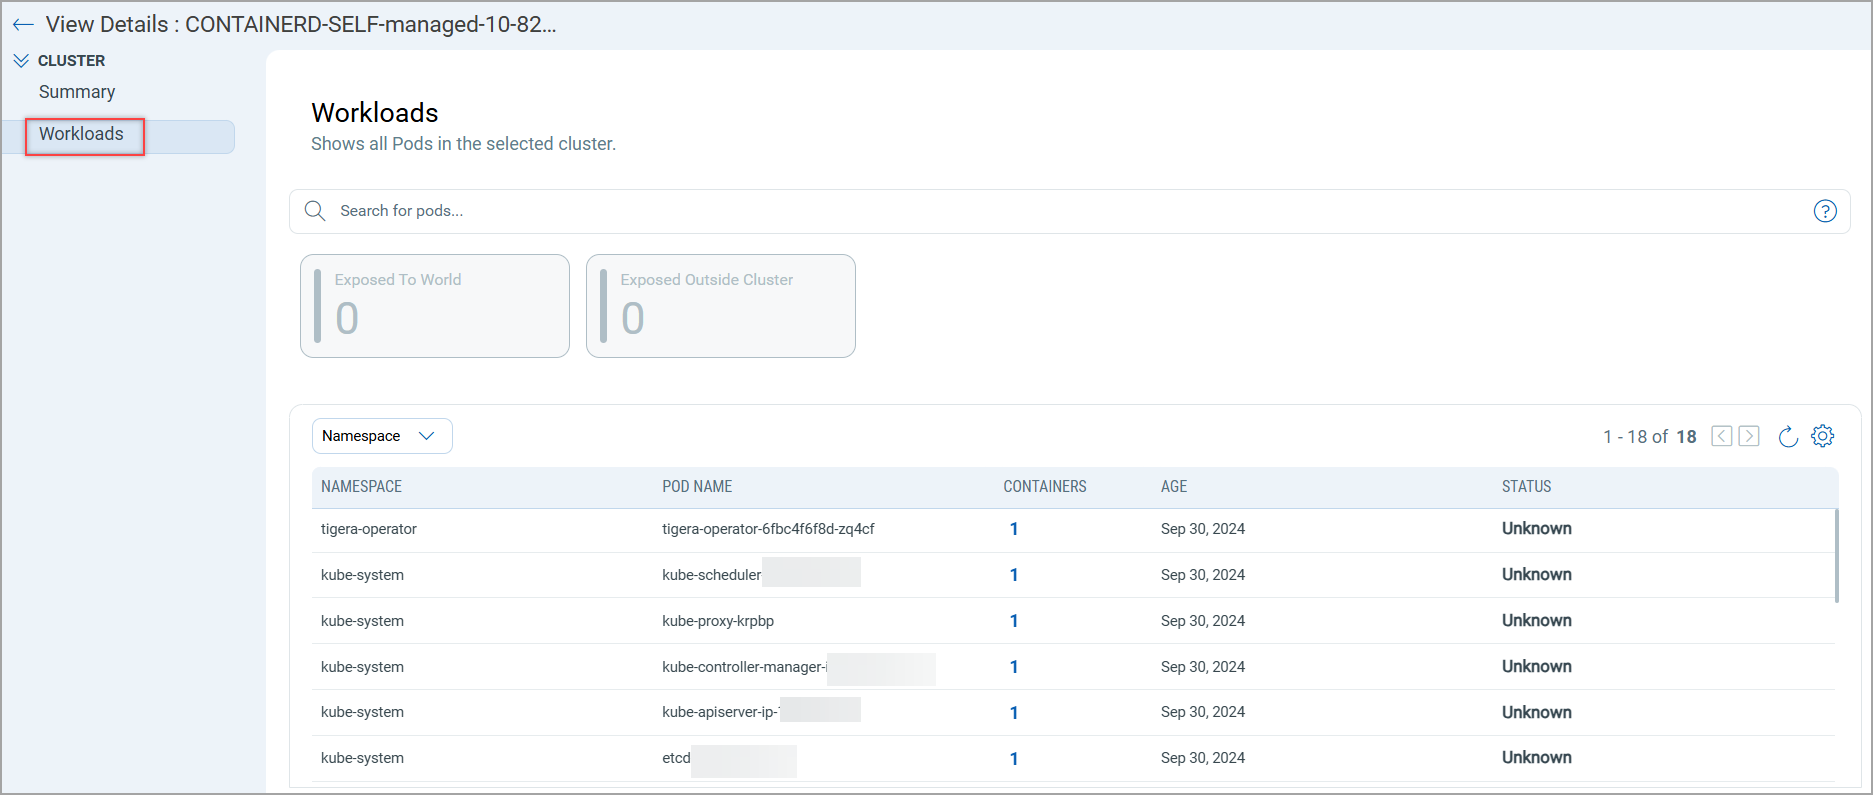
The Workloads page provides POD-level details such as namespace, name of the POD, number of containers in the POD, POD age (POD creation/updation time), and POD status. You can select a specific namespace to view selective PODs.
Whereas, the Admission Controller page gives you detailed information about the Admission Controller.
You will see the Admission Controller tab only if you have installed the Admission Controller in your cluster. To know more about Admission Controller, refer to Admission Controller section.
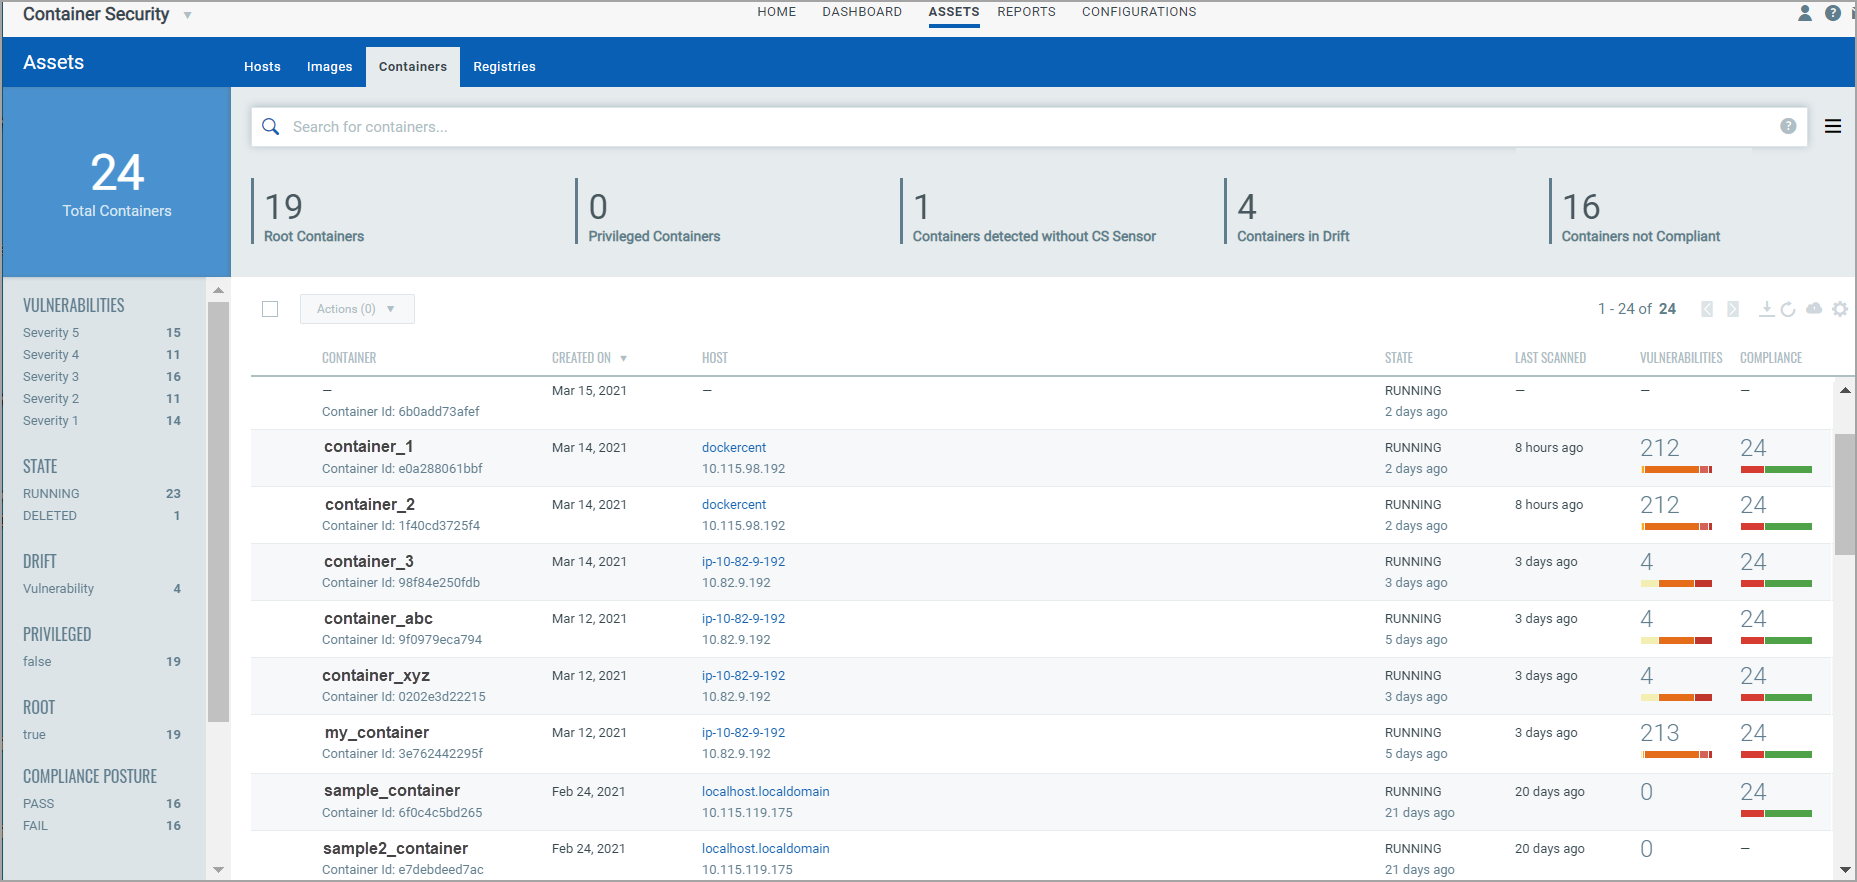
ContainersContainers
The Assets > Containers tab shows the discovered containers and their metadata information.
STATE of a container can be,
- Created - Indicates that the container is created.
- Deleted - Indicates that the container is older than 13 months or it has been deleted from the host.
- Paused - Indicates that the container is paused.
- Running - Indicates that the container is running.
- Stopped - Indicates that the container is stopped.
- Unknown - Indicates that the container is old (less than 13 months) or it does not possess a sensor, and hence it is in a dangling state.
Container 'State' is updated based on the docker events (exec_start, kill, destroy, stop) that Qualys Sensor reports to Qualys Enterprise TruRisk™ Platform.
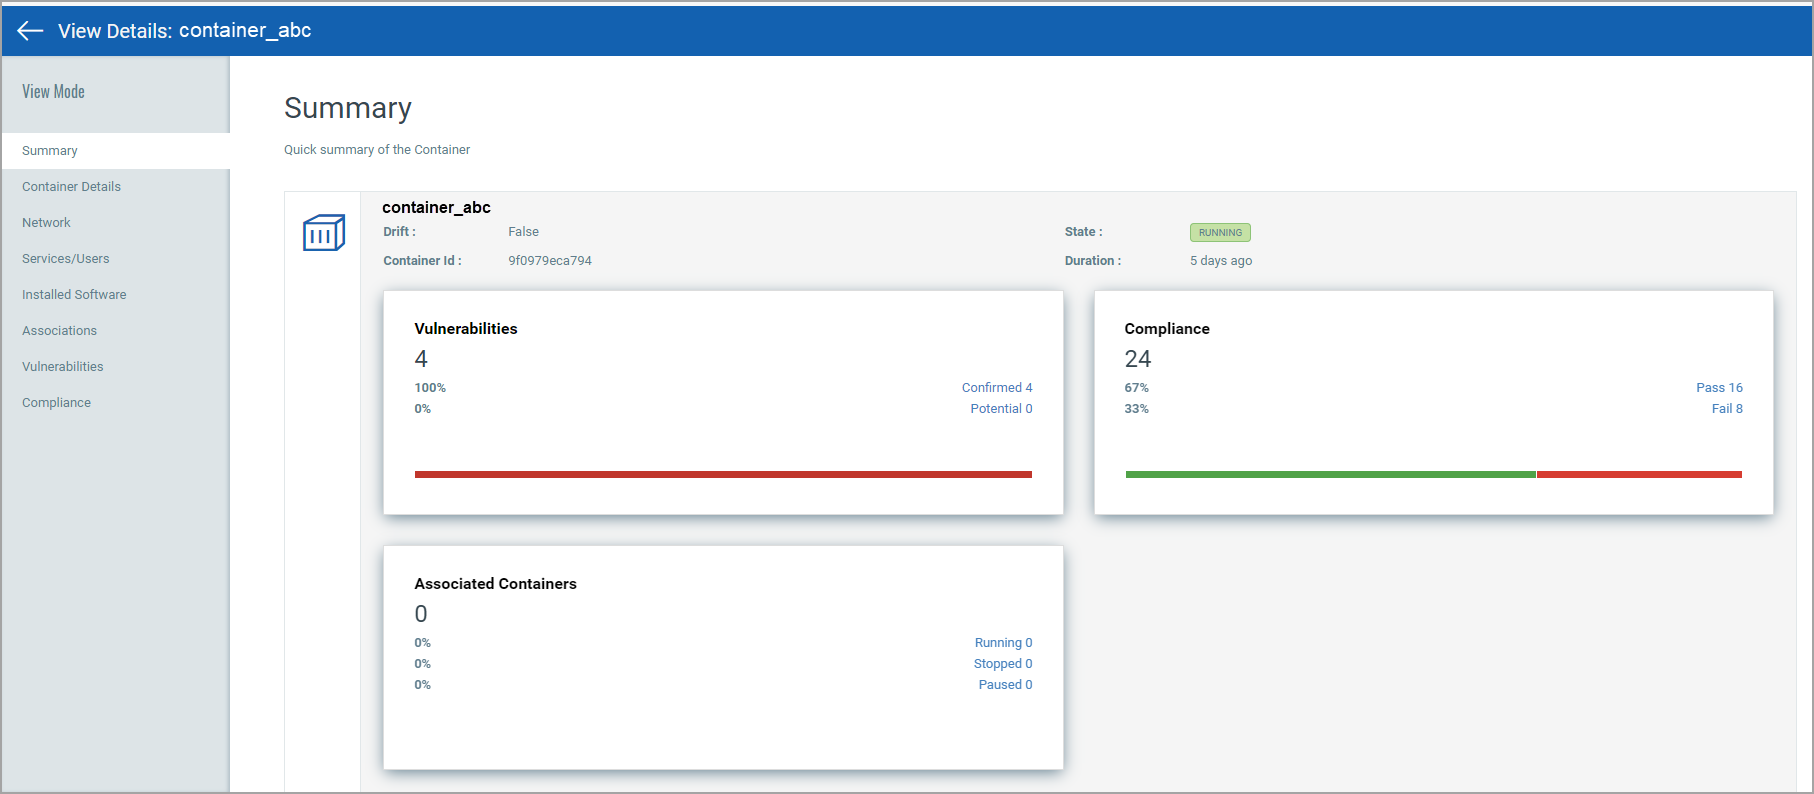
View Container Details
Select View Details from the Quick Actions menu for any container in the list to get comprehensive information about the container. You'll get detailed information about the container, its associations with an image, drift containers, and hosts.
- The Summary section gives you a qiick summary of the selected container.
- You'll see Kubernetes Metadata in Container Details, including Kubernetes attributes, resources, and labels. See Kubernetes Metadata to learn more.
- The Network section displays network information such as IP addresses, Container port, protocol used, host IP, and host port.
- The Services/Users section displays the list of services available in the container and users associated with the container.
- The Installed Software section displays software having vulnerabilities, and for which fixes (patches) are available.
Software packages having Fix Version values as Null or None, or '-' are considered as Unpatchable (no fix version).
- The Associations section provides details of other containers and hosts associated with the container.
- The TruRisk™ Score section provides details of assets that are considered for evaluating the TruRisk™ Score for the container.
- The Vulnerabilities section provides vulnerability information, such as confirmed and potential vulnerabilities with their severity. For each vulnerability, you'll see the vulnerability age (in days). Age is calculated from the point Qualys published the vulnerability.
- Show patchable vulnerabilities toggle bar - Use this toggle bar to see image vulnerabilities that can be patched.
You can use the Show patchable vulnerabilities toggle bar to see the vulnerabilities that can be patched (vulnerabilities for which a patch is available).
- Include exempted vulnerabilities toggle bar - Use this toggle bar to see the list of vulnerabilities that are excluded from the scan.
- Show patchable vulnerabilities toggle bar - Use this toggle bar to see image vulnerabilities that can be patched.
- The Compliance section provides a list of controls that were scanned with control details (CID, criticality, statement, category, technologies). Learn more.
- The Exceptions section shows the vulnerability exceptions assigned to the container. For more information, see Defining Vulnerability Exceptions.
ImagesImages
The Assets > Images tab shows the discovered images along with their metadata information.
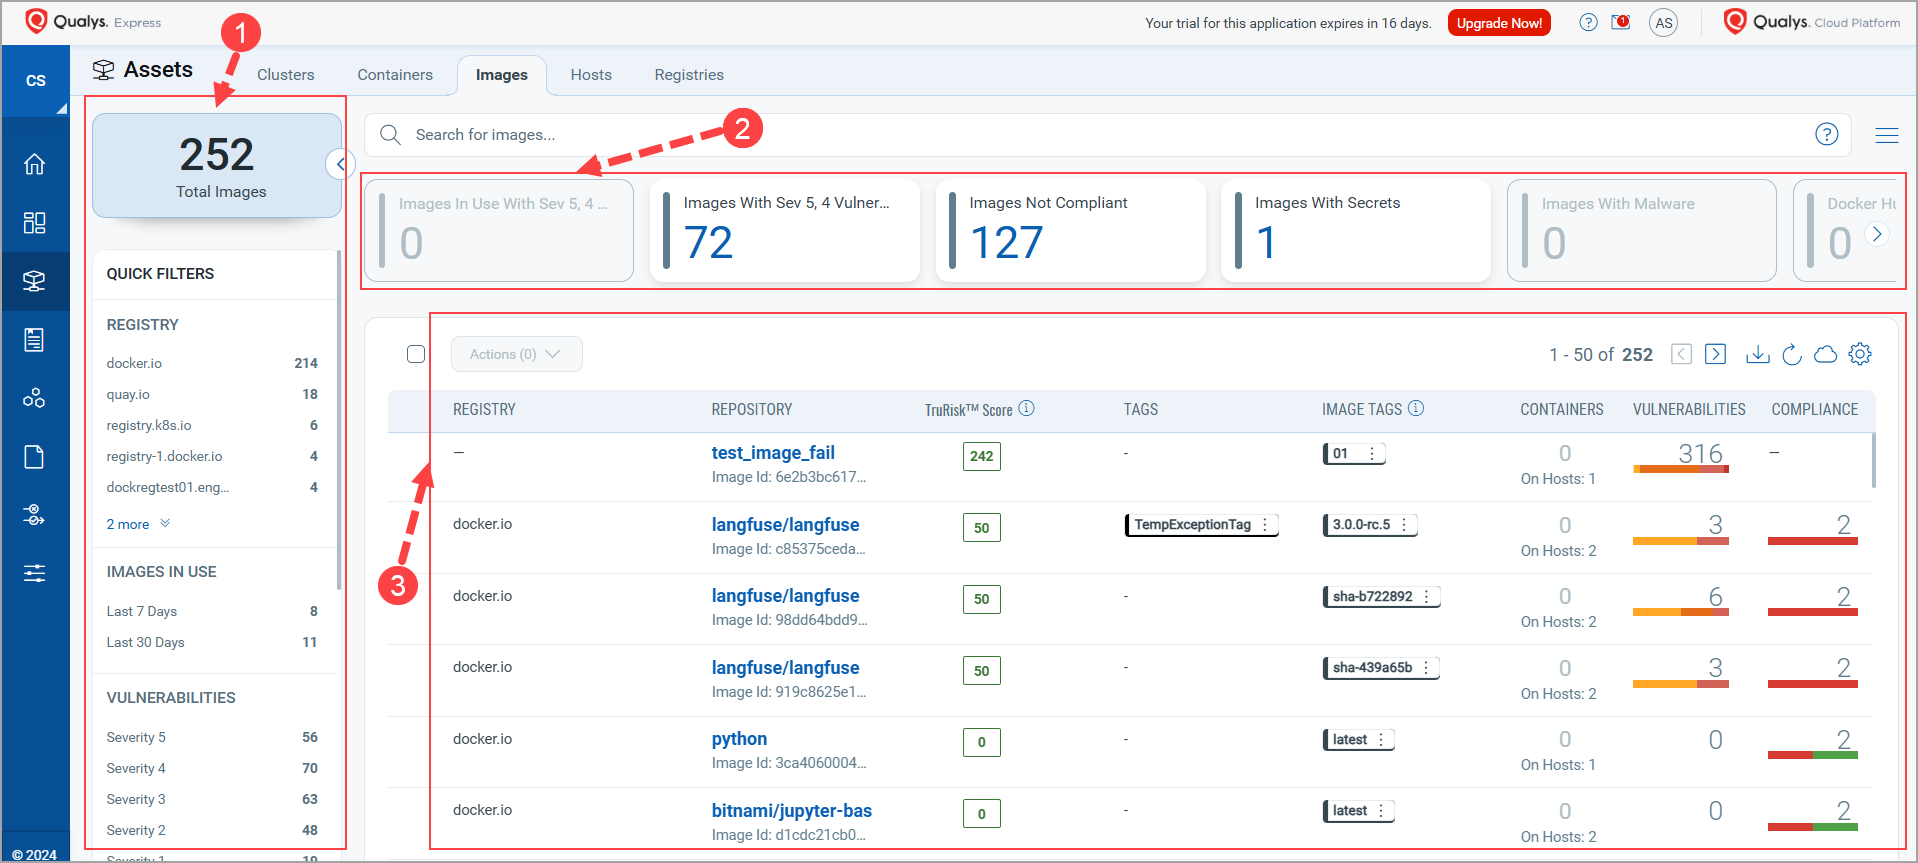
1. Quick Filters
This section consists of the following sections.
- Total Images - This tile shows the total number of images present in your account.
- REGISTRY - Gives you a quick overview of the registries present in your account.
- IMAGES IN USE - Indicates the number of images that are used by a container that is either running, stopped, or deleted in the last 1, 7, and 30 days.
- VULNERABILITIES - Shows the total number of images based on the severity level of their vulnerabilities (Severity 1 to Severity 5).
- QDS SEVERITY - Shows the total number of images present in your account categorized using QDS severity.
- COMPLIANCE POSTURE - Shows total number of compliant and non-compliant images.
2. Tile Section
The section shows you information about the images using the following tiles.
- Images in Use With Sev 5, 4 Vulnerability - Last 1 Day: Indicates the number of images that
- have vulnerabilities of Severity 4 or 5
and - are used by a container that is either running, stopped, or deleted in the past 1 day.
- have vulnerabilities of Severity 4 or 5
- Images With Sev 5, 4 Vulnerability: Indicates the number of images that have Severity 4 or 5 vulnerabilities.
- Images Not Compliant: Indicates the number of non-compliant images.
- Images With Secrets: Indicates the number of images having secrets.
- Images With Malware: Indicates the number of images having malware.
- Docker Hub Official Images: Indicates the number of DockerHub images.
3. List Section
This section lists all images in your environment along with their details.
| Column | Description |
| REGISTRY | Indicates the Registry in which the image is saved. For example, docker.io, azurecr.io, and so on. |
| REPOSITORY | Indicates the Repository associated with the image. |
| TruRisk™ Score | Indicates the TruRisk™ Score of the selected image. To know more, refer to TruRisk Score and QDS in Container Security. |
| TAGS | Indicates user tags associated with your account. These tags are created by your admin. |
| IMAGE TAGS | Shows tags associated with the image. |
| CONTAINERS | Shows a number of containers spawned using that image. |
| VULNERABILITIES | Shows a number of vulnerabilities found in the image. |
| COMPLIANCE | Provides the number of Compliance Controls applied to the image. |
View Image Details
Select View Details from the Quick Actions menu for any image in the list to get comprehensive information about the image. You can view detailed information about the image and its associations with containers, drift containers, and hosts. If you are unable to see image details, refer to
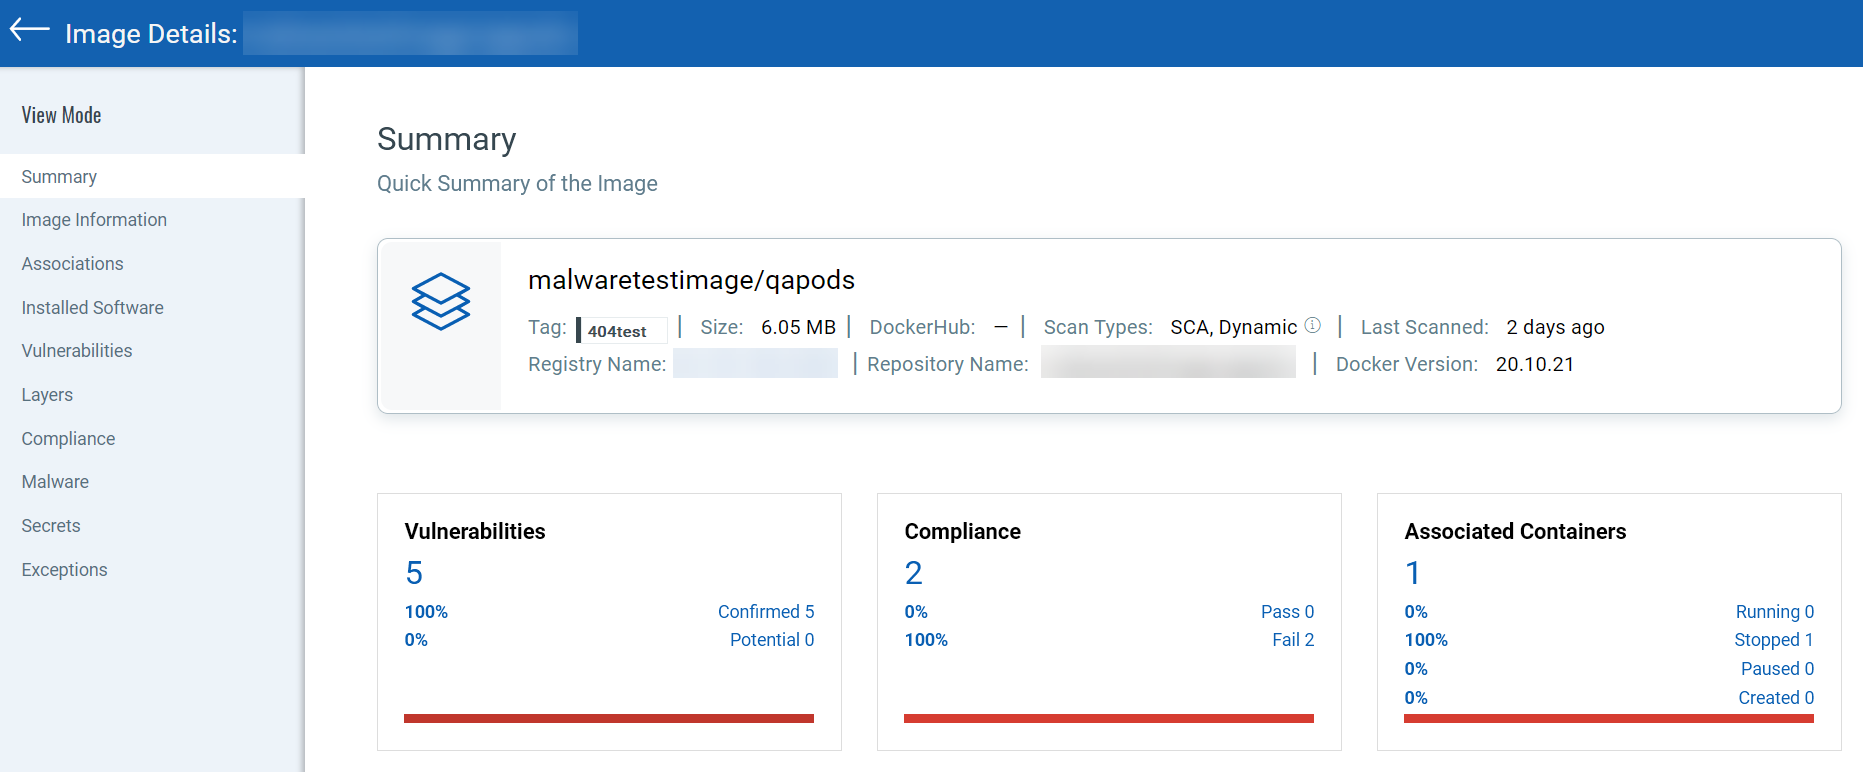
See various sections of an Image Details page below.
- The Summary section provides a quick summary of the image and all other sections present under View Mode. It includes image details such as, tag, size, scan type, last scan and secret details, along with registry and repository details. Along with this, the Summary page displays cards for found vulnerabilities, compliance, and associated containers.
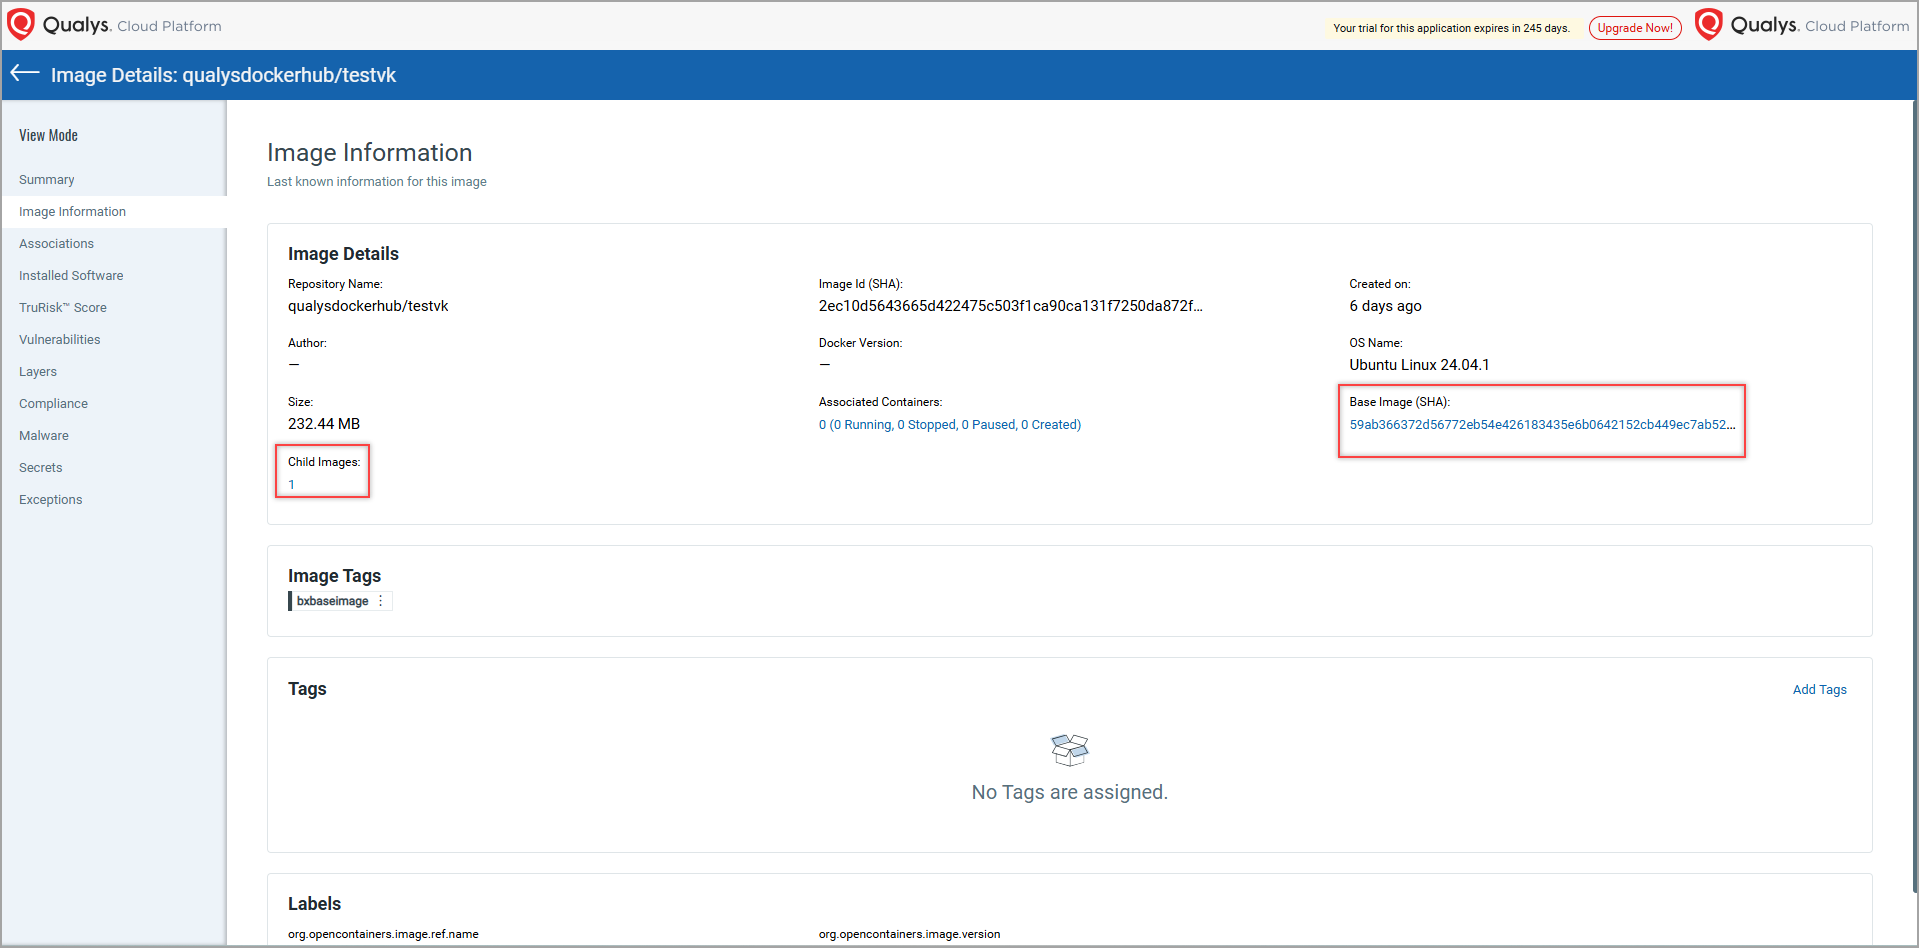
- The Image Information section provides more information about the image such as image size, creation date, image SHA, base and child images, user-scoping tags, and labels.
You can see Base image details only if the base image is scanned before the child images. Hence, ensure to scan the Base image first.
- The Associations section provides details of the container and hosts associated with the image.
- The Installed Software section displays installed software having vulnerabilities, and for which fixes (patches) are available.
Software with Fix Version values as Null or None, or '-' are considered as Unpatchable (no fix version).
- The Vulnerabilities section provides vulnerability information, such as confirmed and potential vulnerabilities with their severity. For each vulnerability, you can see the vulnerability age (in days). Age is calculated from the point Qualys published the vulnerability.
- Show patchable vulnerabilities toggle bar - Use this toggle bar to see image vulnerabilities that can be patched.
You can use the Show patchable vulnerabilities toggle bar to see the vulnerabilities that can be patched (vulnerabilities for which a patch is available).
- Include exempted vulnerabilities toggle bar - Use this toggle bar to see the list of vulnerabilities that are excluded from the scan.
- Show patchable vulnerabilities toggle bar - Use this toggle bar to see image vulnerabilities that can be patched.
- The Layers section displays a list of layers the image is made of.
- The Compliance section provides a list of controls that were scanned with control details (CID, criticality, statement, category, technologies). For more information, see Compliance Scanning in Container Security.
- The Malware section shows the malware detected for the image. For more information, see Malware Scans.
- The Secrets section shows the secrets detected for the image. For more information, see Detecting Container Secrets.
- The Exceptions section shows the vulnerability exceptions associated with the image. For more information, see Defining Vulnerability Exceptions.
Images Not Scanned
The 'Blacklisted images' and images present in 'Image Exclusion List' are not scanned by Qualys Container Sensor and hence are not listed under the Images tab.
Blacklisted Images
The images matching any of the following Regexes are Blacklisted and hence are not scanned by CS Sensor.
- ".*/amazon-ecs-pause:.*"
- ".*/amazon-ecs-agent:.*"
- ".*/pause-amd64:.*"
- ".*/pause:.*"
- ".*/k8:.*"
- ".*bodhi/bodhi-ocr-python.*"
- ".*datadog.*"
- ".*calico/node.*"
- ".*filebeat/filebeat.*"
- ".*rubie-platform/docker-dd-agent.*"
- ".*srecm/cadvisor.*"
- ".*cml-ccp-k8s/cni.*"
- ".*entkubernetes/fluent-bit.*"
- ".*kubesphere/fluent-bit.*"
- ".*jtblin/kube2iam.*"
Image Exclusion List
Qualys Container Sensor also maintains a default list of system images as part of 'Image Exclusion List' in order not to perform vulnerability scans on them and focus on application images. You can configure the image exclusion list using the Sensor Profile tab. To know about configuring the Image Exclusion list, refer to Creating a Sensor Profile. If required, you can also scan images present in the Image Exlusion List. To know about this, refer to Sensor Deployment Help.
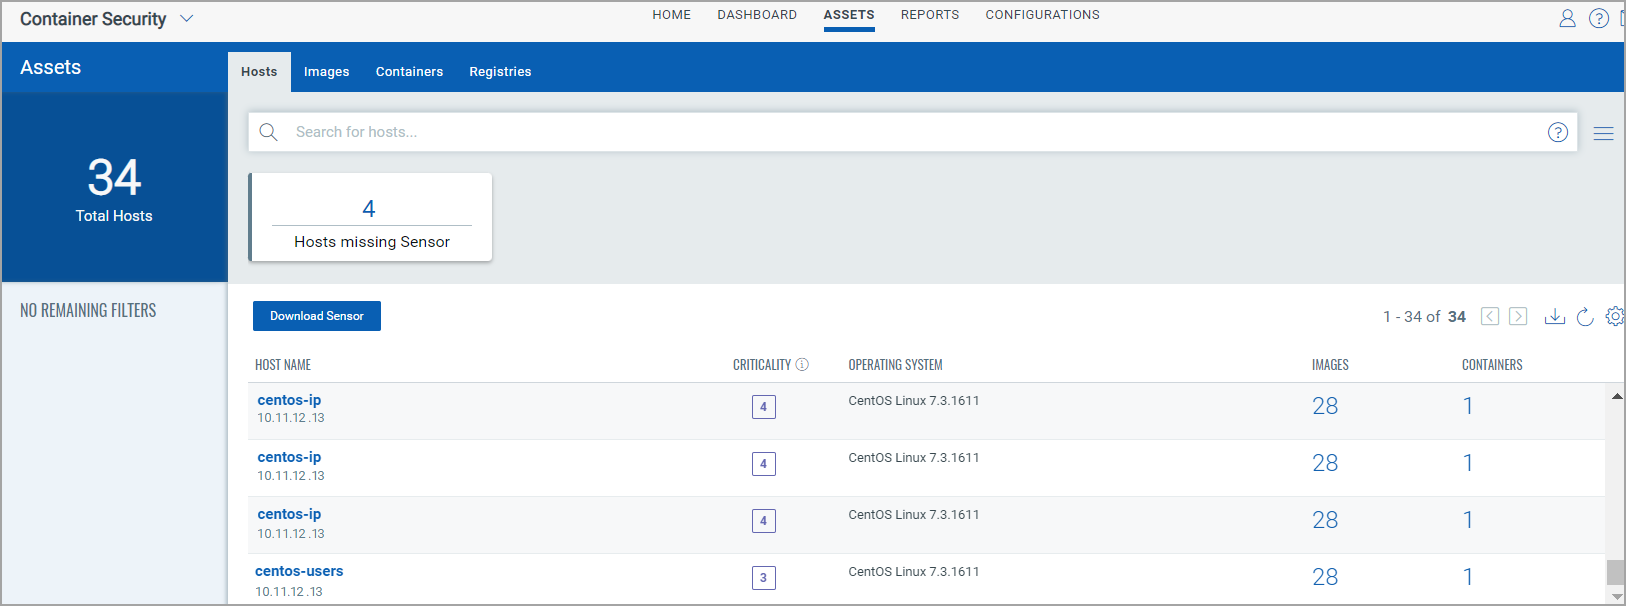
HostsHosts
The Assets > Hosts tab shows container hosts discovered and scanned by the Qualys Cloud Agent and/or Qualys Network Scanner.
Qualys Cloud Agent and Cluster Sensor discovery are not associated with each other.
Currently, container hosts discovered, scanned only by the Qualys Container Sensor are not shown in this list. It is recommended you use the Images or Containers tabs for these. Additionally, Qualys Container sensors currently only support hosts and clusters with Linux-based host OSes and Mac OS.
For each host in the list, you'll see the image and container count. Image and container details can be viewed in their respective tabs.
You'll also see the asset criticality score, which represents the criticality of an asset to your business infrastructure. This score is calculated based on multiple tags assigned to the asset with asset criticality scores defined. Learn more about the asset criticality score.
View Asset Details
Access the Asset Details page for a host from the Sensor details page.
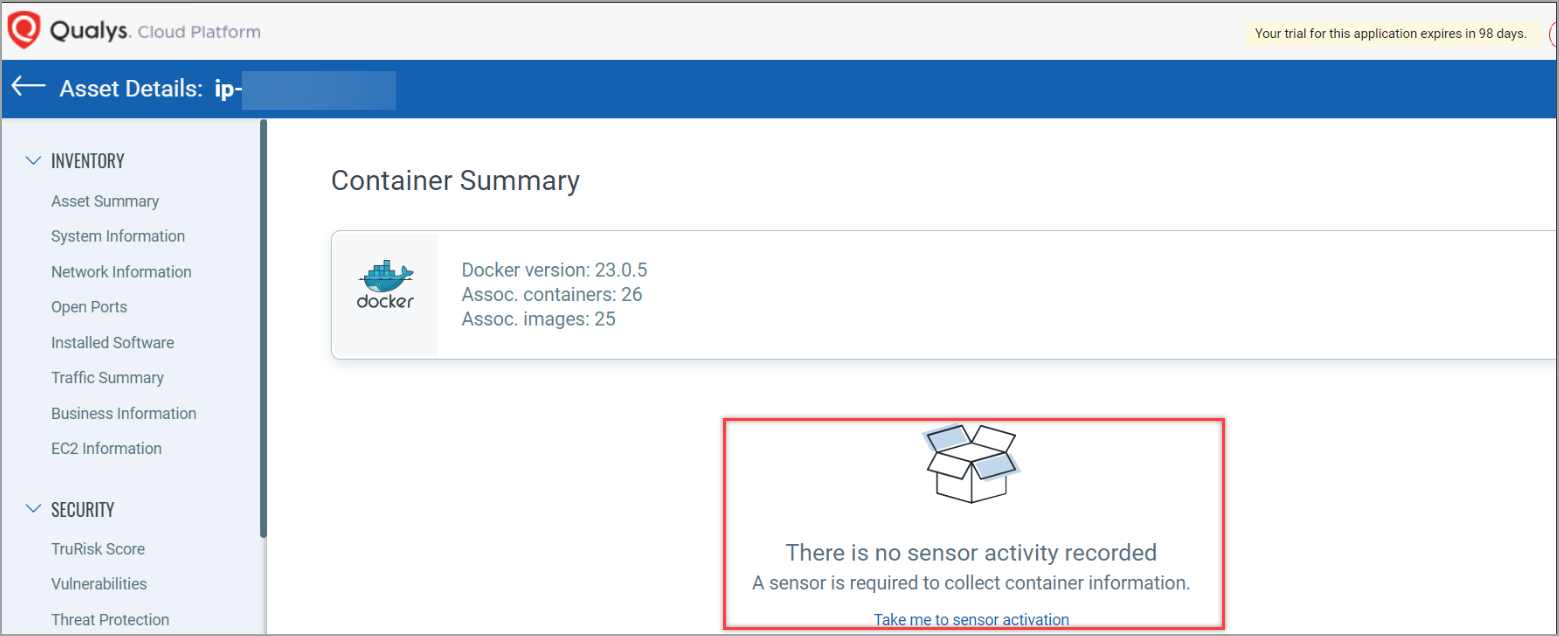
The Asset Details view displays information about the host on which the sensor is deployed. Besides system, network, and port information, the Asset Details view also displays a list of software installed on the host, vulnerabilities present, certificates, and Threat Protection RTIs (when the Qualys TP app is enabled). The Container Security panel shows all containers installed on the host, their status, and the images from which the containers are spawned.
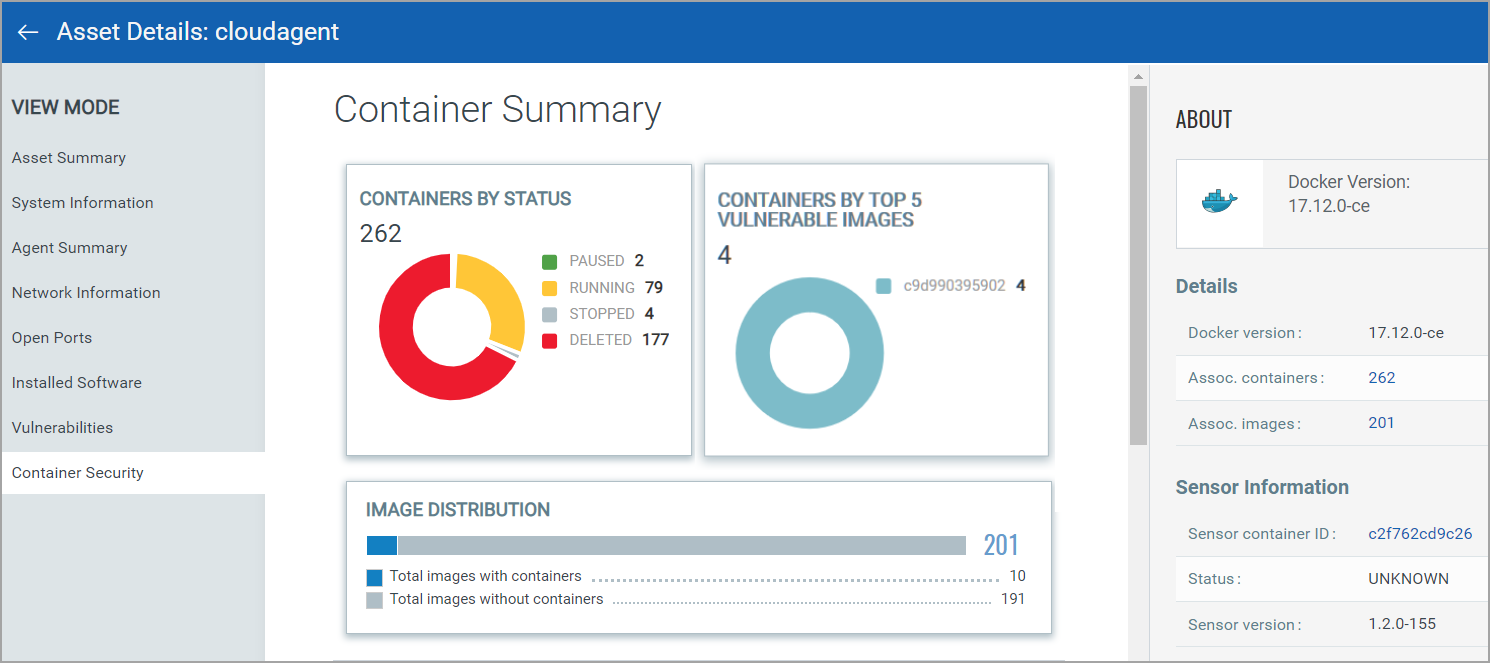
If the sensor is installed without any persistent storage, the Container Summary page may not display any sensor details, and instead, it may show the error "There is no sensor activity recorded".
RegistriesRegistries
The Assets > Registries tab shows the registries in your account. See Adding a new registry to scan to learn how to add and scan registries.
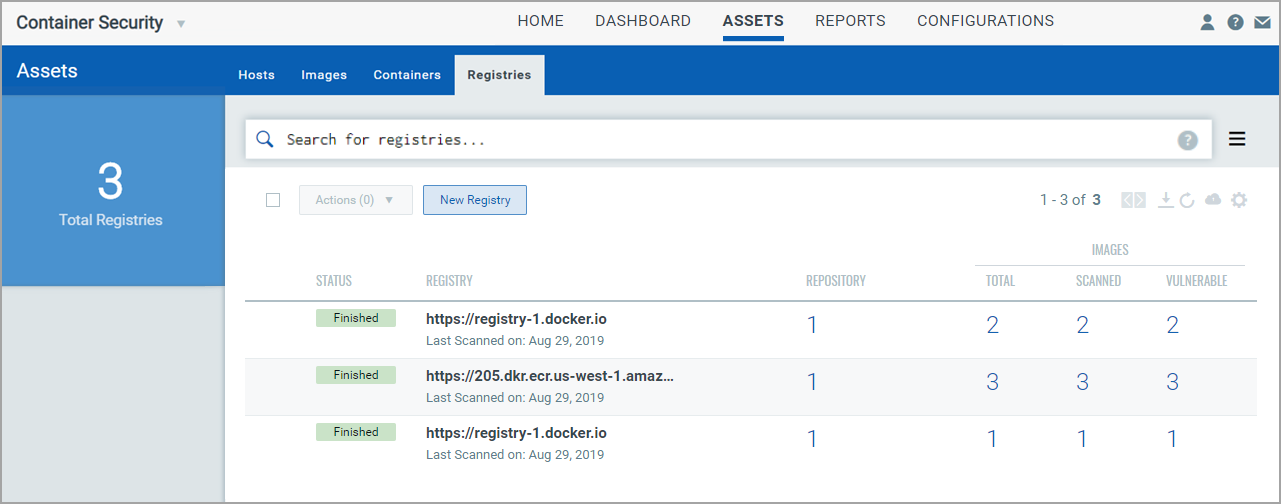
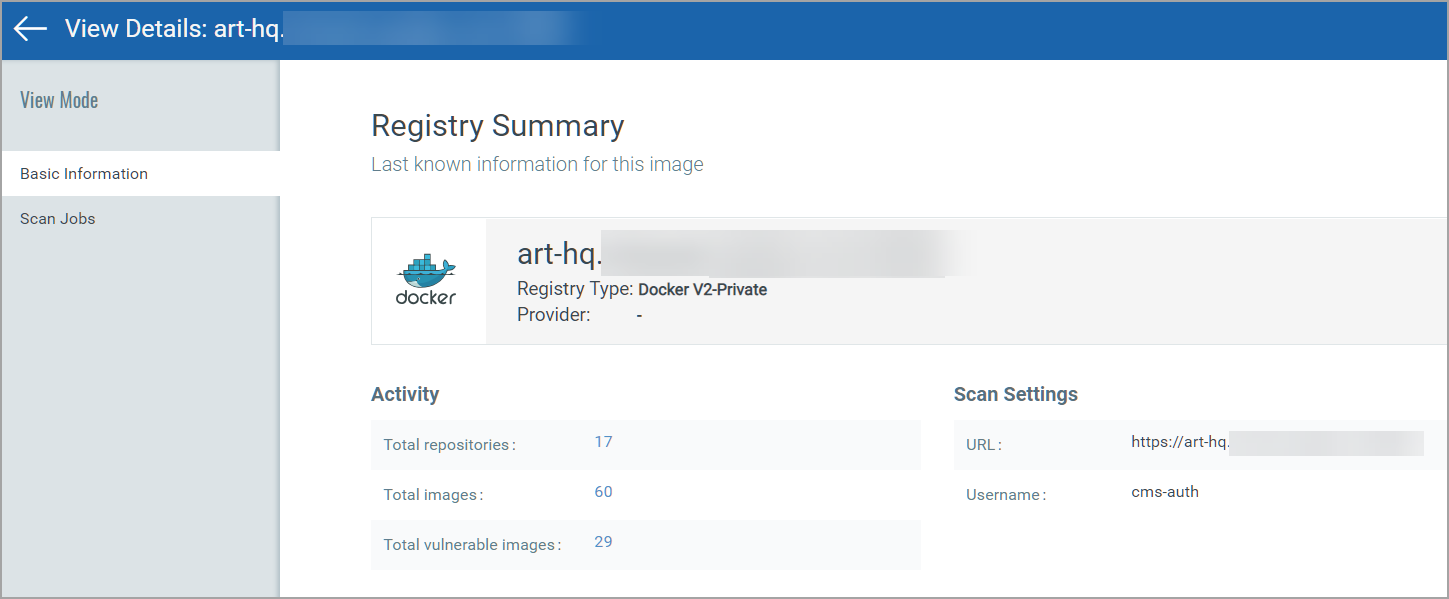
View Registry Details
Select View Details from the Quick Actions menu for any registry in the list to get comprehensive information about the registry. You can view detailed information about the registry: number of repositories, total number of images and number of vulnerable images within that registry. The Scan Jobs panel lists the On-demand and Automatic Jobs created for that registry. For more information, see Vulnerability scanning of Registries.