Risk Overview
The Risk Overview page gives you a consolidated view of risk across your customer base. It shows the total number of customers you manage, a risk scope graph of findings across those customers, and a table listing risk details for each account.
The risk scope graph organizes every finding across your customer base into a series of nested scopes. Scopes are based on severity and exploitability. The graph is shaped like a funnel. The widest point represents the broadest view of findings. Each level below it narrows the view to a smaller, more severe, and more exploitable set of threats. Use the graph to move quickly from a high-level view of your portfolio's risk to the specific findings that need immediate attention.
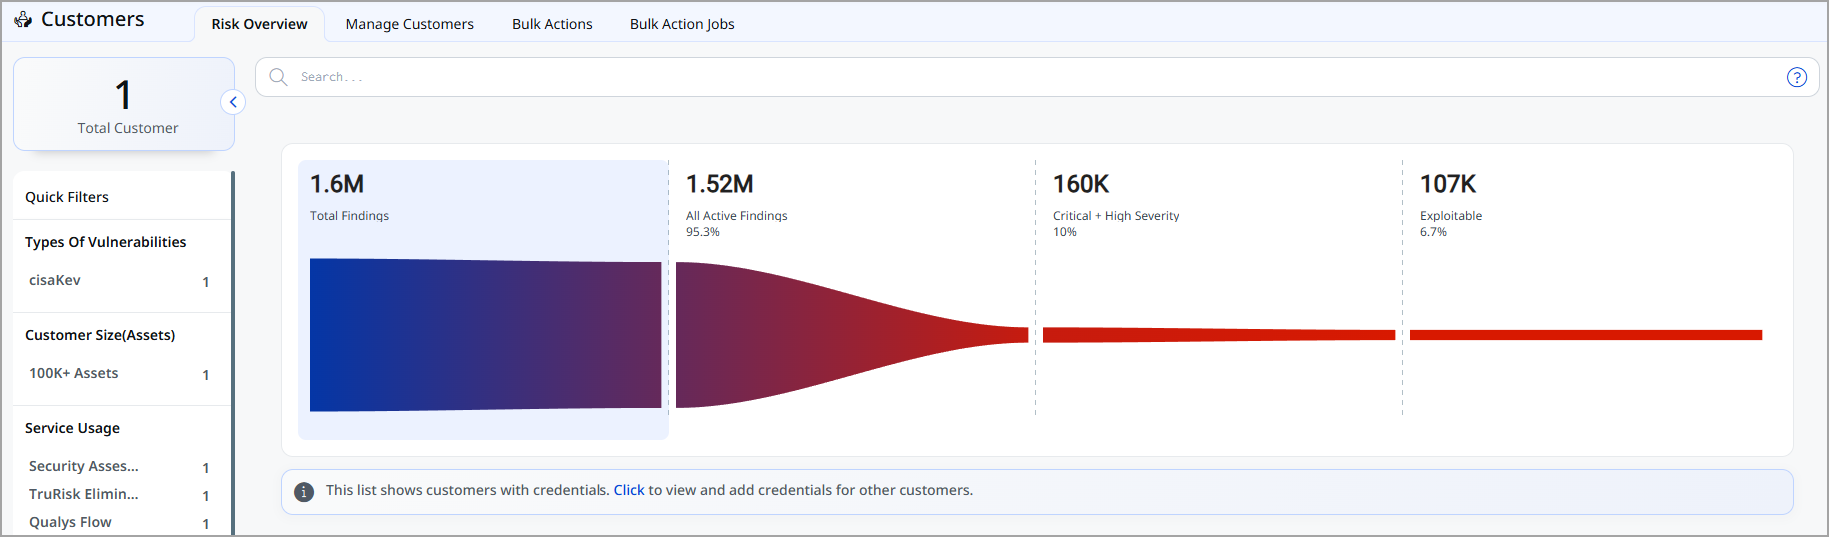
- Scope 0:Displays the broadest view of findings across your customer base, with no severity or exploitability filtering applied. Scope 0 is the only scope that combines data from both the ETM and Vulnerability Management (VM) applications. From Scope 1 onward, the graph shows ETM data only; select View More to see the corresponding VM data for that scope.
- Higher Scopes: Displays a progressively narrower finding set with each scope above Scope 0, based on increasing severity and exploitability. The highest scope shown represents the smallest, most critical set of threats.
- Select a Scope: Displays the customer list, the TruRisk score, and the account quick actions filtered to the scope you click on the graph.
The risk scope you select on the graph carries over to the account quick actions and to the top contributing factors. You don't need to reapply your filter as you move between views.

- Account Name: Displays the customer’s registered Account Name. Use the quick action drop-down next to the account name to review the account's risk details without leaving the Risk Overview page. The risk scope selected in the risk scope graph carries over to each quick action, so your filters stay applied as you move between views.
- Request Report: Generates a TruRisk score report for the account. The report summarizes the account's attack surface. It highlights the risks that need attention first, giving you a prioritized starting point for remediation. To learn more about this option, refer to the Generate Risk Overview Report.
- View Assets: Opens the account's asset inventory, filtered to the currently selected risk scope.
- View Critical Vulnerabilities: Opens the list of critical vulnerabilities identified for the account, filtered to the currently selected risk scope.
- View Misconfigurations: Opens the list of misconfigurations identified in the account's environment, filtered to the currently selected risk scope.
- TruRisk Score: Displays the customer’s TruRisk Score. Hover over the TruRisk Score to view the Top Contributing Factors driving the account's score.
Top Contributing Factor: Displays the individual risk factors that contribute most to the account's current TruRisk score. Select a contributing factor to open the respective applications. The relevant filter is already applied, so you can investigate the underlying risk without searching for it manually. Top Contributing Factors respects the risk scope selected in the risk scope graph. The factors shown reflect only the findings within that scope.
- Assets: Displays the total number of assets linked to the customer.
- Critical Vulns: Displays the count of critical vulnerabilities that require immediate remediation.
- Misconfigurations: Displays the number of misconfigurations within the customer’s environment that may introduce security risk.
- Eliminations: Displays data for your managed accounts. This value combines remediation counts with eliminations tracked through the Qualys Eliminate product.
- SSO link: Displays the Single Sign-On (SSO) link on the Risk Overview and Portfolio Overview pages, which redirects you based on the applications you have onboarded, prioritizing ETM for its comprehensive risk view.
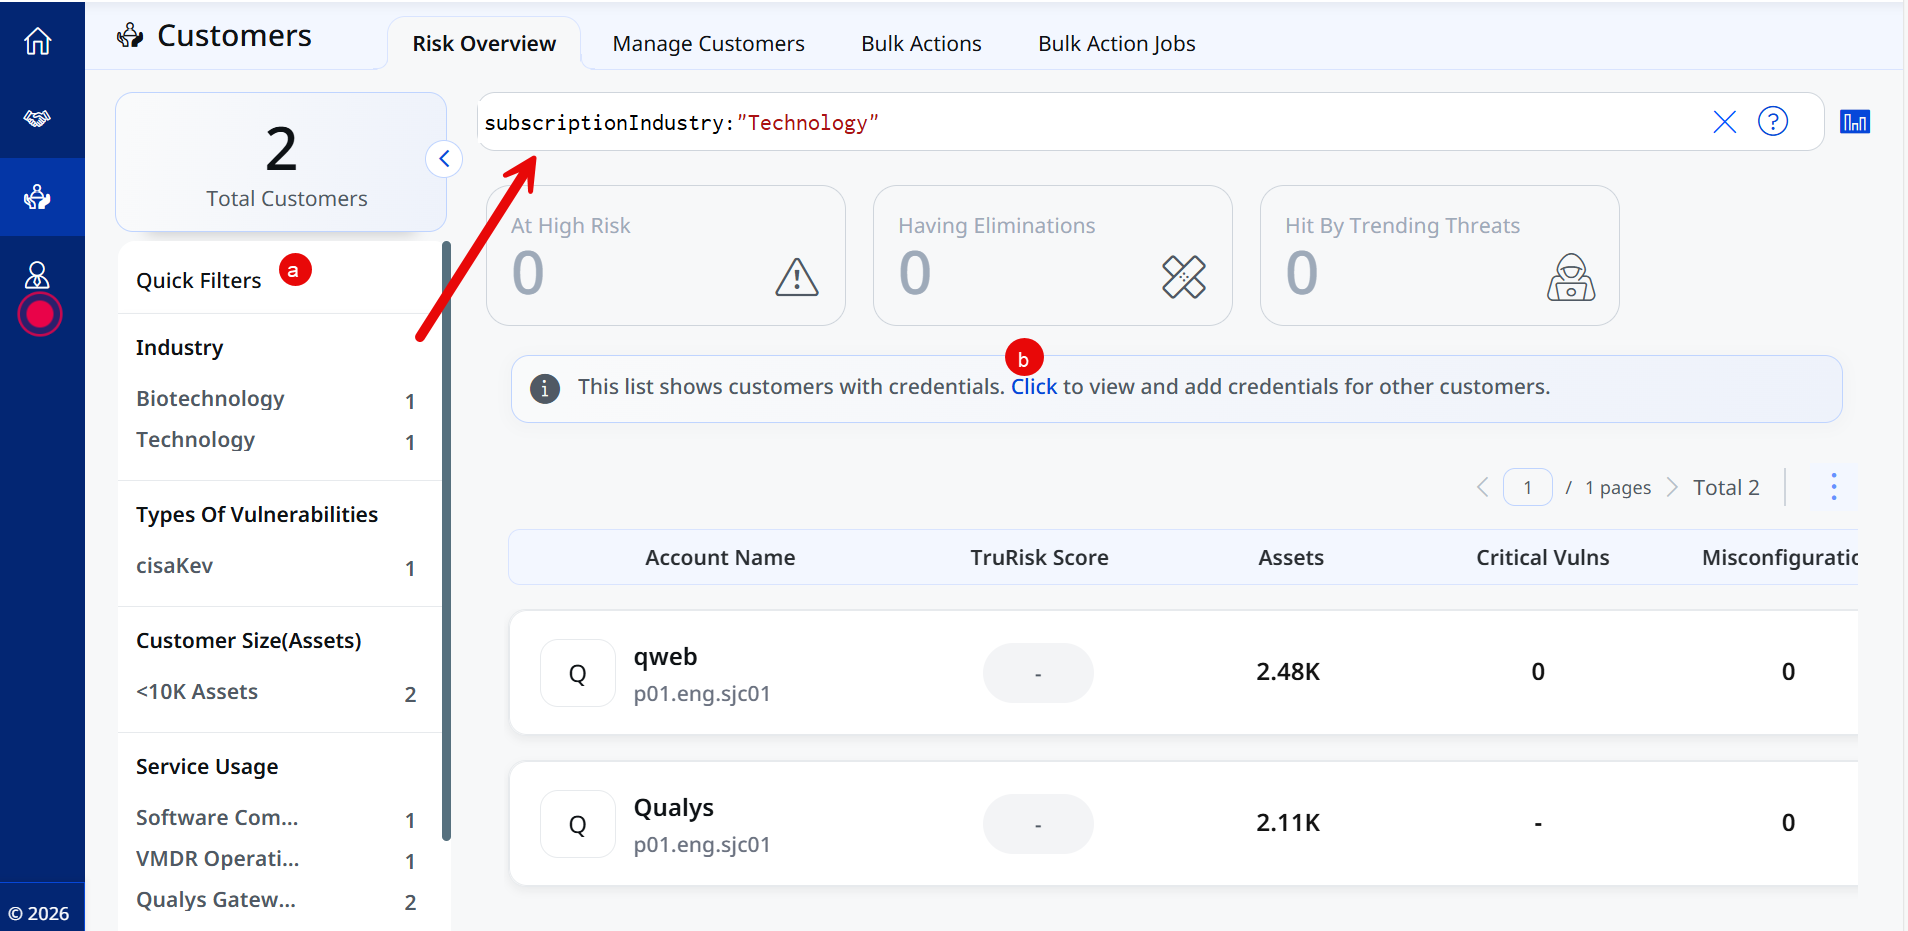
- Quick Filters: The Risk Overview page includes a quick filter panel on the left. Use it to simplify searches using Qualys Query Language (QQL). When you select filters such as industry or asset count greater than 10,000, the system automatically updates the query in the search bar (for example, industry: healthcare and asset count greater than 10000). This helps you understand how to format queries when entering them manually.
- Add Credentials: Redirects to the Manage Customers page, where you can onboard a new customer.