Viewing Dashboard
Each Qualys product offers its own dashboard, which you can customize and create widgets. Dashboards provide actionable insights into your workflows and executions.
We have provided a default dashboard designed to enhance your user experience. This predefined dashboard allows you to quickly start viewing your workflows and executions. As you become more familiar with the platform, you can create your own custom dashboards suitable for your requirements. You can also add as many dashboards as you like to customize your application view.
We have integrated the Unified Dashboard in QFlow to seamlessly view and manage data through a single, unified dashboard by adding multiple widget types in one place. It eliminates the need for separate views for product widgets and matrices.
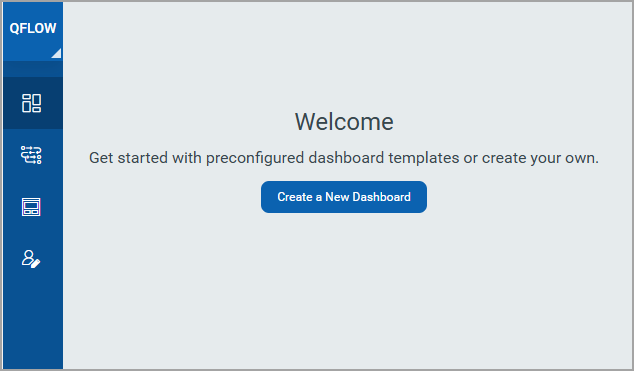
This feature allows you to create your own dashboard. First-time users can view this option when they navigate to the dashboard. You can use the default dashboard or customize it according to your preferences.
Prerequisites
- Enterprise TruRisk™ Platform 3.22 or later
The availability of the default dashboard depends on the Enterprise TruRisk™ Platform 3.22 but you can create your own widgets and customize your dashboard. For information on creating widgets, dashboards, templates, and more, refer to the Unified Dashboard.
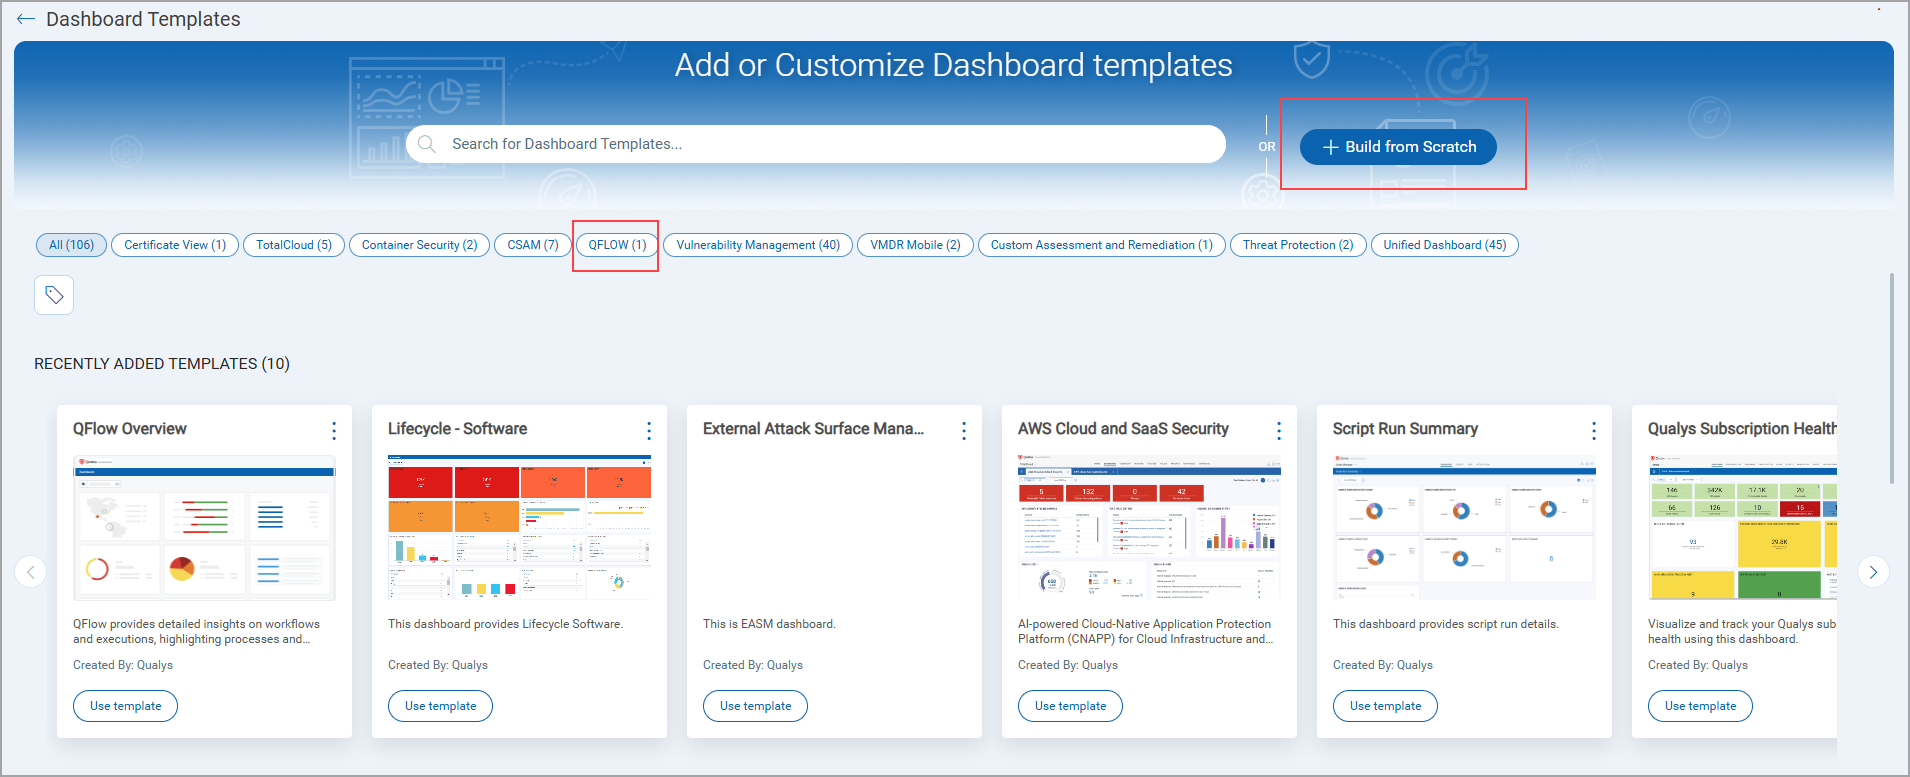
If you are already using the default dashboard, you can view the option to create a dashboard from the dashboard tab by clicking the + icon. You are navigated to the Dashboard Templates page. You can use the QFlow Template or create from Scratch by adding different widgets.
Widget Types Supported
All four standard widget formats are supported:
- Numerical (Count)
- Table
- Pie Chart
- Bar Chart
Example Use Cases
Here are a few practical examples of widgets that can be added:
- Total number of workflows
- Workflow count grouped by:
- Cloud provider
- Region
- Status
- Categories
- Inactive or Undeployed workflows
- Total number of executions
- Execution data visualized by
- Region
- Source
- Status
- Execution type
To know more about how to create dashboard using template, refer to the Unified Dashboard Online Help.
The following is the image shows a default dashboard.
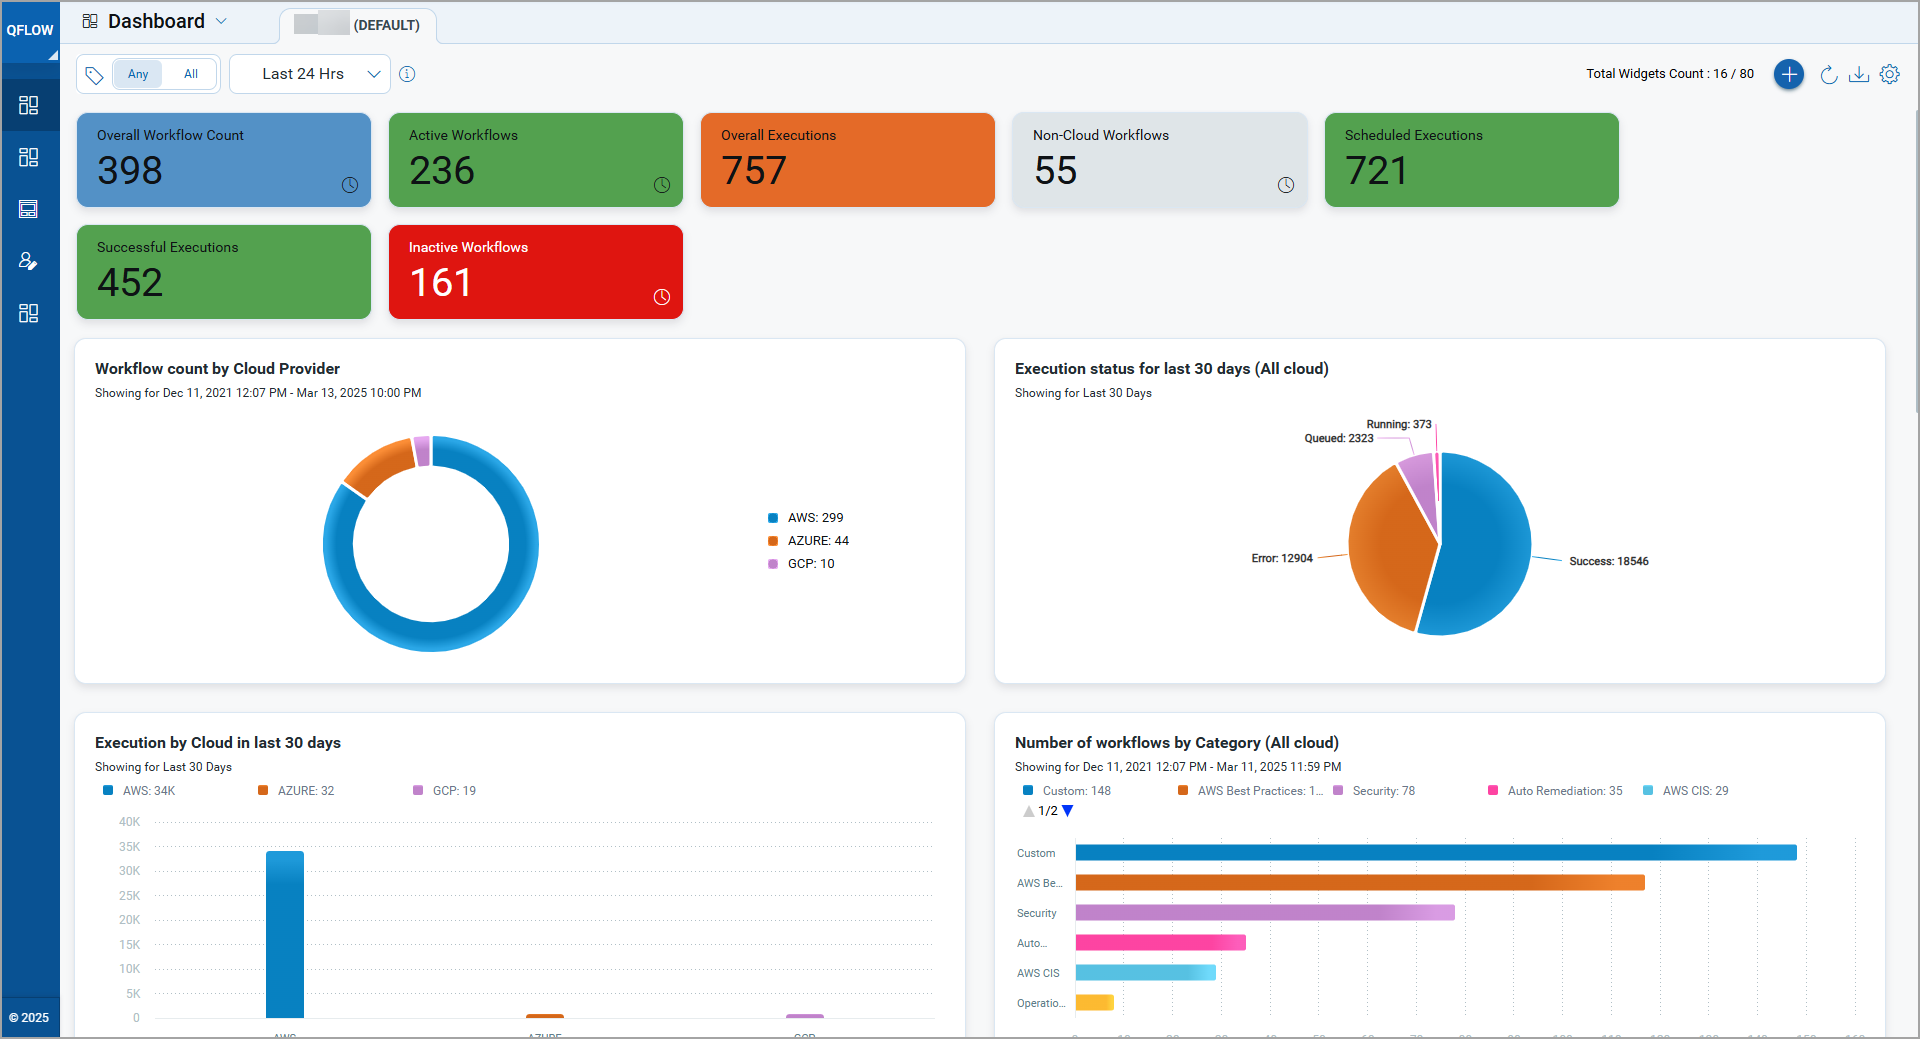
You can make your QFlow Dashboard as the default dashboard by selecting Set as Default from the Quick Actions menu. For information on creating widgets, dashboards, templates, and more, refer to the Unified Dashboard.