Asset Details
You can view the asset details shown in the CyberSecurity Asset Management (CSAM) inventory, where you get visibility to the detailed and consolidated view of an asset with information on asset inventory, security posture, compliance posture, and sensor information to all interfaces for the assets. This detailed information includes IT and security data. This helps the user to understand the security risks, policy and compliance violations, IT data such as licenses, end-of-life dates, and network connections. Users can flag issues or any such problems.
To view asset details, navigate to Inventory > Assets and click View Details under the Quick Actions menu for an asset.
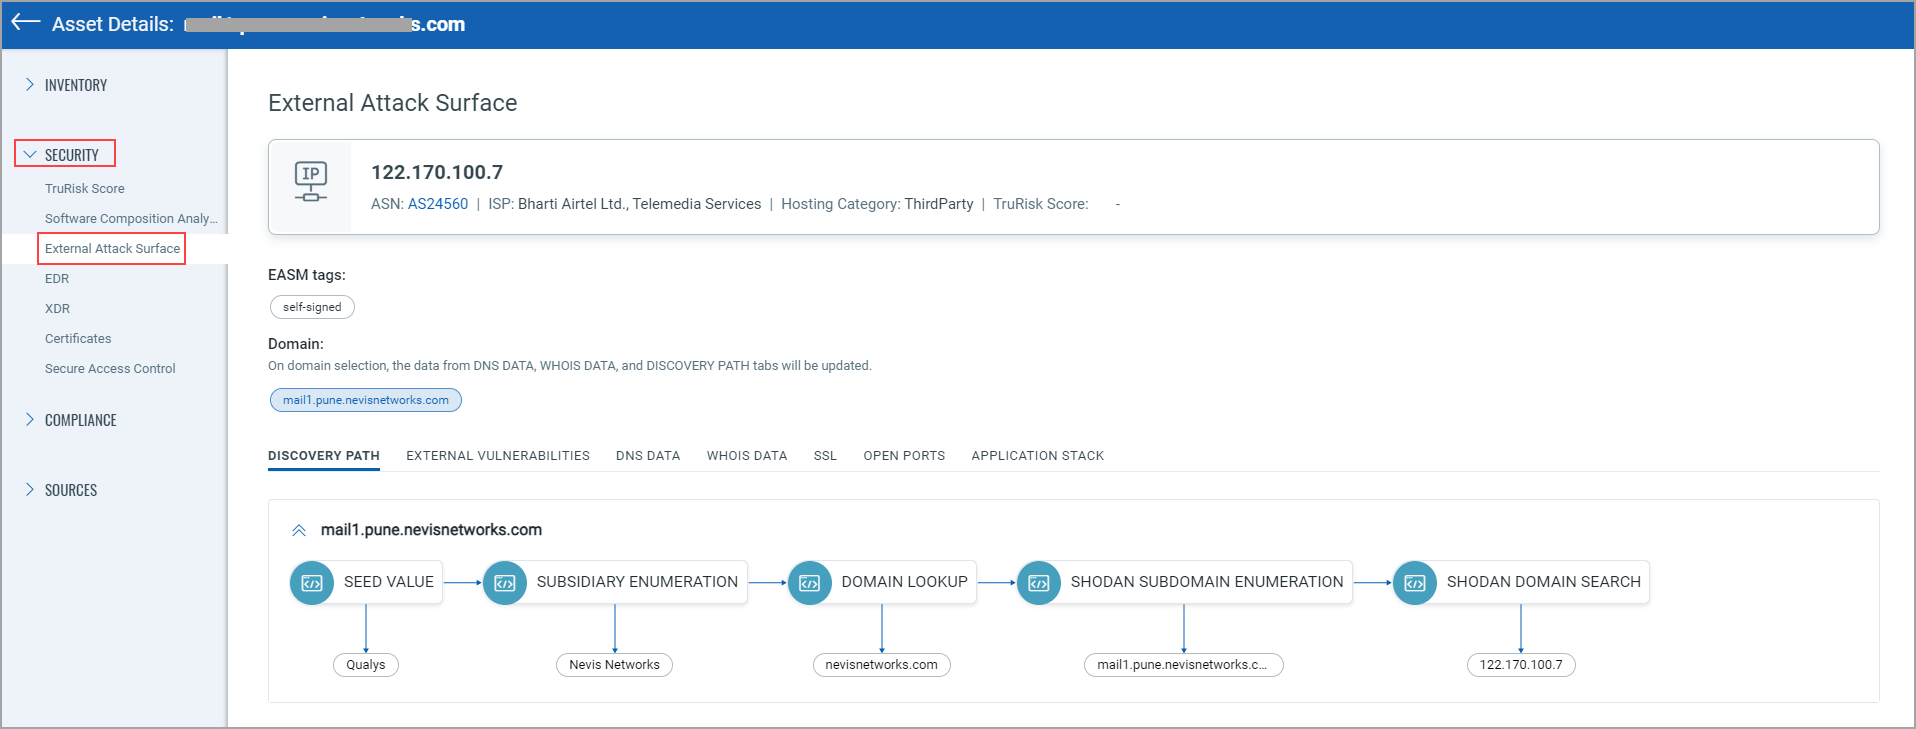
In the case of the EASM asset, you are navigated to the External Attack Surface tab from the Security section.
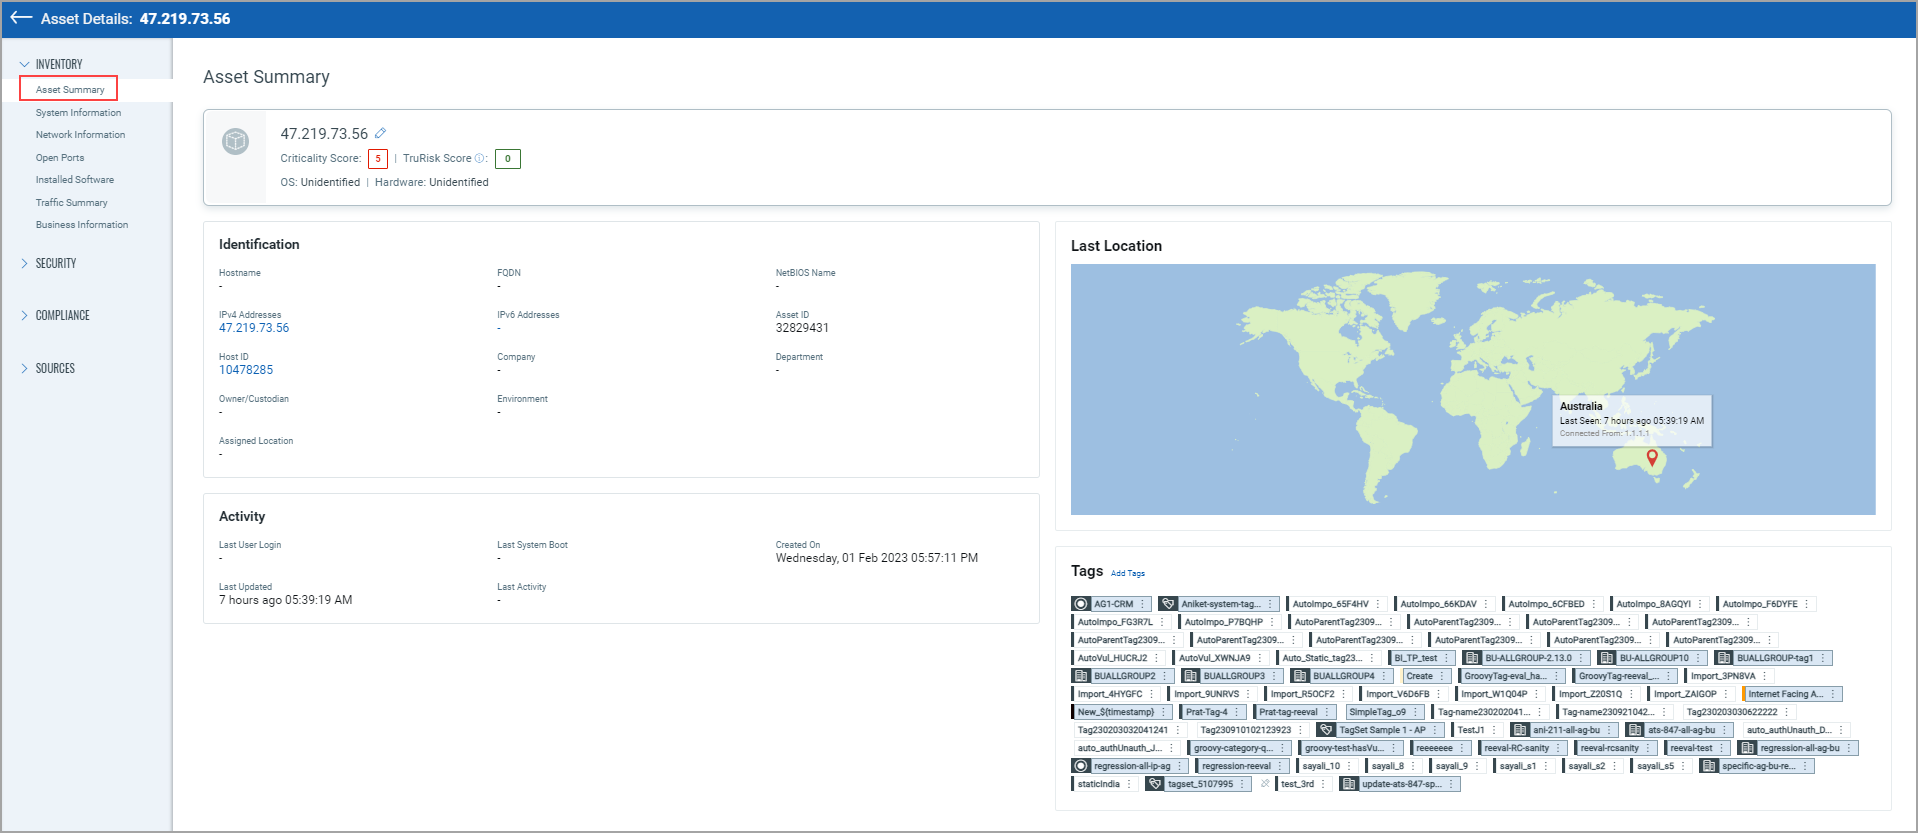
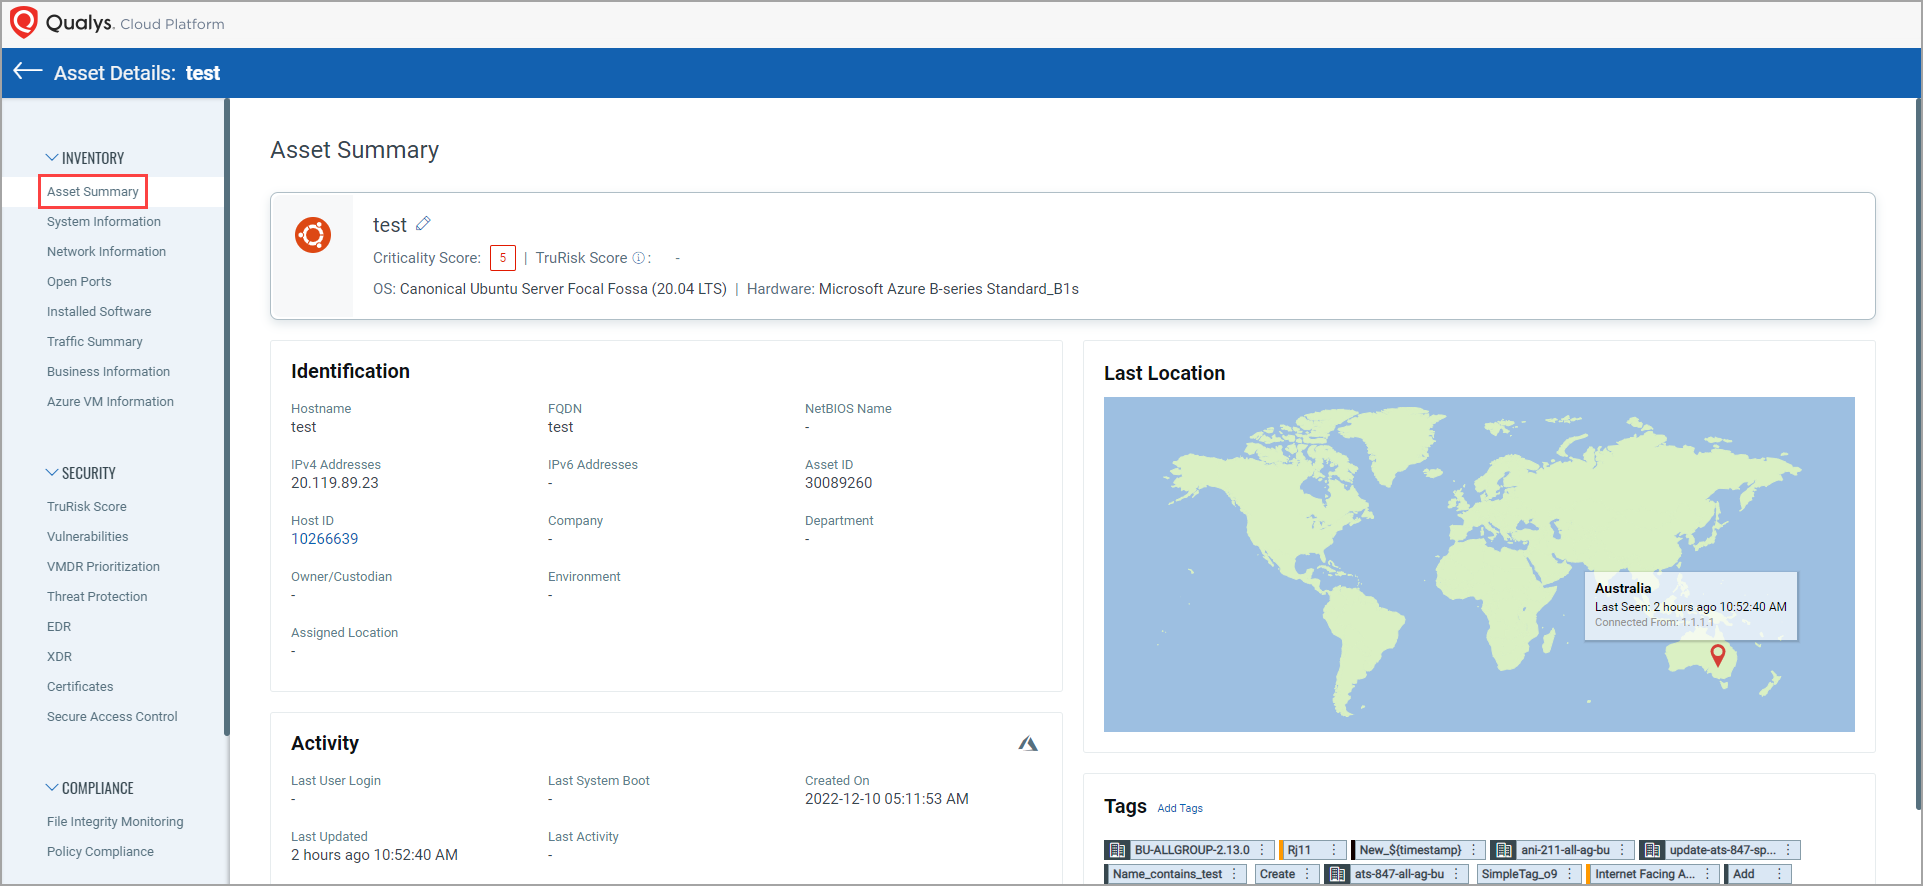
In the case of the CSAM asset, you are navigated to the Asset Summary tab from the Inventory section.
You can expand the Inventory, Security, Compliance, and Sources sections from the left pane and see various tabs under each section. To know more about the details you can see from these tabs, refer to the following topics:
Inventory Section Details
Asset Inventory gives you visibility into the assets, granting you a detailed, multidimensional view of each one that encompasses its IT data. The following tabs are available under the Inventory section.
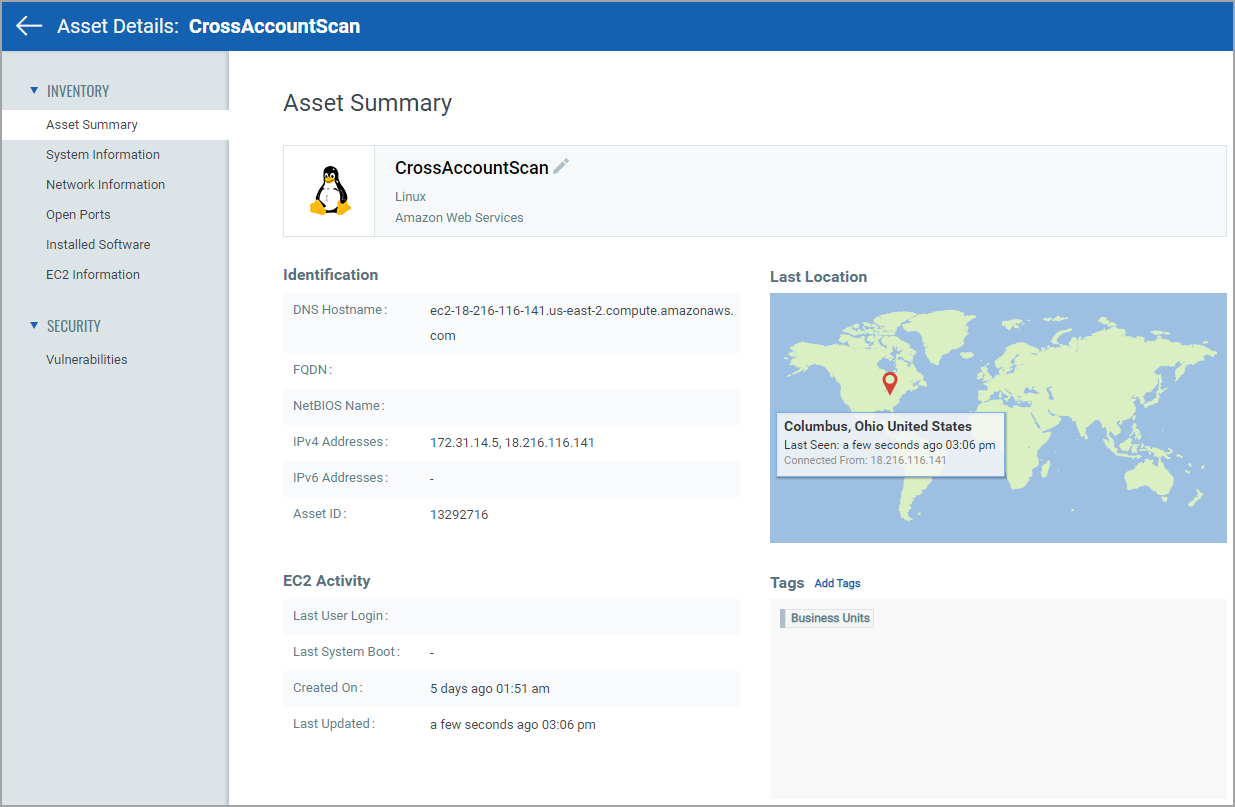
You can find the following details from the Asset Summary tab:
- Asset Criticality Score, EC2 Activity, Asset TruRisk Score.
- Identification details, such as Hostname, IPv4 and IPv6 Addresses, FQDN, and NetBIOS Name.
- Activity details, such as Last User Login, Last Activity, Last System Boot, and Last Updated.
You can also add a tag to the asset from this page.
- From the tags section, you can add static and dynamic tags to that asset by clicking Add Tags. Also, you can remove the static tag assigned to that asset by clicking Remove Tag. You cannot remove dynamic and system-defined tags assigned to that asset. The Remove Tag option is shown only for static tags.
- You can also edit and view static and dynamic tags from the Tags section.
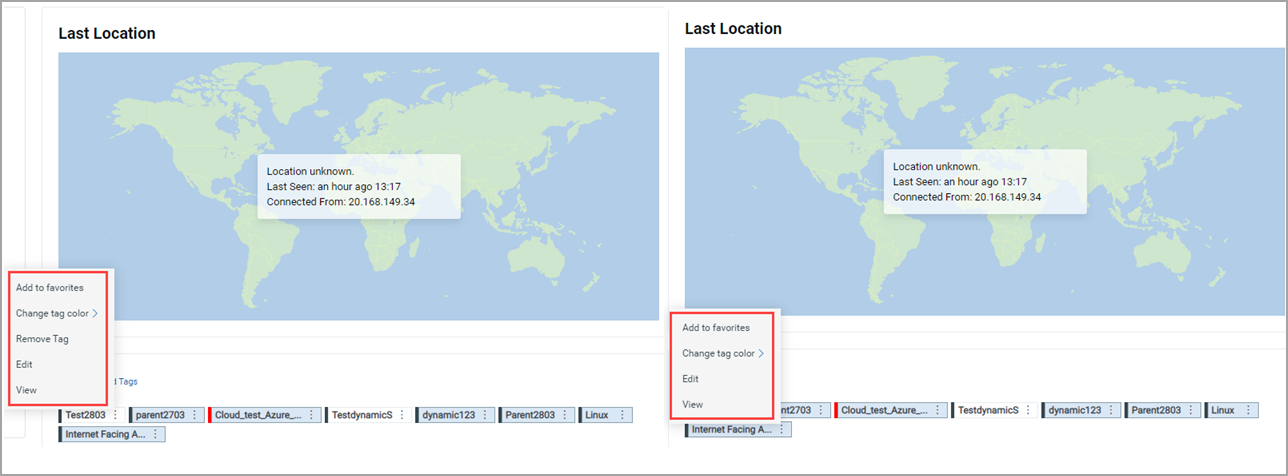
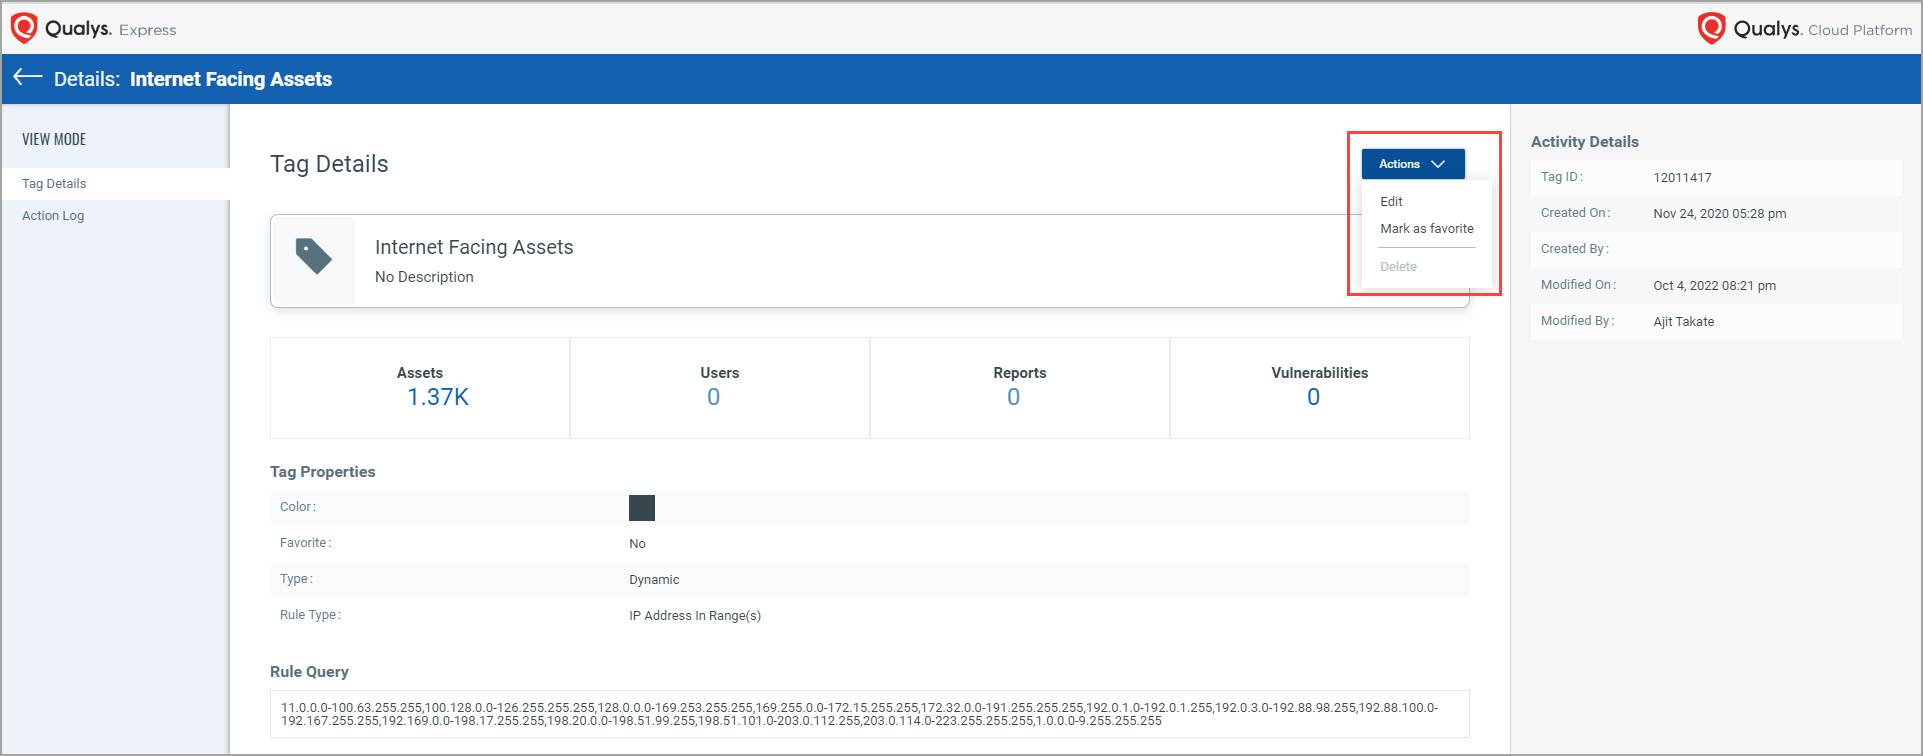
When you click View to see the tag details, a new "Tag Details" page opens, wherein you can see the tag details.
Note: When you click ctrl +View, the “Tag Details” page opens in the next tab.
You can also edit or mark the tag as a favorite by clicking Actions from the "Details" page.
For Alibaba cloud instances, you can see Cloud Agent and ALIBABA icons in the Agent Activity section from the Asset Summary tab.
![]()
Find where your assets are located!
We’re now tracking the geolocation of your assets using public IPs. Asset Geolocation is enabled by default for US based customers. For an asset that has an associated public IP, you’ll see its last location on a world map in Asset Details > Asset Summary.
- We’ll check the asset’s network interfaces for a public IP
- Asset that has an agent installed - we’ll check the IP reported by the agent
- AWS/EC2 asset - we’ll use the EC2 instance public IP
- Asset associated with a network - we will look for a public IP associated with the scanner used
If no public IP is found, we’ll show the location as unknown.
Want to enable (or disable) Asset Geolocation? Sure no problem. Just contact Qualys Support or your Qualys Account Manager, and we’ll help you out.
This asset was last seen in Columbus, Ohio at 3:06 pm.
System InformationSystem Information
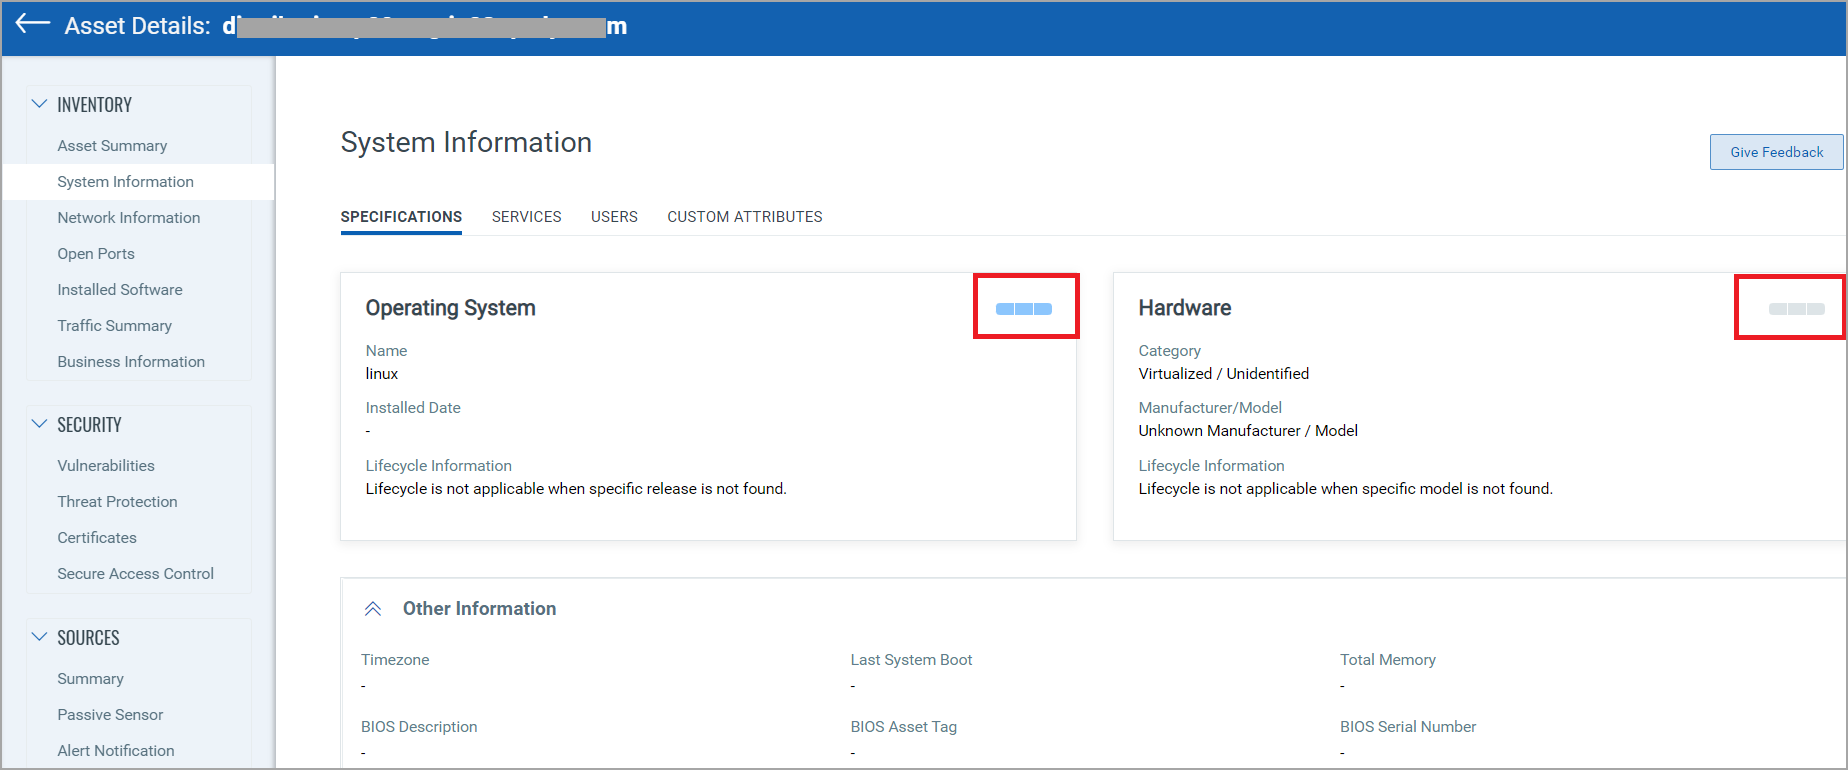
You can see the following details from the System Information tab:
The system information such as hardware specifications (detailed information for operating system, hardware, volumes, processors, etc.), services, and users. For all assets, except the ICS_OCA tagged assets, you can submit your feedback by clicking ‘Give Feedback’. For more information about ICS_OCA tag, see Manage Asset Tags.
There is confidence associated with Hardware, and OS reported for unmanaged assets sensed by PS as the PS fingerprints the asset based on the metadata it sees from the traffic copy fed to the NPS appliance and does not actively query the asset. The operating system confidence and hardware confidence details are shown on the “System Information” page of the asset details in the "Operating System" and "Hardware" tiles.
The software lifecycle status “Estimated” is displayed when a software does not have an officially published End of Support (EOS) or End of Life (EOL) date from its vendor on the Operating System section. In such cases, Qualys derives an approximate lifecycle timeline based on available release information and industry patterns.
“Estimated” is used when:
- The vendor has not published any EOS/EOL dates for the software (for example, Microsoft, Adobe, Oracle, etc.).
- The software is open-source or community-maintained, where support timelines are flexible or undefined.
- The vendor has announced only the General Availability (GA) or release date, without providing a formal lifecycle policy.
Hardware Lifecycle Status
Qualys maps hardware device lifecycle stages based on vendor-published lifecycle data. This helps you understand where a device stands in its support journey.
| Lifecycle Status | Description |
|---|---|
| GA – General Availability | The device is actively sold and fully supported by the vendor. No lifecycle concerns. |
| EOS – End of Sale / End of Order | The device is no longer available for new purchase, but vendor support may still be active. Indicates the start of replacement planning. |
| OBS – Obsolete / End of Support | The device has reached the end of vendor support. No updates or technical assistance are provided, and continued use may pose security or operational risks. |
If a hardware asset shows EOS, it has passed its end-of-sale date but is still within its support period. Once the vendor’s support end date is reached, Qualys automatically updates the lifecycle status to OBS.
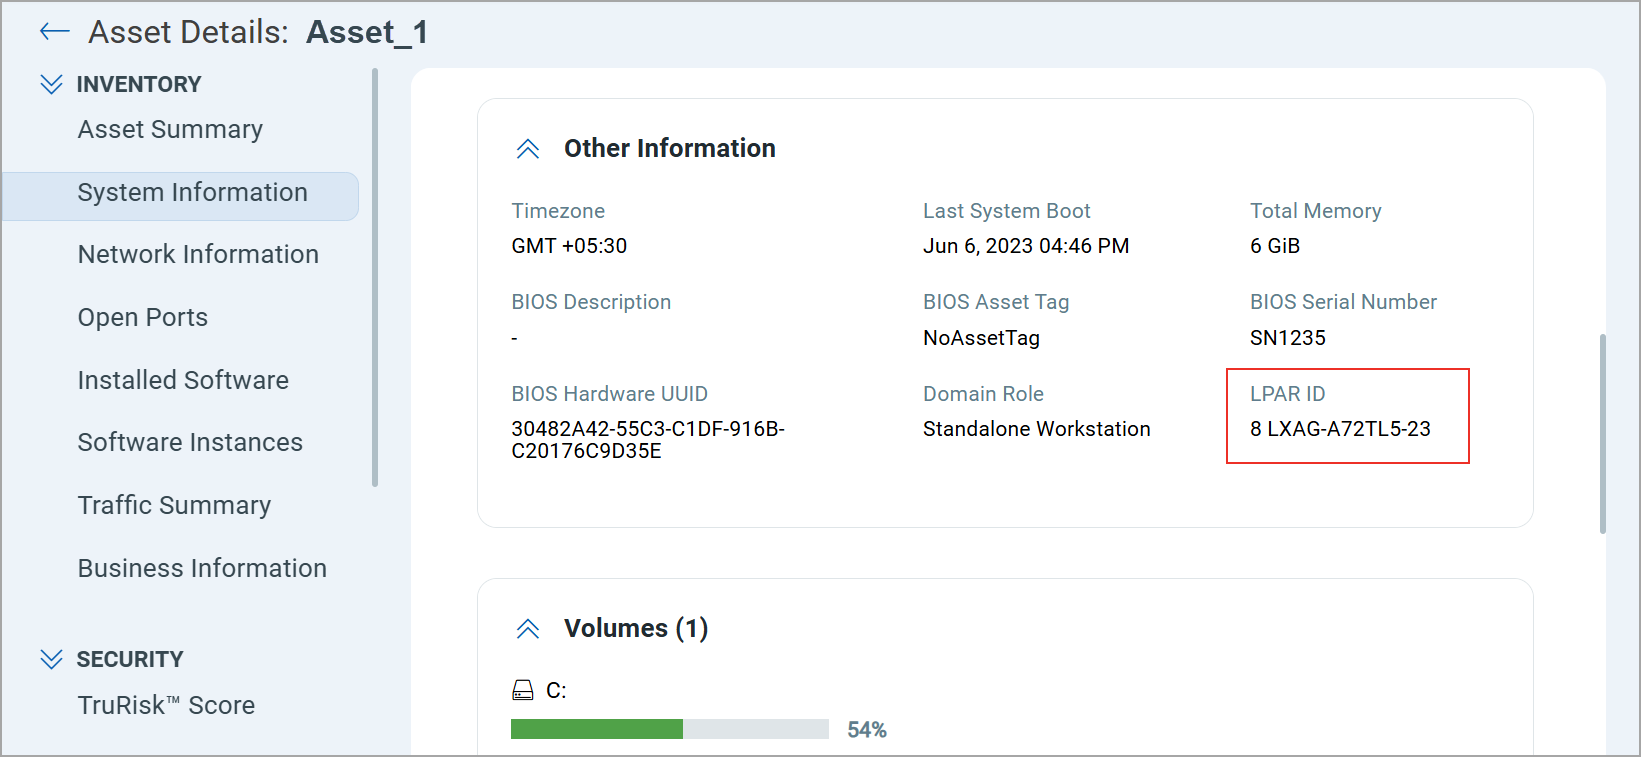
LPAR ID for AIX Assets
You can also view the LPAR ID to accurately identify the AIX assets in your inventory. The LPAR ID is displayed on the Asset Inventory > Asset Details > System Information > Specification page.
Users with a Trial or a Paid subscription can now add “Custom Attributes” for an asset. The custom attributes you add for assets enable you to filter your assets.
Note: As this feature is available only for users with a Trial or Paid subscription, the following message is shown for users with a free account.
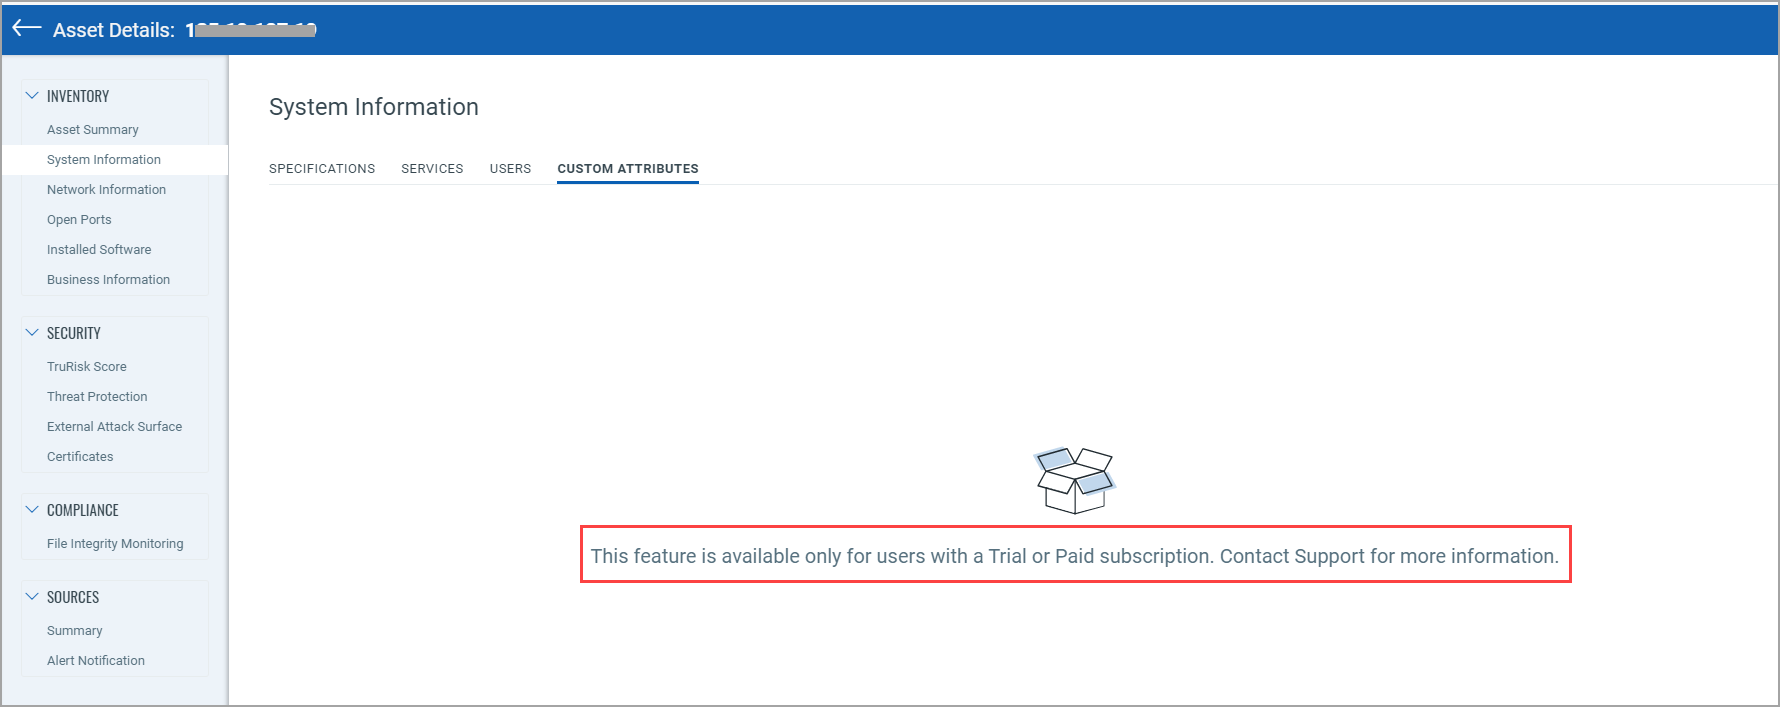
When you click the System Information tab from the Inventory section from the left pane of the Asset Details page, you can see the new CUSTOM ATTRIBUTES tab.
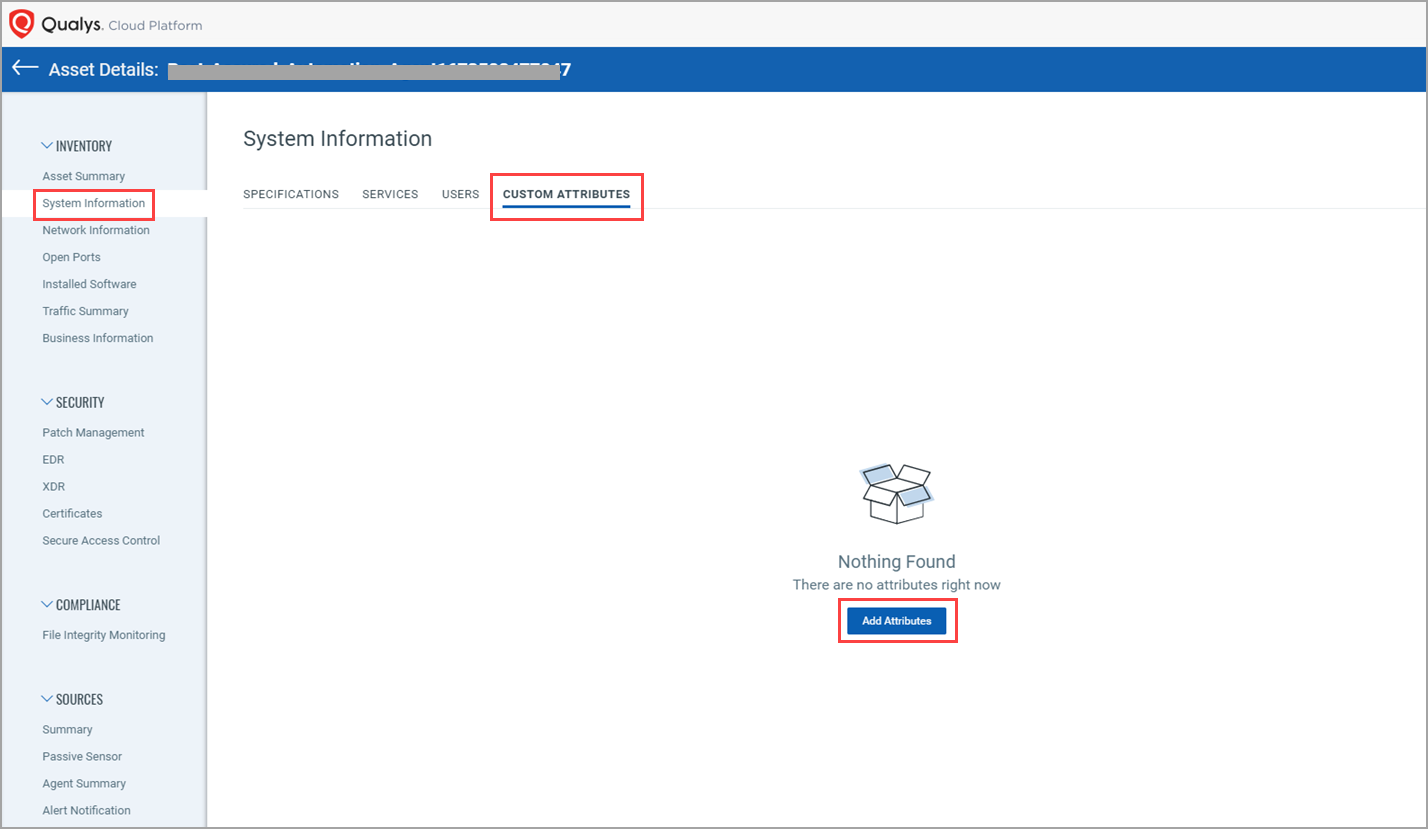
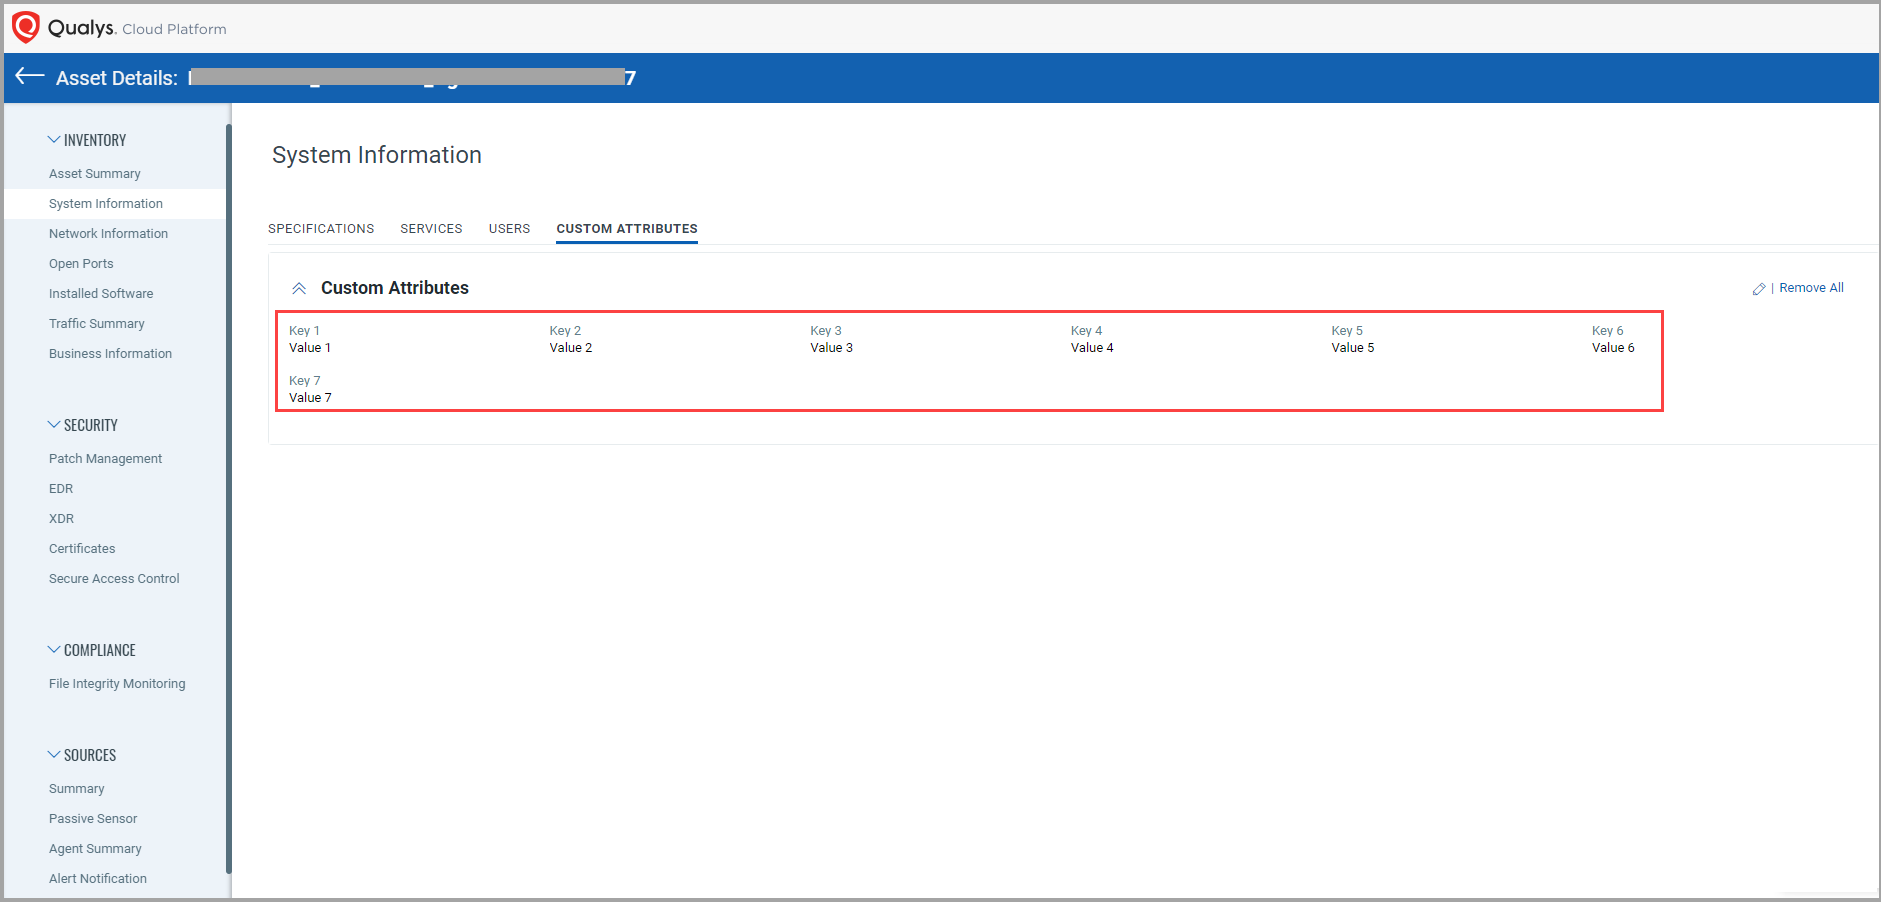
By Clicking Add Attributes, you can add custom attributes for that asset.
The maximum number of custom attributes you can define for an asset is 20.
You need to specify a Key and a Value for a custom attribute.
You can now view the CPE details for the Operating System, Hardware, and Software from the System Information tab.
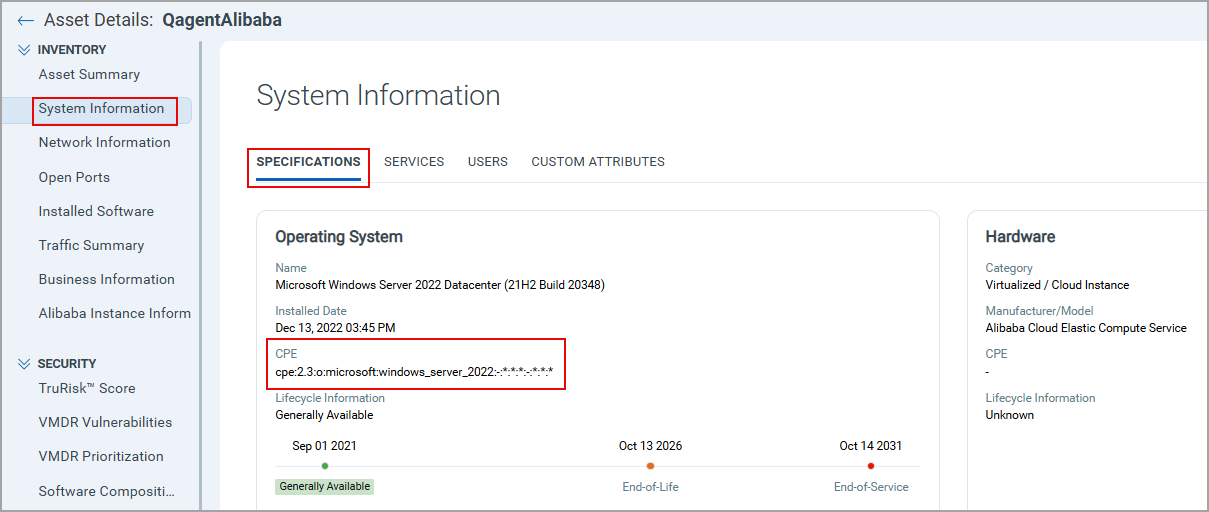
If the CPE values for the matching Operating Systems, Hardware, and Software are available in our catalog, the CPE details are shown. Otherwise, they are not shown.
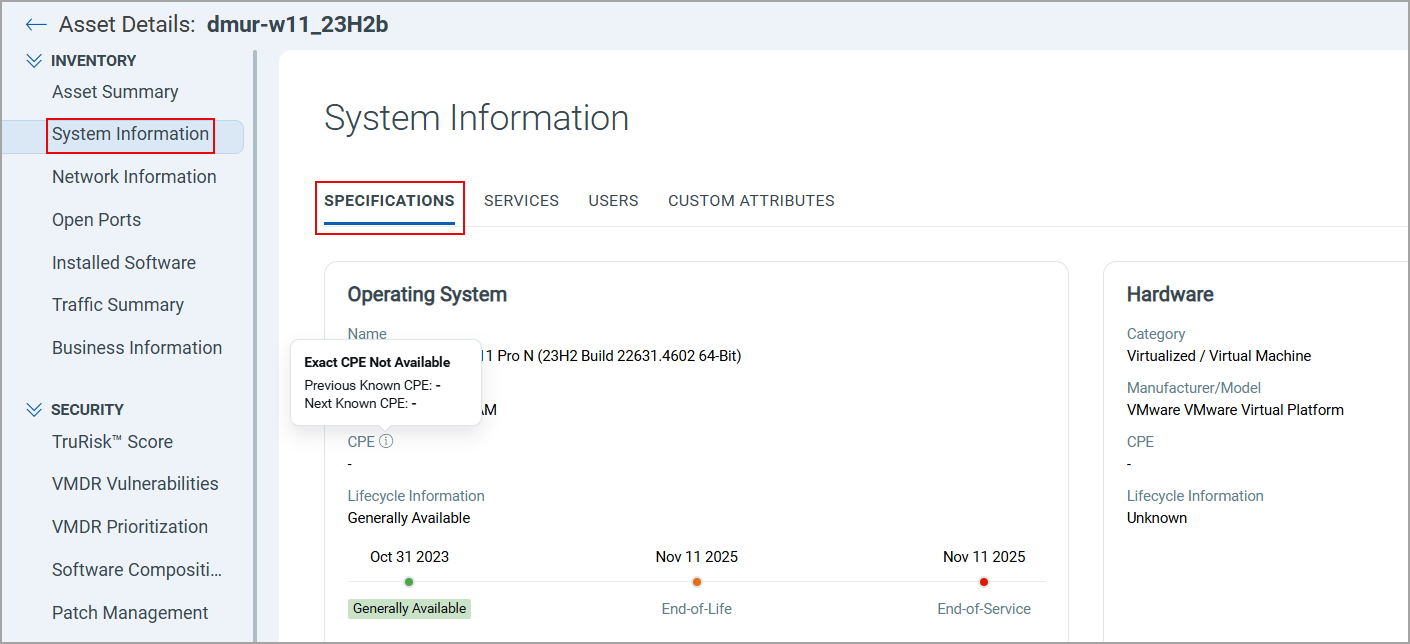
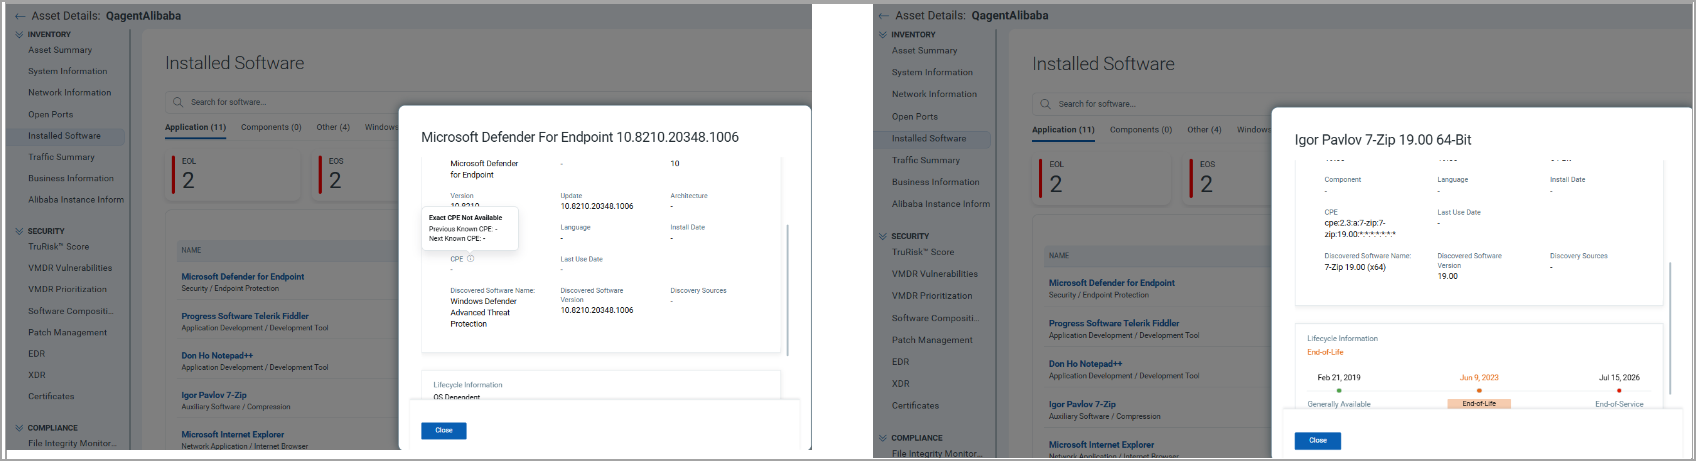
If the current CPE value is not available, only for the Operating Systems and Software, the previous and next CPE information is visible after hovering over the info text icon.
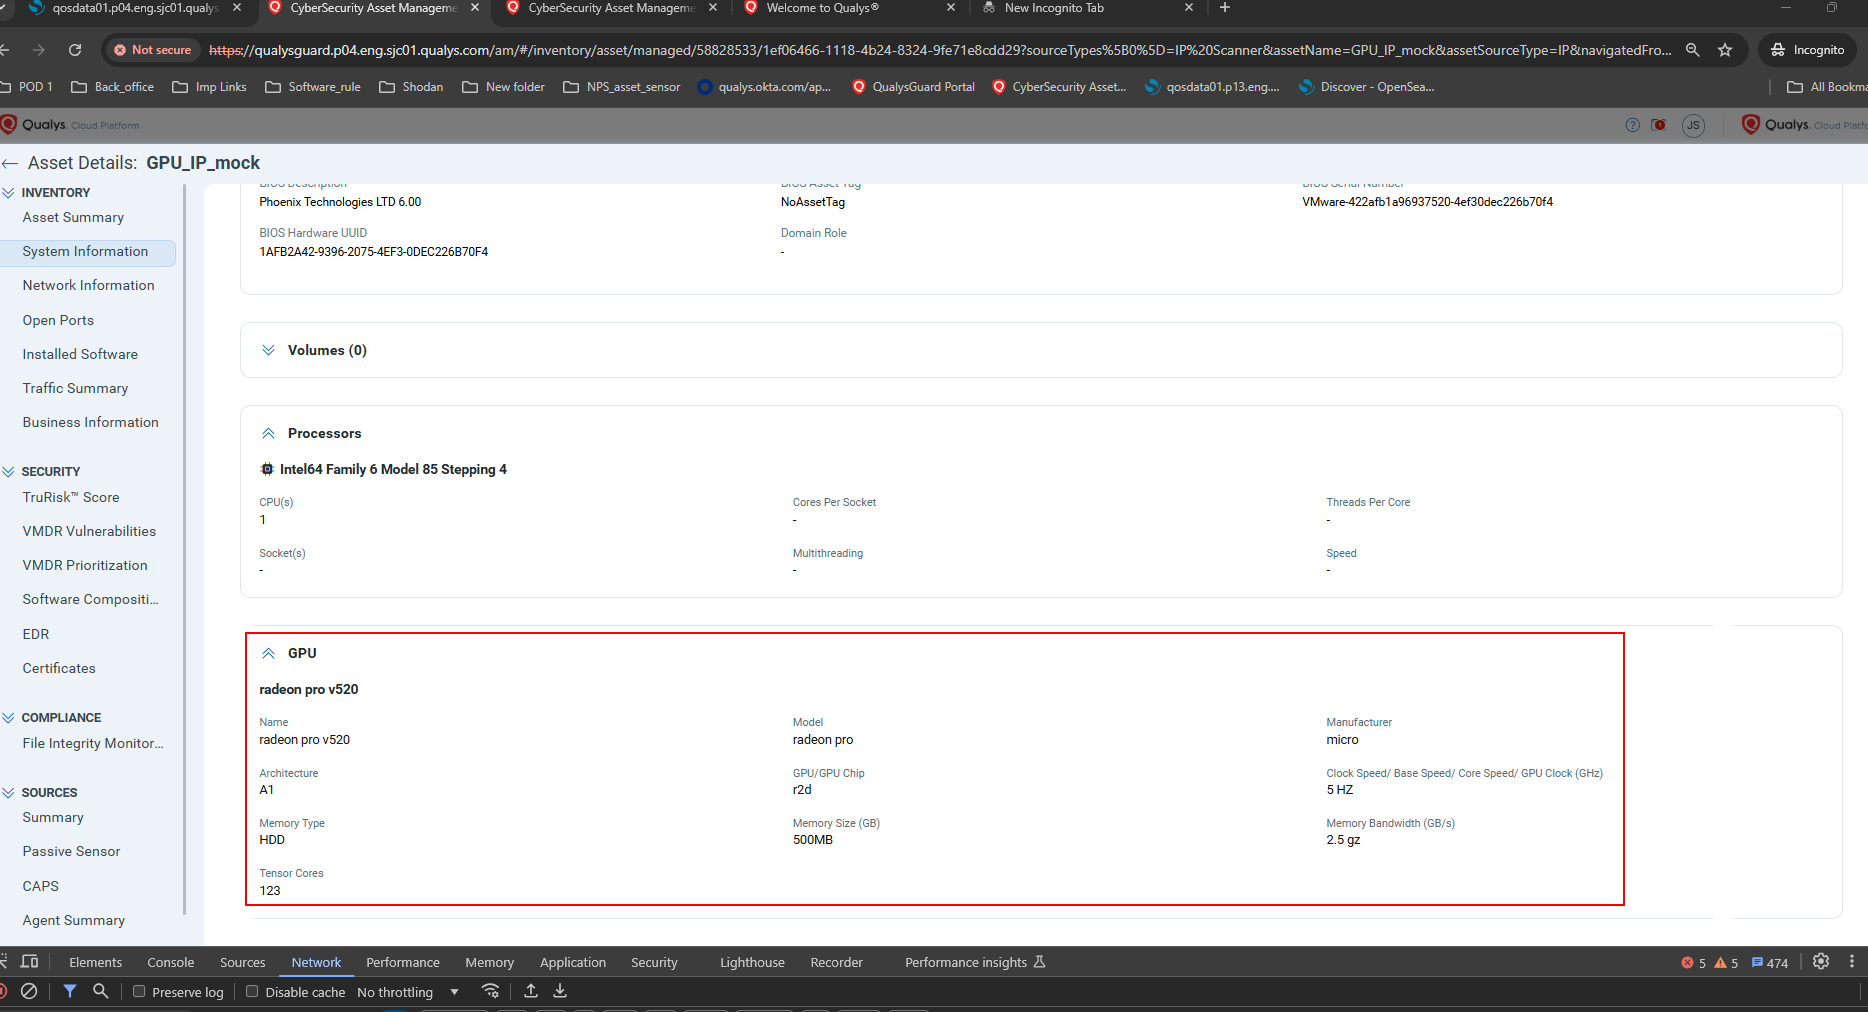
You can view the assets with the Graphical Processing Units (GPU) required for AI processing. If the GPU data is not detected for an asset, the values are shown as (-), and no details are shown in the GPU section if the GPU is not mapped.
Network InformationNetwork Information
You can see the details, such as information for the network connection to the asset, such as IPv4 and IPv6 addresses, MAC Address, Netmask, and Manufacturer/Intro Date, from the Network Information tab.
You can see the open ports and services running on those ports from the Open Ports tab. Also, you can see various tiles that show Authorized ports, Unauthorized ports, and ports that need review.
Installed SoftwareInstalled Software
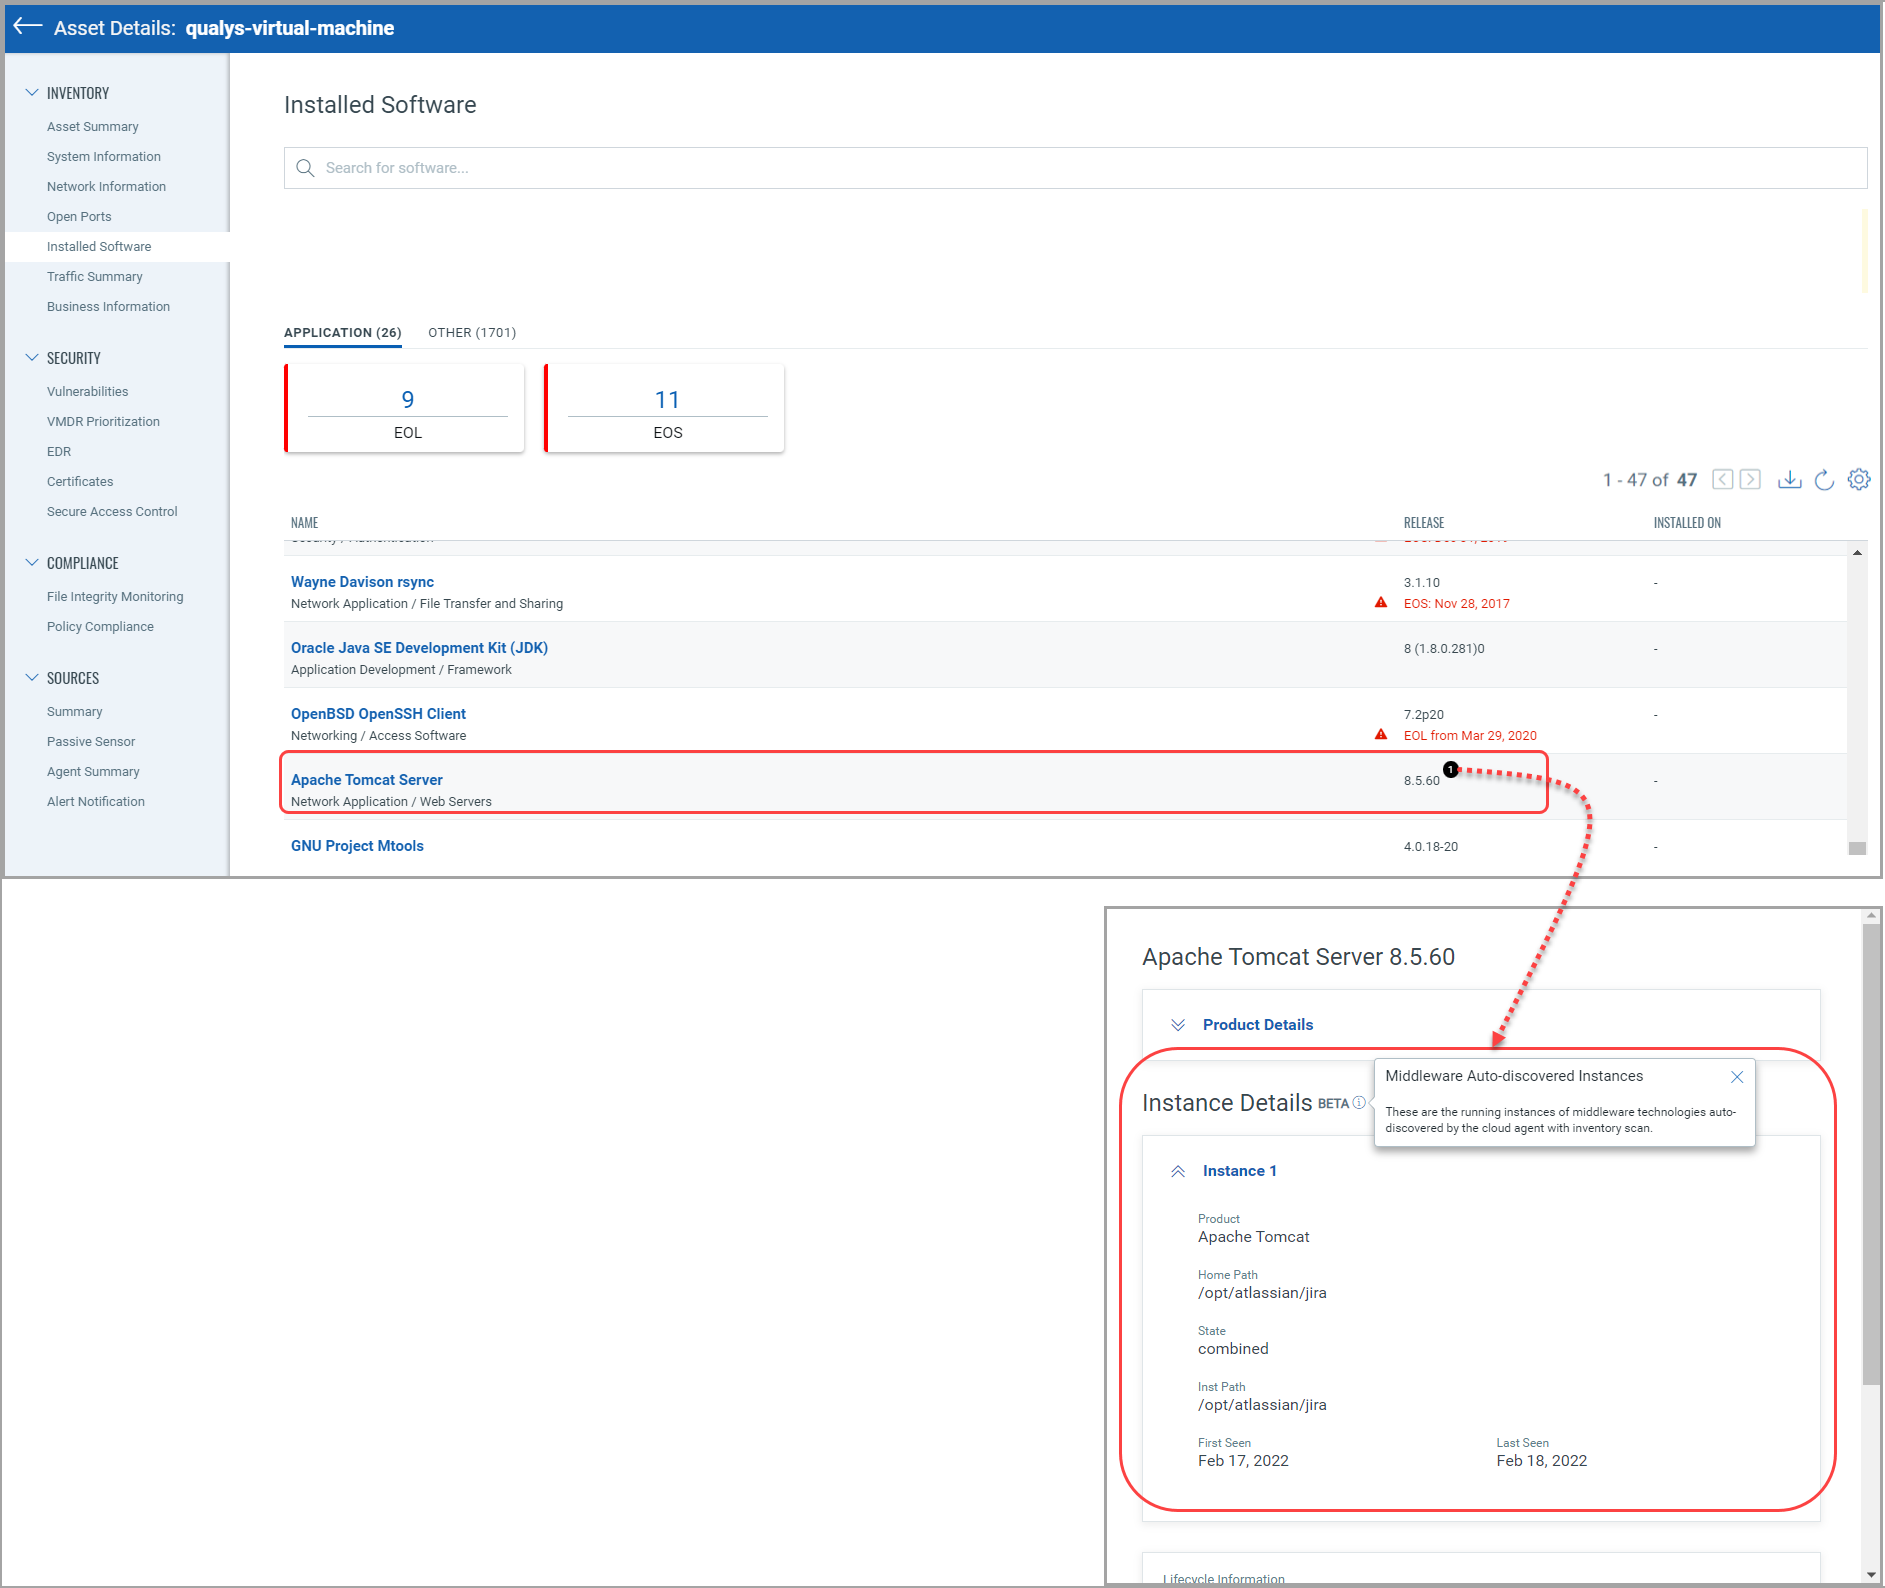
(1) You can see a list of software installed on the asset from the Installed Software tab. This helps you identify the software version, end of license date, etc. You can see the running instances of middleware technologies auto-discovered by the cloud agent (only Windows and Linux platforms) with an inventory scan. Refer to the article, which lists the middleware technologies that are auto-discovered by Cloud Agents.
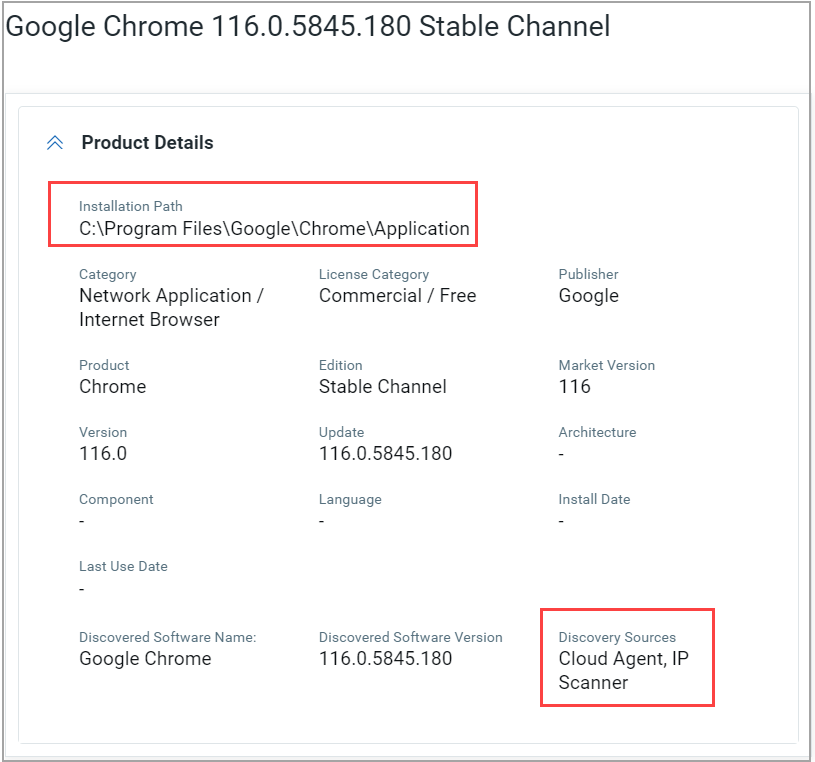
(2) For almost all Windows Cloud Agent assets, you can now see the software's Installation Path and Last Use Date details.
Prerequisites:
- Windows Cloud Agent version 5.5
- The Windows prefetch file from the Cloud Agent
The coverage or the number of software detected is now substantially increased with the help of the Windows prefetch file. If the product name and software version details from the prefetch file match the corresponding software name and version identified during the Cloud Agent scan, then the software's Installation Path and the Last Use Date details are shown.
(3) You can also download a list of software in the Application/Others category installed on the asset by clicking the download icon, as shown in the following screenshot.
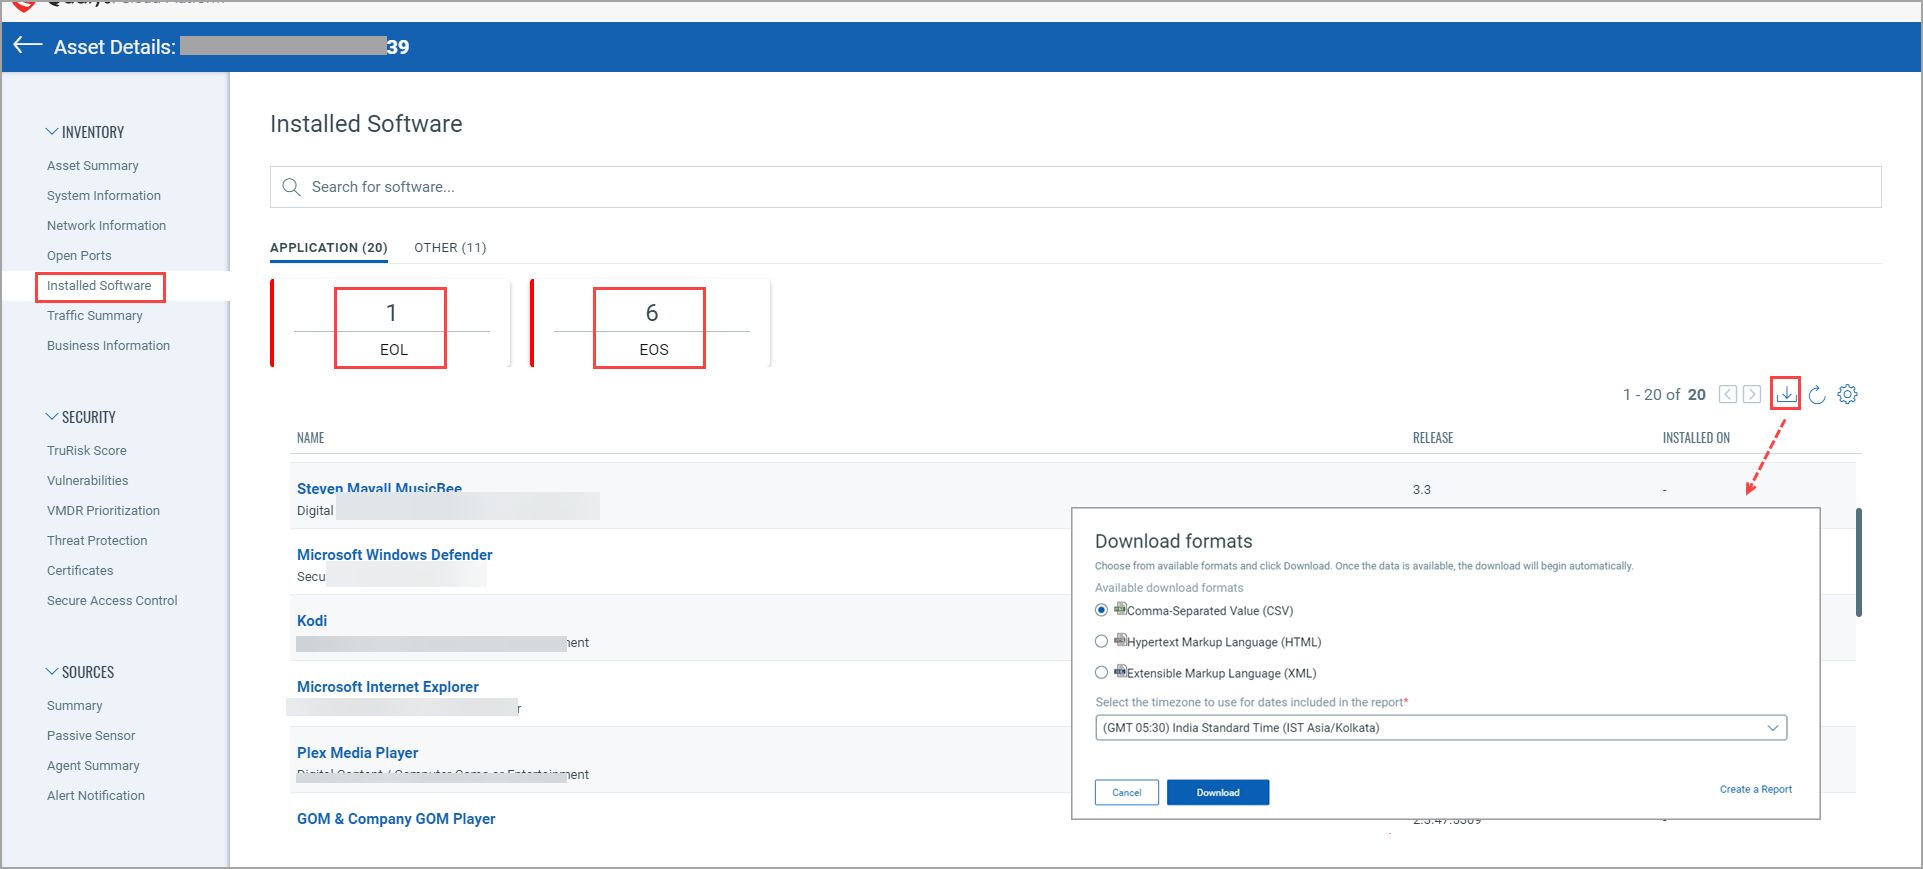
Select the timezone from the drop-down list to use it in the report for the dates, choose available download formats (CSV, HTML, XML), and click Download.
(4) In the following example shown, for the “qualys-virtual-machine” asset, you can see “Apache Tomcat Server” middleware technology has 1 running instance.
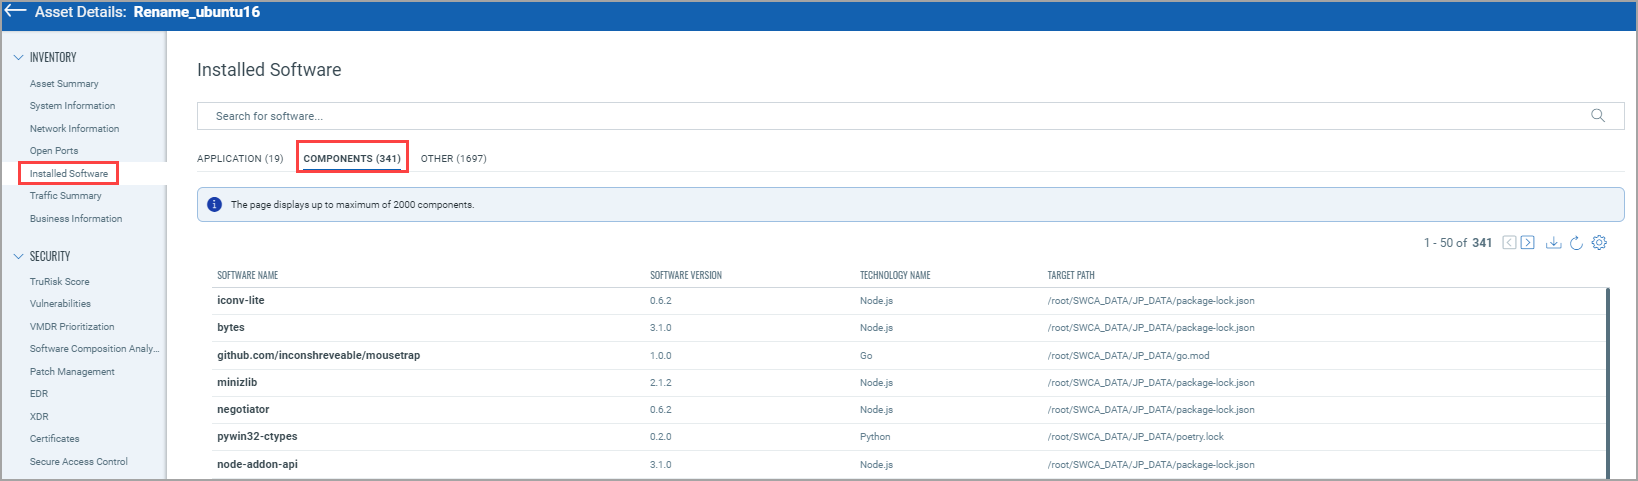
(5) For the assets on which SwCA is activated, you can see the SwCA data from the Asset Details page. From the Installed Software tab, you can see the Components details.
Traffic SummaryTraffic Summary
You can see the traffic details for Clients and Servers, such as to and from date details, Total Ingress, and Total Egress from the Traffic Summary tab.
Business InformationBusiness Information
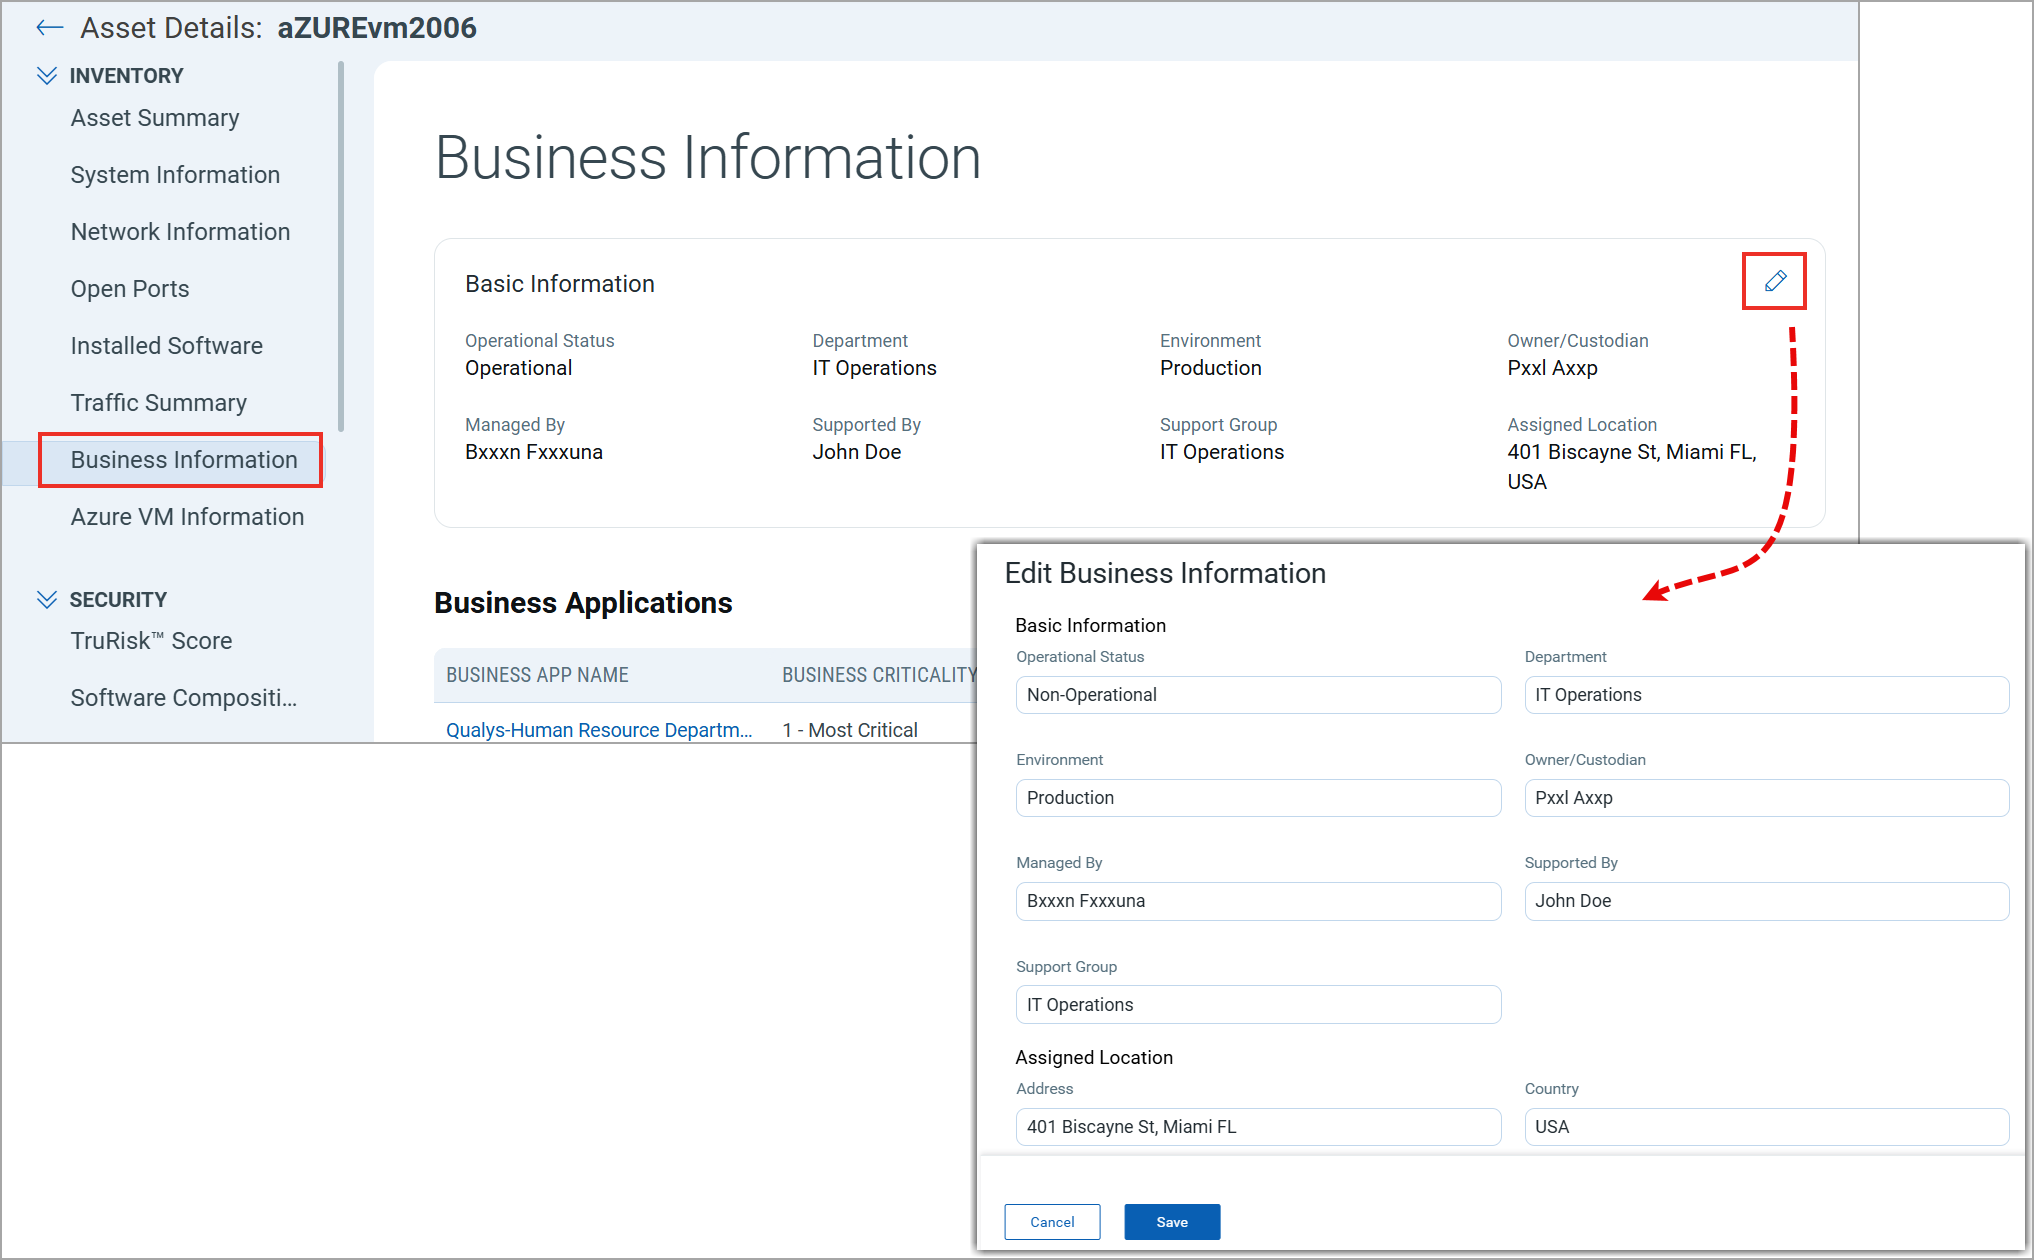
You can see the business information, such as operational status, managed by, support group, assigned location, business app name, and business criticality from the Business Information tab.
From this tab, you can edit the Basic Information by clicking ![]() . Modify the required details and click Save.
. Modify the required details and click Save.
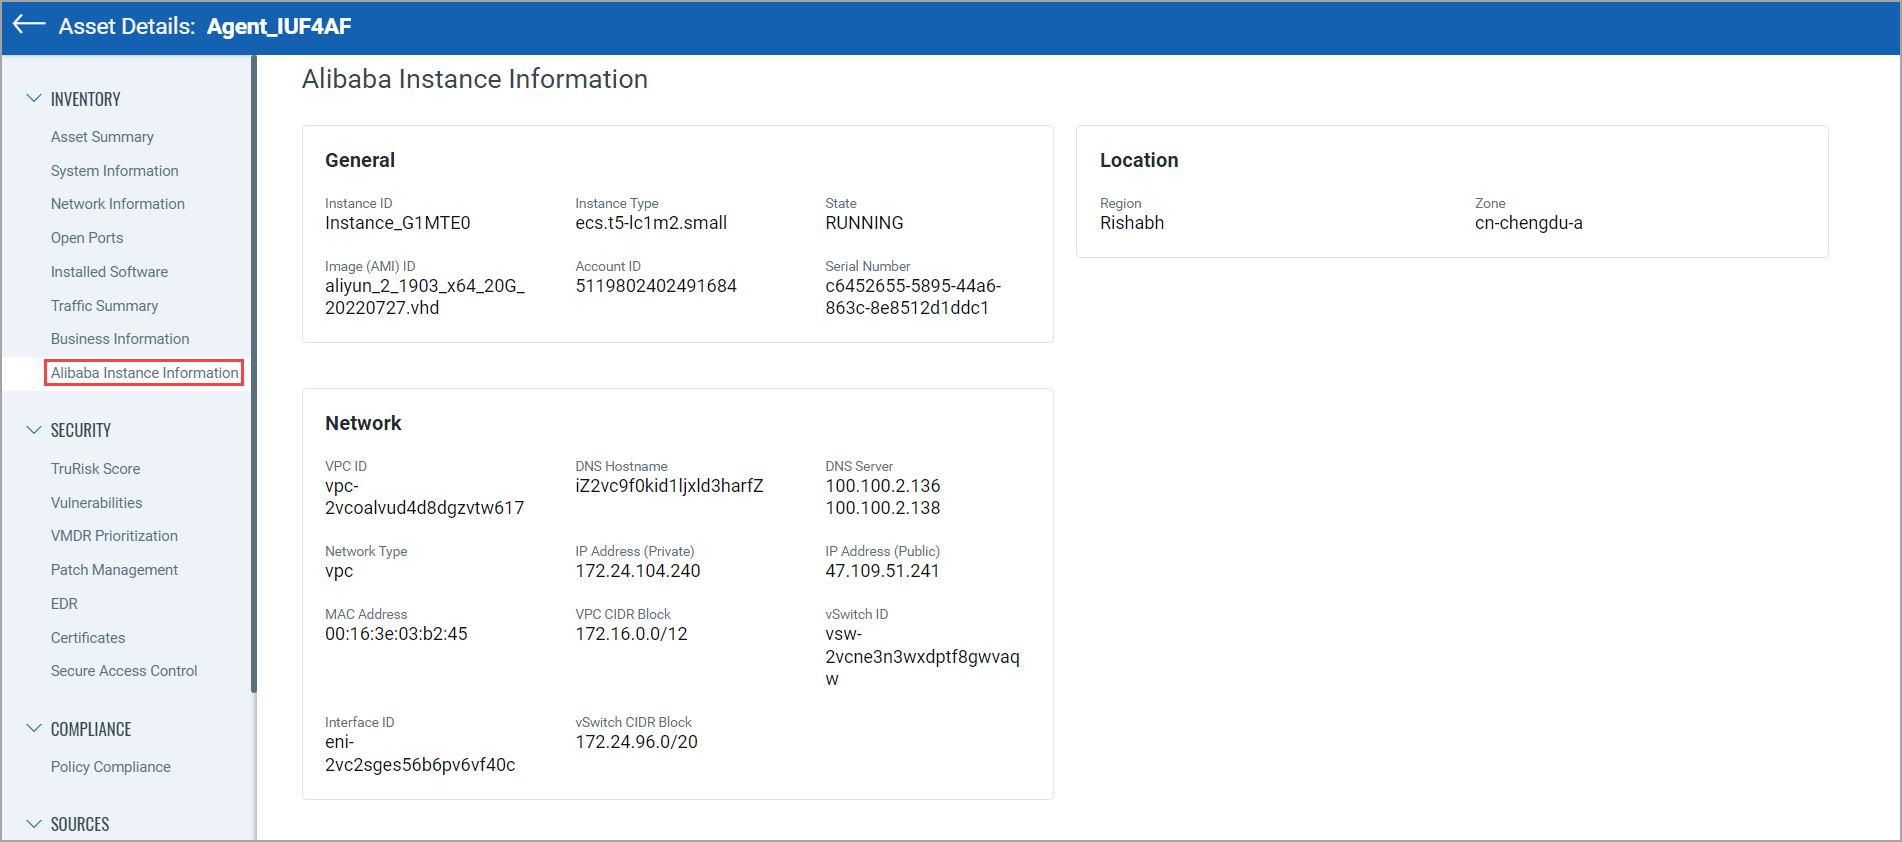
Alibaba Instance InformationAlibaba Instance Information
You can see the Alibaba Instance Information tab in the Inventory section for Alibaba instances. You can find the details about the Alibaba instance, such as Hostname, FQDN, Host ID, and so on.
Security Section Details
You can see multiple tabs such as TruRisk Score, Vulnerabilities, VMDR Prioritization, Software Composition Analysis (SCA), External Attack Surface, EDR, XDR, Certificates, and Secure Access Control. Note that these tabs may vary from asset to asset.
They are shown based on various conditions. Refer to some of the following conditions:
Condition 1: The asset is activated for modules like VM or Certificate View.
Condition 2: The asset is part of the Patch Management or FIM subscriptions.
Condition 3: The asset is an EASM asset.
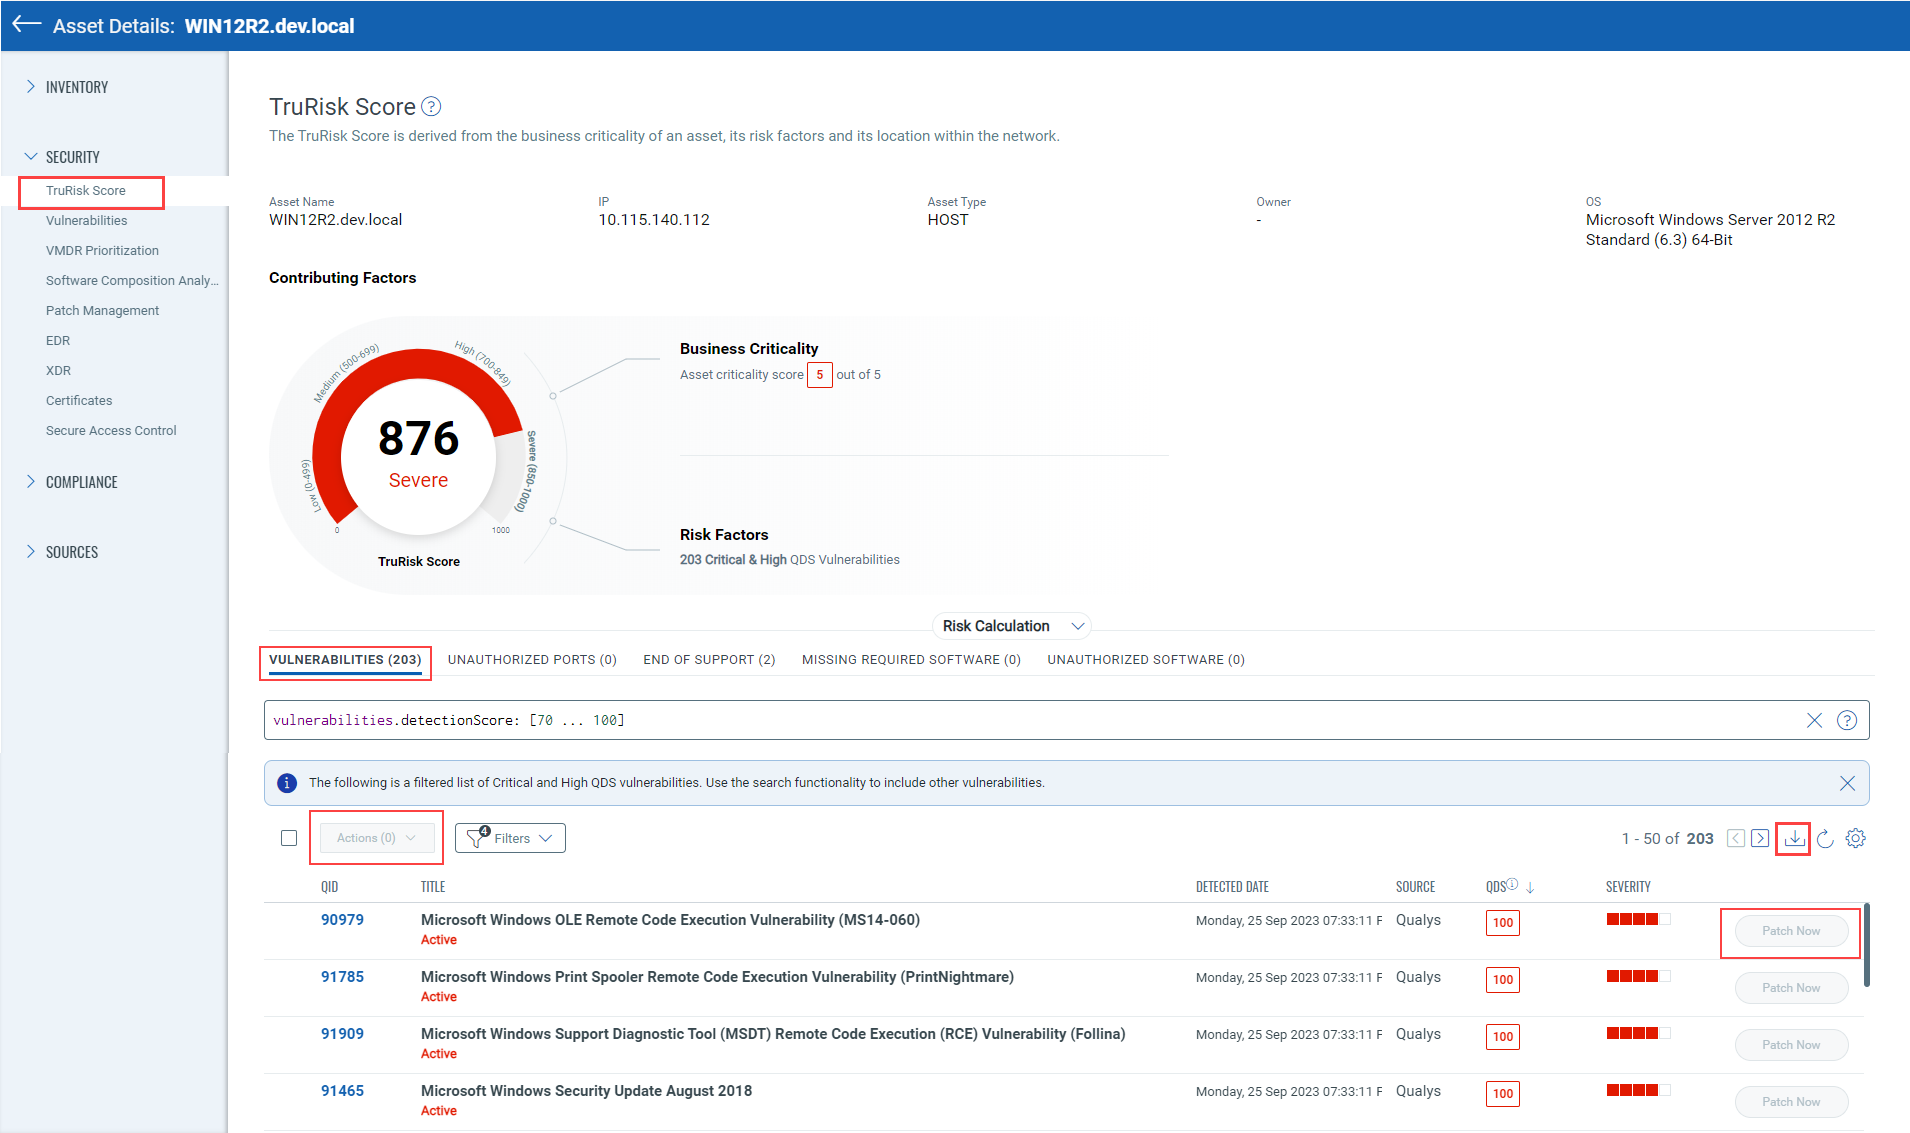
You can see the detailed TruRisk details for the asset from the TruRisk Score tab.
- The primary information of the asset, such as Asset Name, IP, Asset Type, and Operating System.
- The TruRisk Score count for the asset. The TruRisk score is categorized as Low, Medium, High, and Severe. The ranges for the same are also mentioned. You can also see Business Criticality and Top Risk Factors.
- The TruRisk Calculation formula.
- The factors that contribute to the TruRisk in aggregation. These factors are shown as an individual tab.
Note:
- CSAM Trial or Paid User, and VMDR enabled: Vulenratbilites detected from VMDR along with the CSAM truRisk calculating factors contribute to the risk contributor and generate TruRisk Score.
- CSAM Trial or Paid User, and VMDR not enabled: Only the CSAM truRisk calculating factors contribute to the risk Contributor and generate TruRisk Based on CSAM risk contributing factors.
Vulnerabilities tab:
You can see the vulnerabilities detected for the asset from the Vulnerabilities tab. By default, the detailed list of the vulnerabilities is shown based on Critical and High QDS vulnerabilities. You can also choose to include other vulnerabilities.
The detailed vulnerability details include the QID, Title, date when the vulnerability was detected, Source, Severity, and QDS. The Qualys Detection Score (QDS) is calculated, considering the CVSS score and the vulnerability context to prioritize remediation actions.
If the asset is activated for the VM module, you can choose to patch the vulnerability by clicking Patch Now. You can also patch multiple vulnerabilities by selecting the checkboxes next to the QID of required vulnerabilities. If you want to patch all the vulnerabilities on the page, select the checkbox next to the Actions Menu. Then, you can add it to an existing or a new job.
You can also download the vulnerability details in the CSV format.
Unauthorized Ports tab
You can see the unauthorized port details. You can create port rules to add unauthorized and authorized ports to the rule. Then, the QDS scores get associated with the Unauthorized ports.
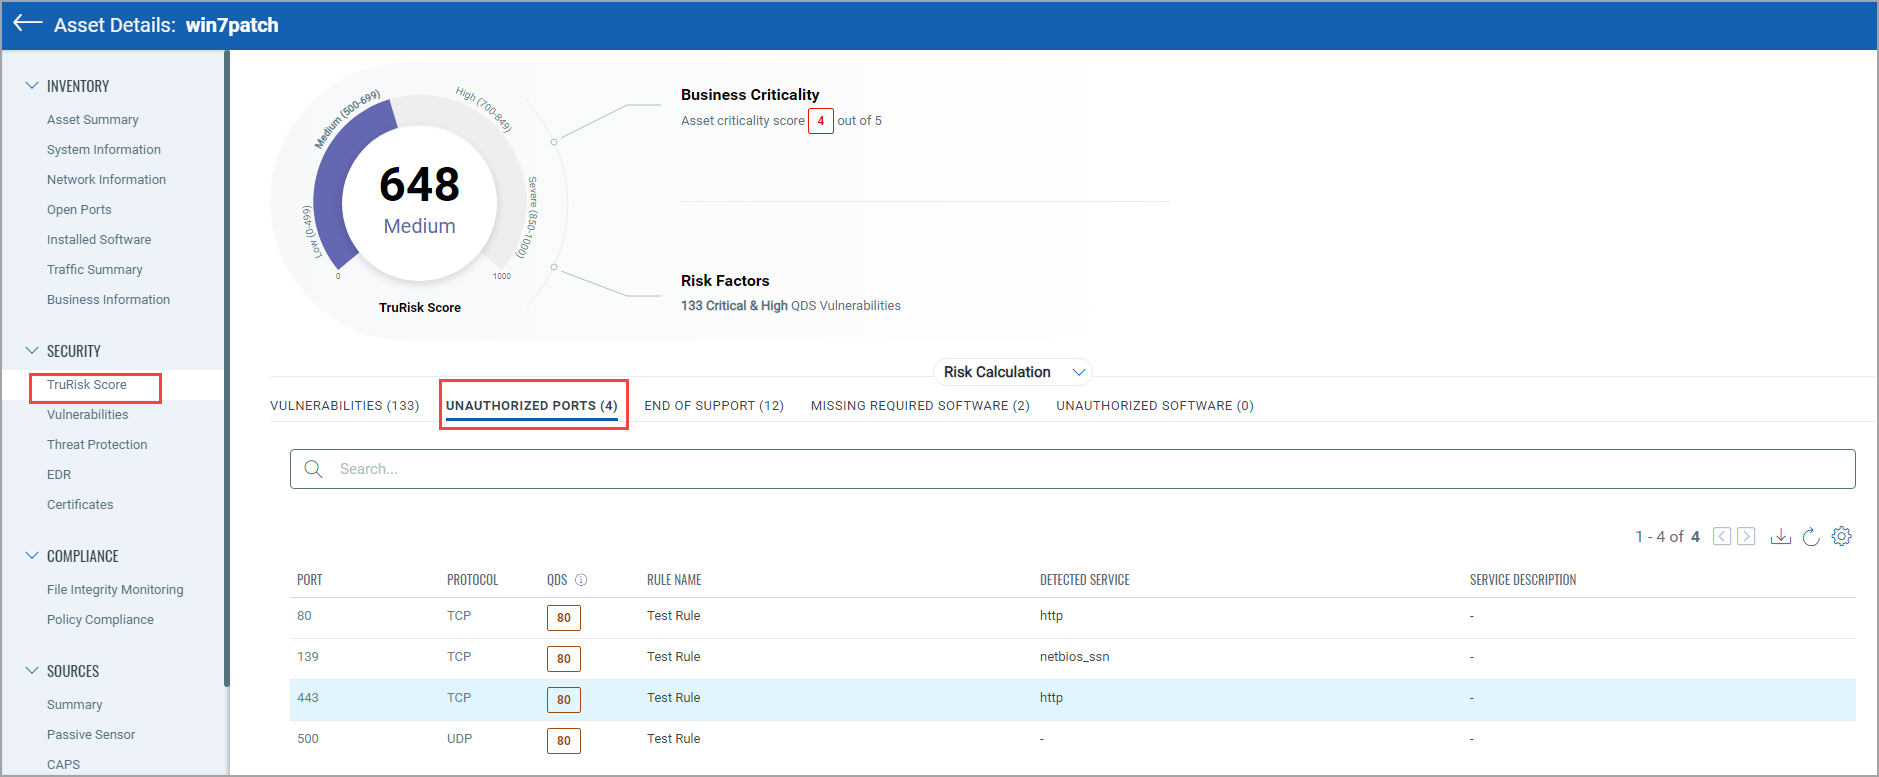
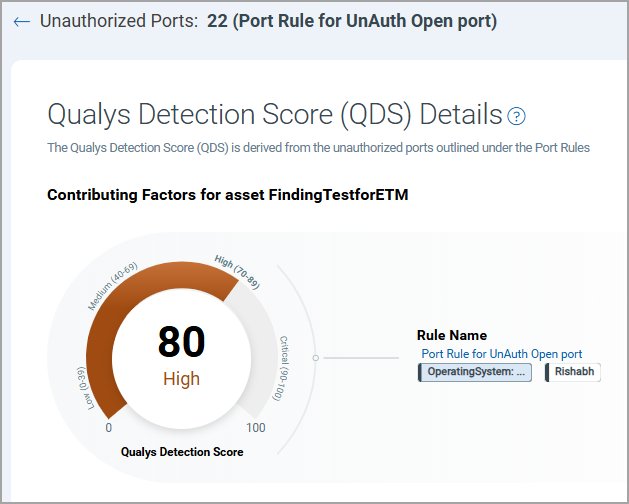
When you click the QDS score from the QDS column, you can see the Qualys Detection Score (QDS) details that are derived from the unauthorized ports that are added at the time of Port Rule creation. You can also see the rule name.
End of Support tab
You can see the detailed list of End-of-Support (EOS) software, the software that will go end-of-support, and software with unknown EOS dates but have been GAed in the past. The associated QID for every software is also shown.
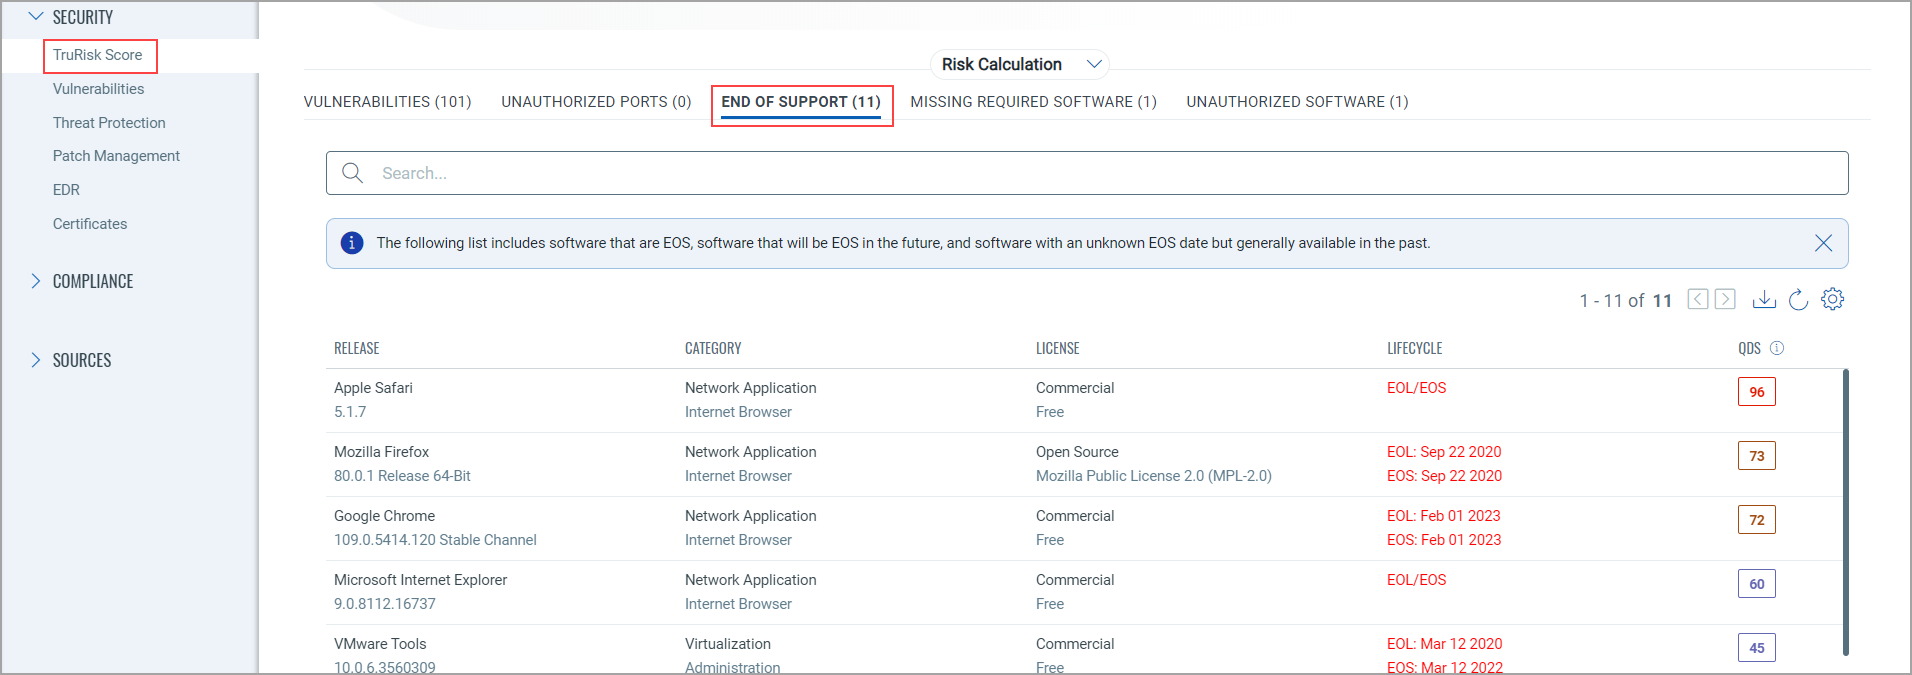
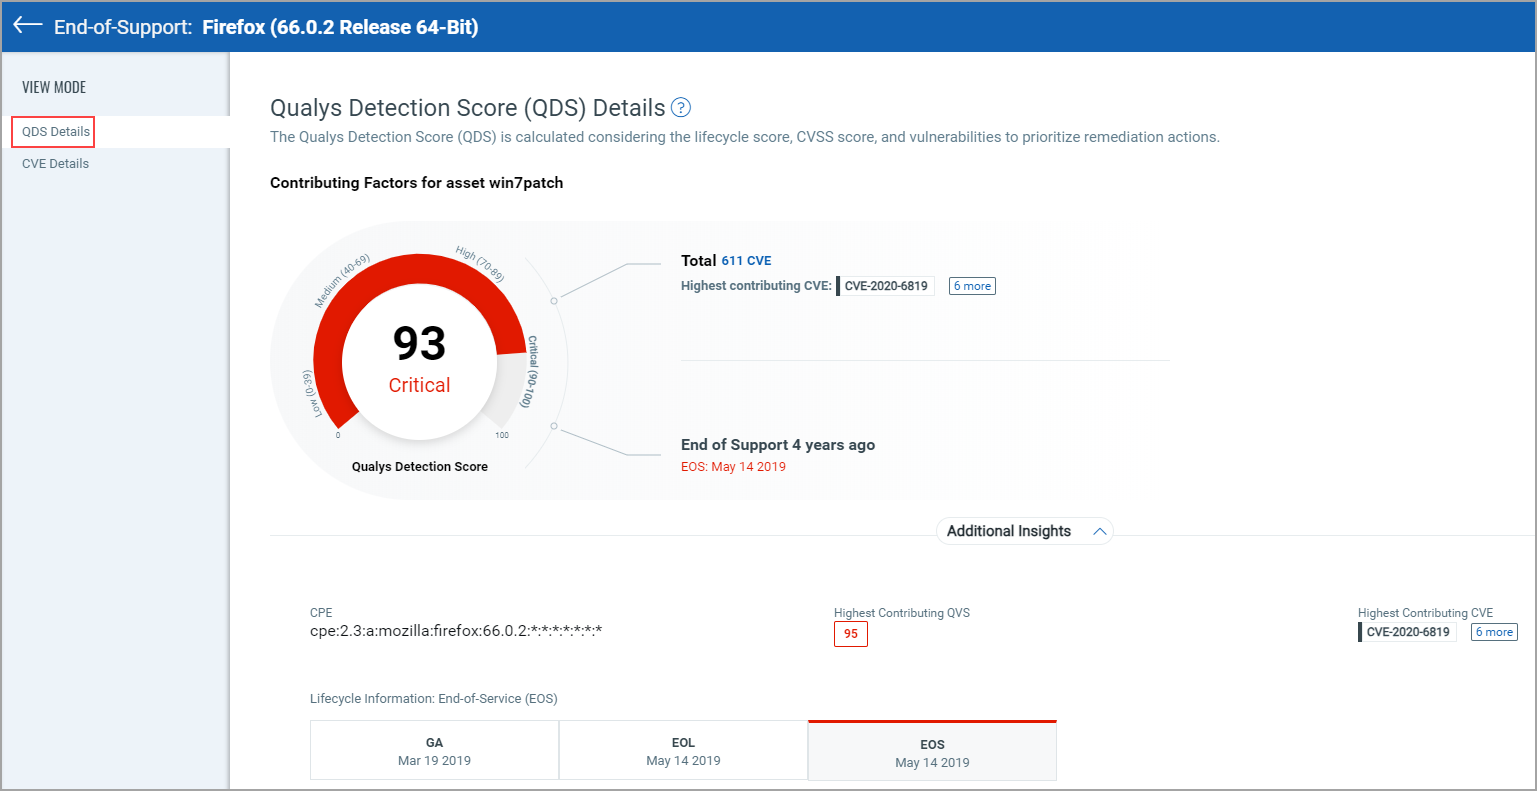
When you click the QDS score from the QDS column, you can see the QDS details and CVE Details from the respective tabs.

Missing Required Software tab
You can see the Missing Required Software details. You can choose to assign the QDS score while creating the Software Rule. The assigned QDS and the rule name are also shown for the respective Missing Required Software.
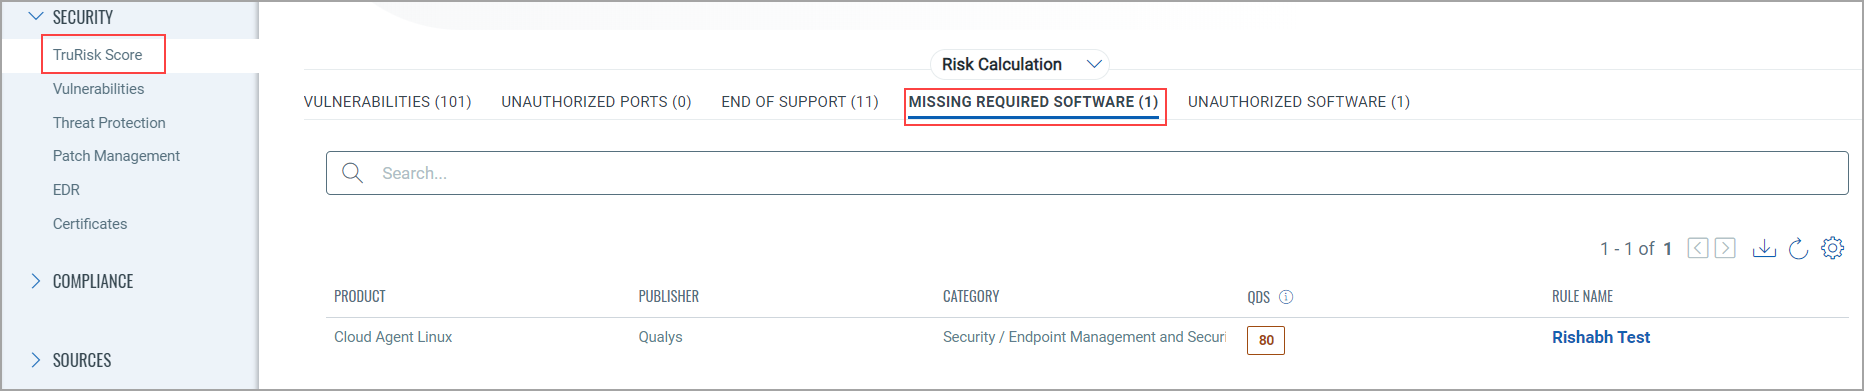
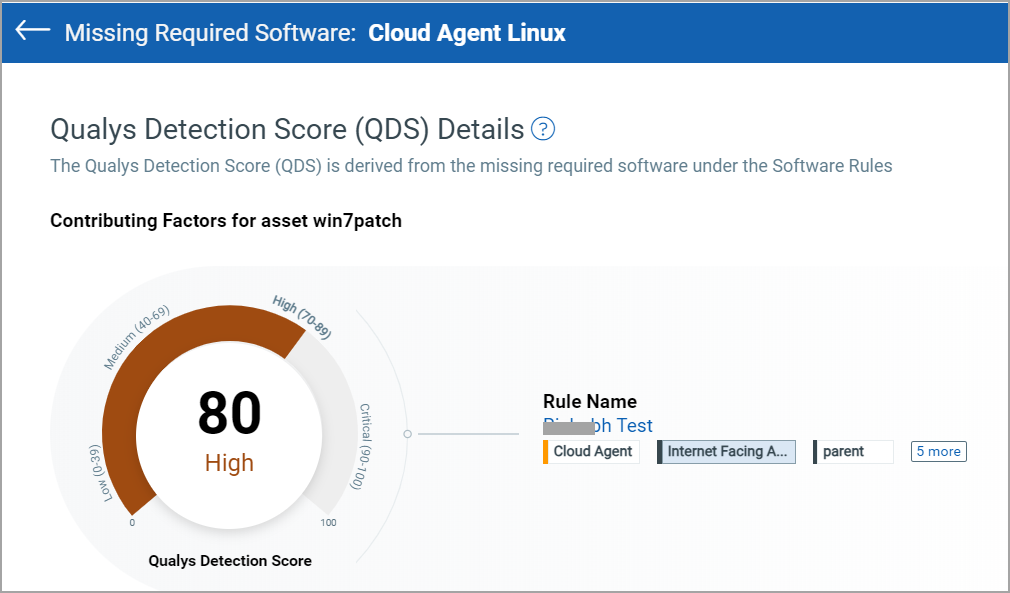
When you click the QDS score from the QDS column, the Qualys Detection Score (QDS) details that are derived from the missing required software that are added at the time of software Rule creation. You can also see the software rule name.
Unauthorized Software tab
You can see the Unauthorized Software details. You can choose to assign the QDS score while creating the Software Rule. The assigned QDS and the rule name are also shown for the respective Unauthorized Software.
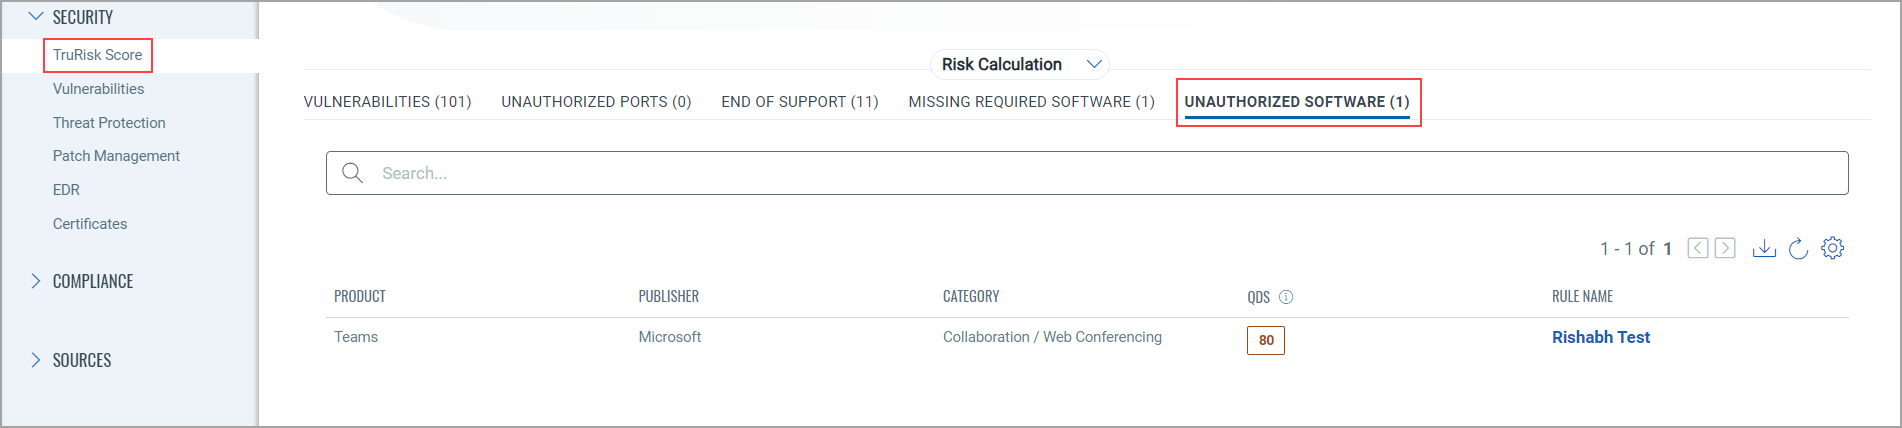
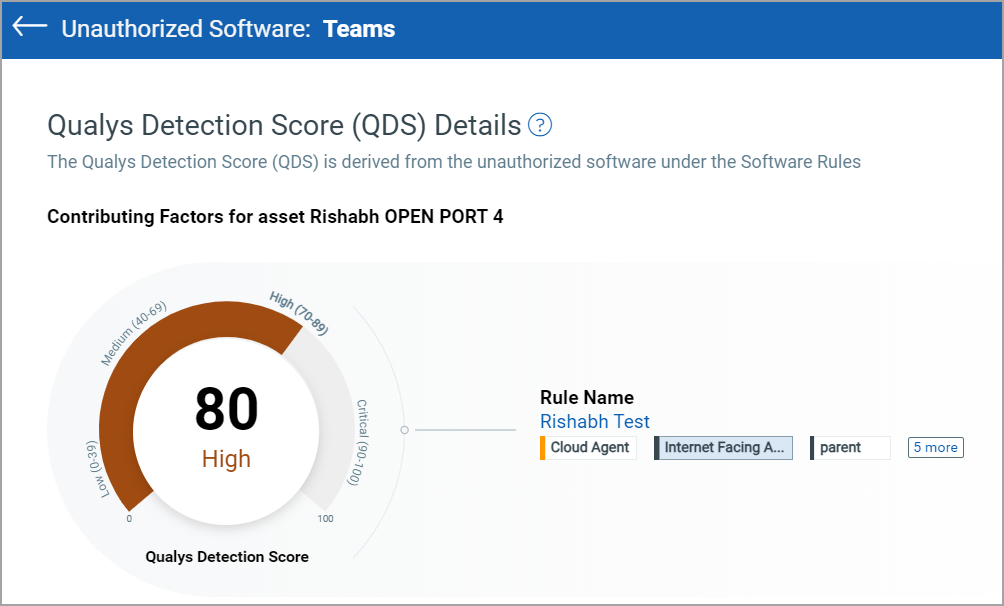
When you click the QDS score from the QDS column, the Qualys Detection Score (QDS) details that are derived from the unauthorized software that are added at the time of software Rule creation. You can also see the software rule name.
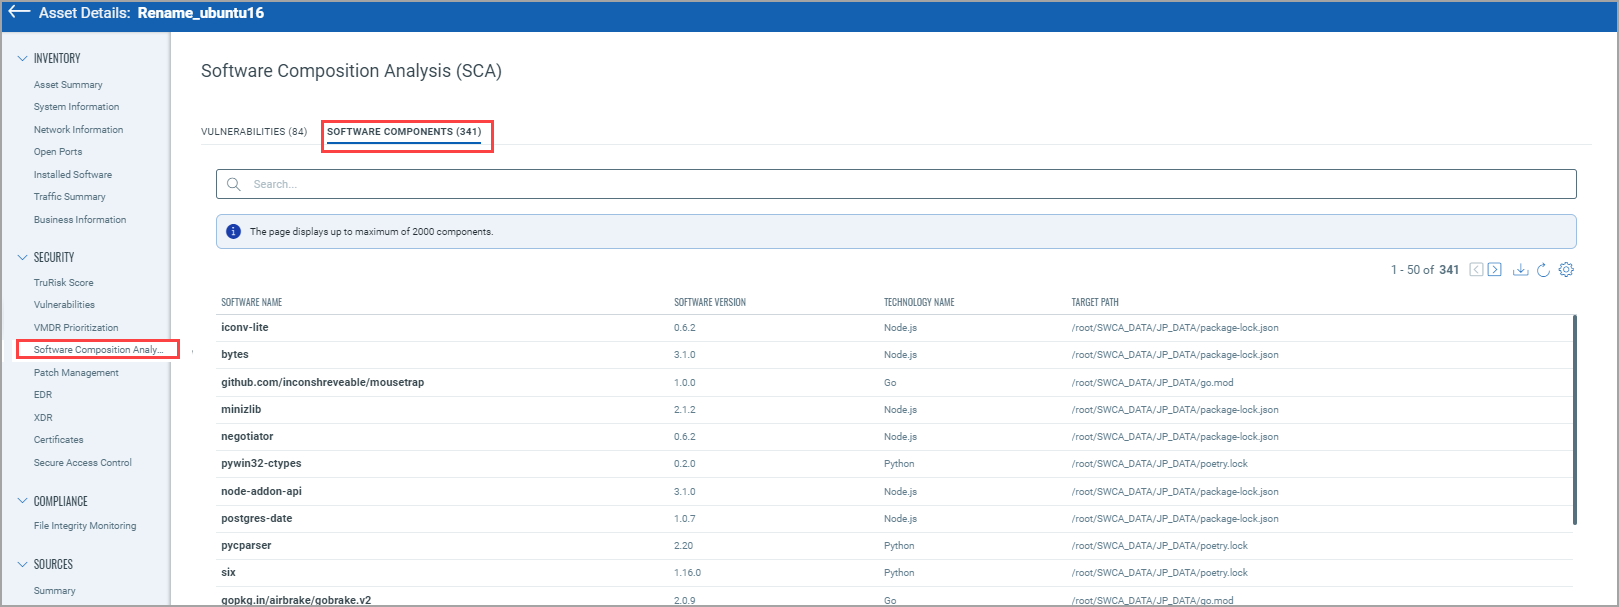
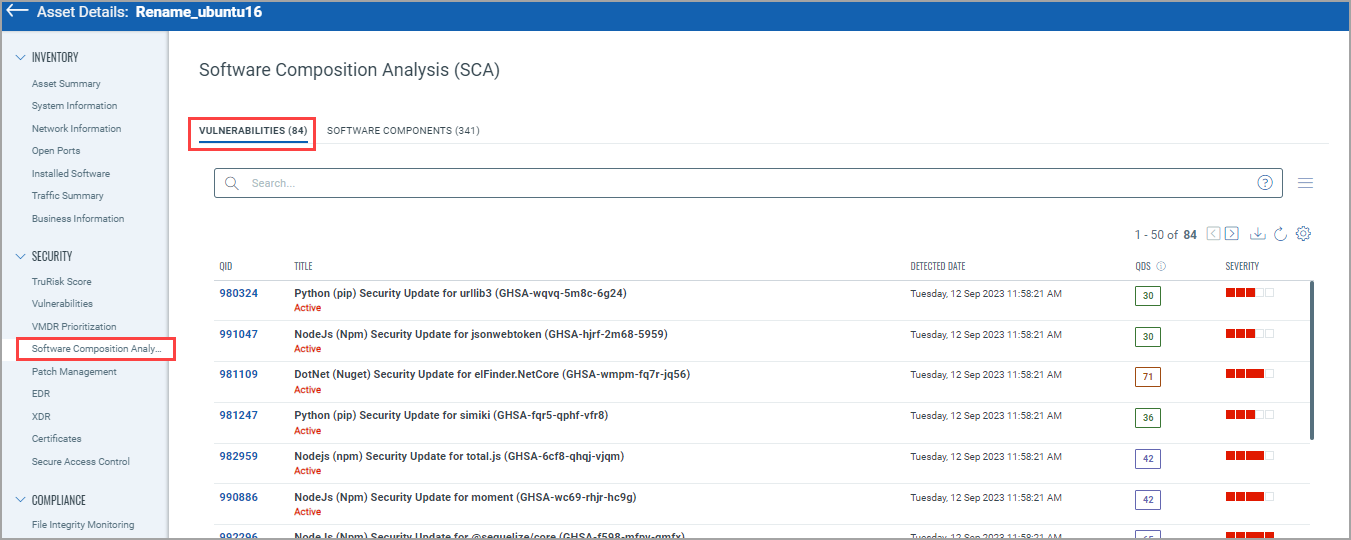
Software Composition Analysis (SCA)Software Composition Analysis (SCA)
With the software composition analysis (SwCA) feature, cloud agents discover and report software components and vulnerabilities associated with third-party or open-source dependent software used by Qualys applications.
From the Software Component Analysis tab, you can see the Software Components and Vulnerabilities identified. Currently, the following software technologies are supported to detect software component data: Ruby, Node.js, Go, Rust, PHP, Python, Java Platform, and Standard Edition (Java SE).
External Attack SurfaceExternal Attack Surface
You can see the EASM asset details from this tab. For more information, refer to the "External Attack Surface Details of an Asset" section from this topic.
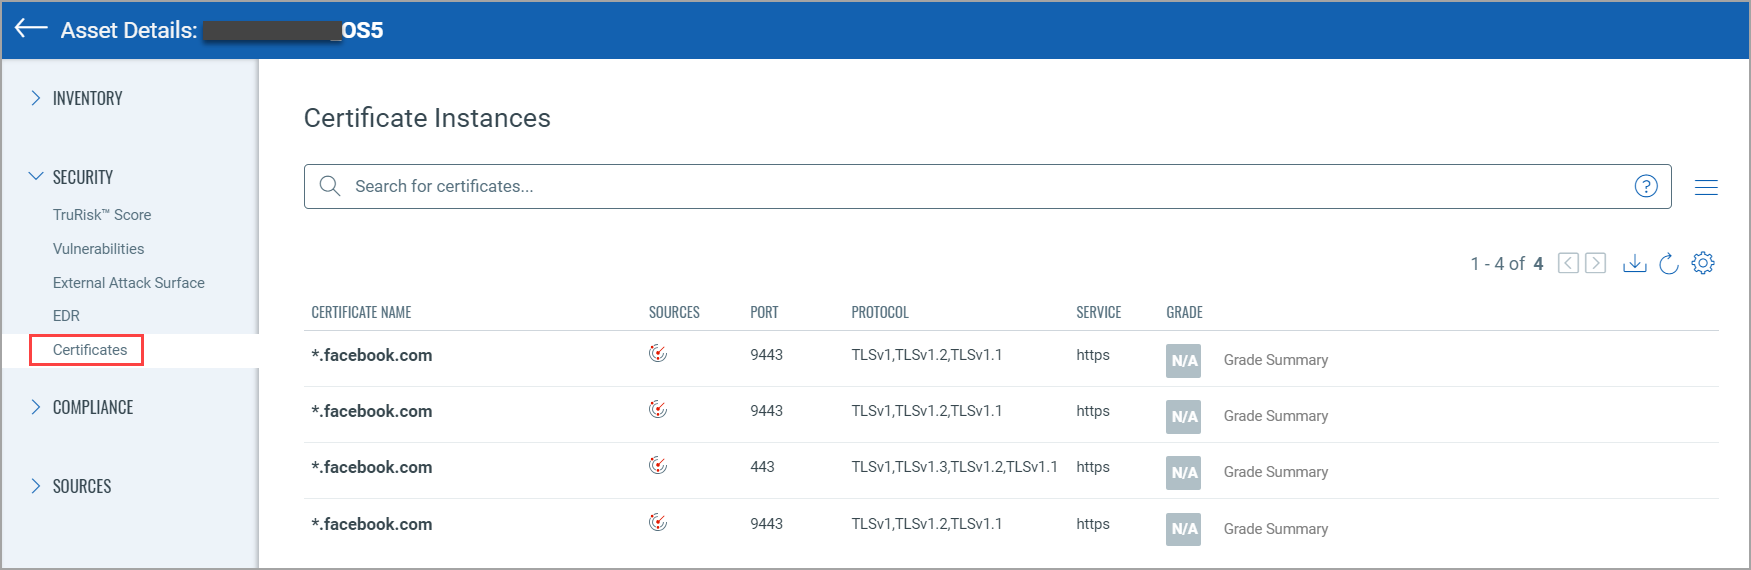
From the Certificates tab, you can see Certificate instance details, such as certificate name, protocol, and service.
Compliance Section Details
File Integrity ModuleFile Integrity Module
If FIM is enabled for the asset, you can see the respective details.
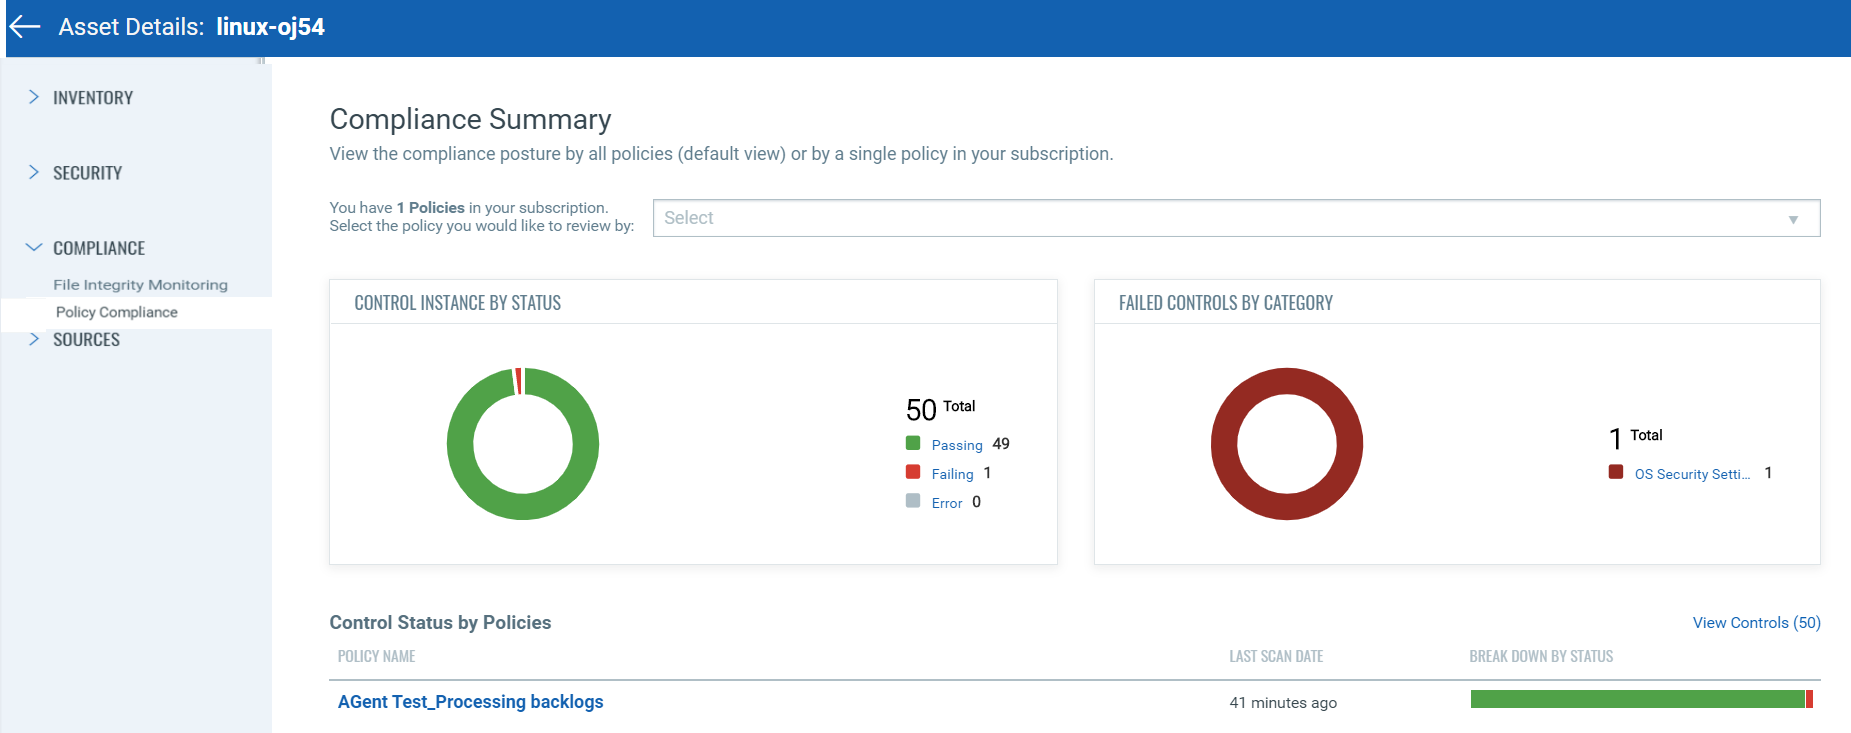
Policy CompliancePolicy Compliance
You can see the compliance posture by a policy or all policies in your subscription.
Sources Section Details
The Summary tab provides a consolidated view of all discovery sources that identified the asset, including Sensors and Connector Sources.
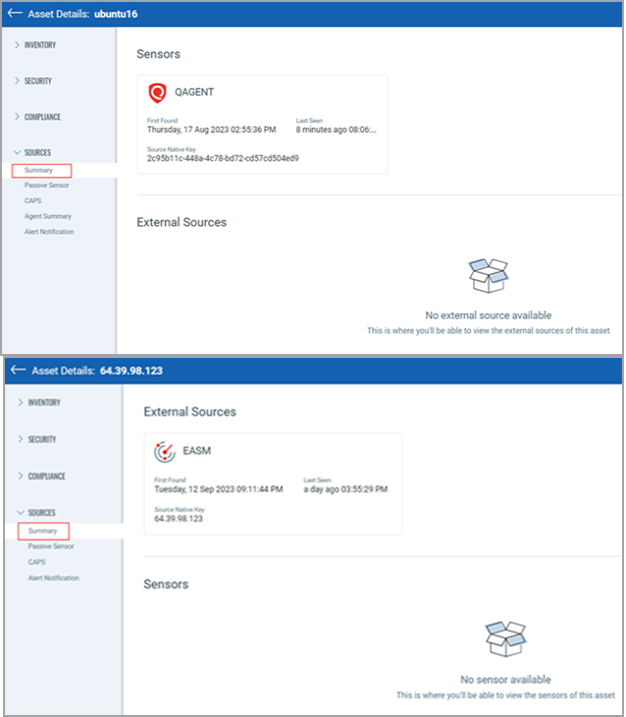
Sensors
The Sensors section displays asset discovery information from Qualys sensors, such as CMDB and EC2.
For each sensor, the following details are displayed:
| Field | Description |
|---|---|
| Sensor Name | The sensor that detected the asset (for example, EC2 or CMDB). |
| First Found | The date and time when the asset was first discovered by this sensor. |
| Last Seen | The most recent data and time the sensor detected the asset. |
| Source Native Key | The unique identifier assigned to the asset by the third-party source. |
Connector Sources
The Connector Sources section displays asset discovery details collected through third-party connectors, such as ServiceNow, BMC Helix. For each connector source, the following information is available:
| Field | Description |
|---|---|
| Connector Name | The name of the third-party connector used to import the asset. |
| First Found | The date and time when the connector first discovered the asset. |
| Last Seen | The most recent date and time the asset was updated by third-party source. |
| Source Native Key | The unique identifier assigned to the asset by the third-party source. |
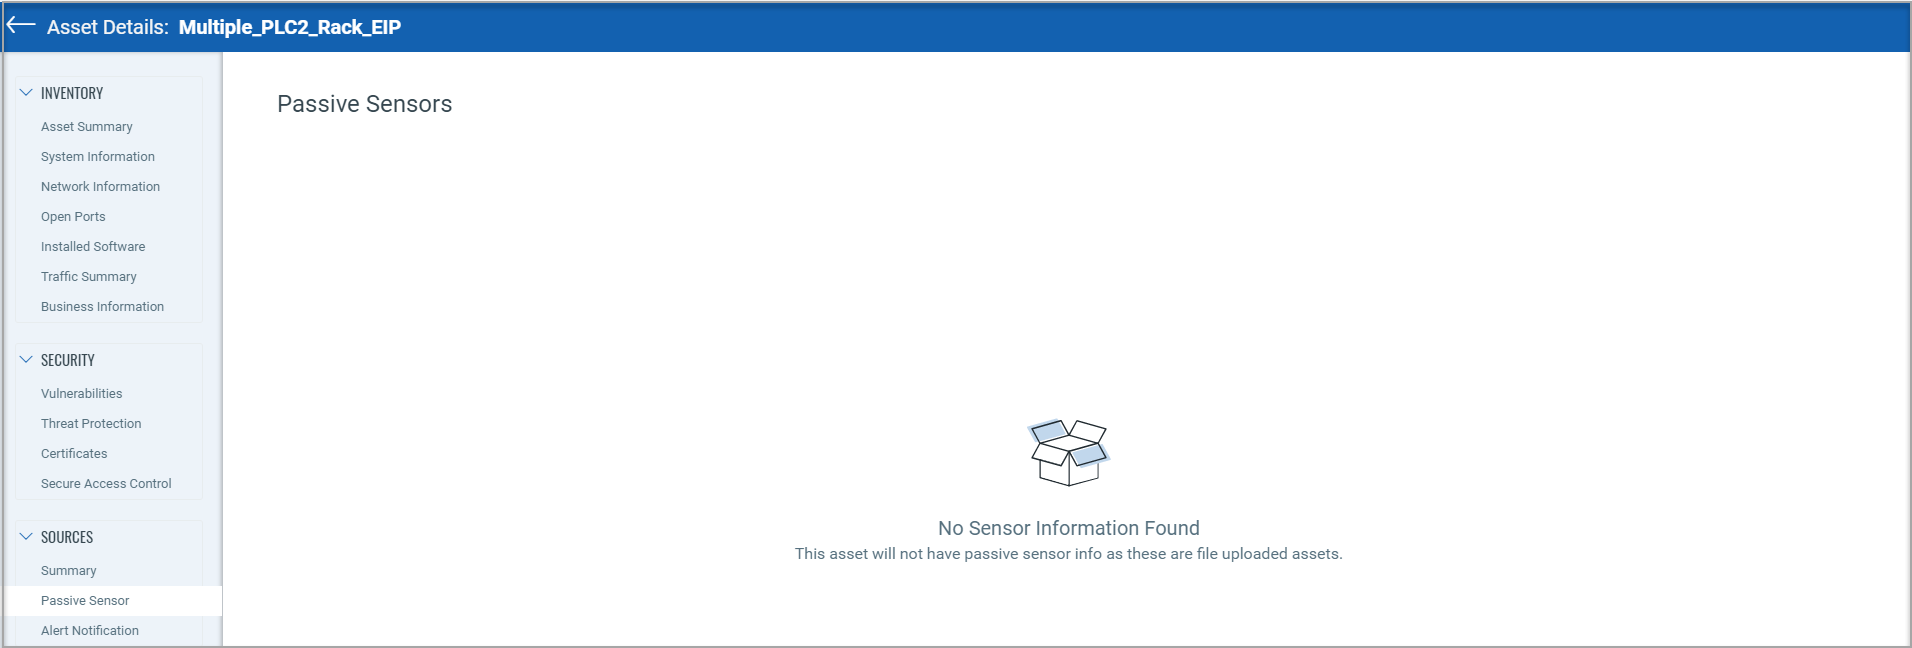
The "Passive Sensor" page provides the details of the sensor that reported the asset. However, ICS_OCA tagged assets are created from the project file that is uploaded by the user in the "ICS module". Hence, the passive sensor information is not applicable for such assets and therefore not shown on the 'Passive Sensor' page.
You can see detailed information about the asset discovered by CAPS from the Inventory > Sources > CAPS tab, such as Agent UUID, First Found, Last Seen, and so on.
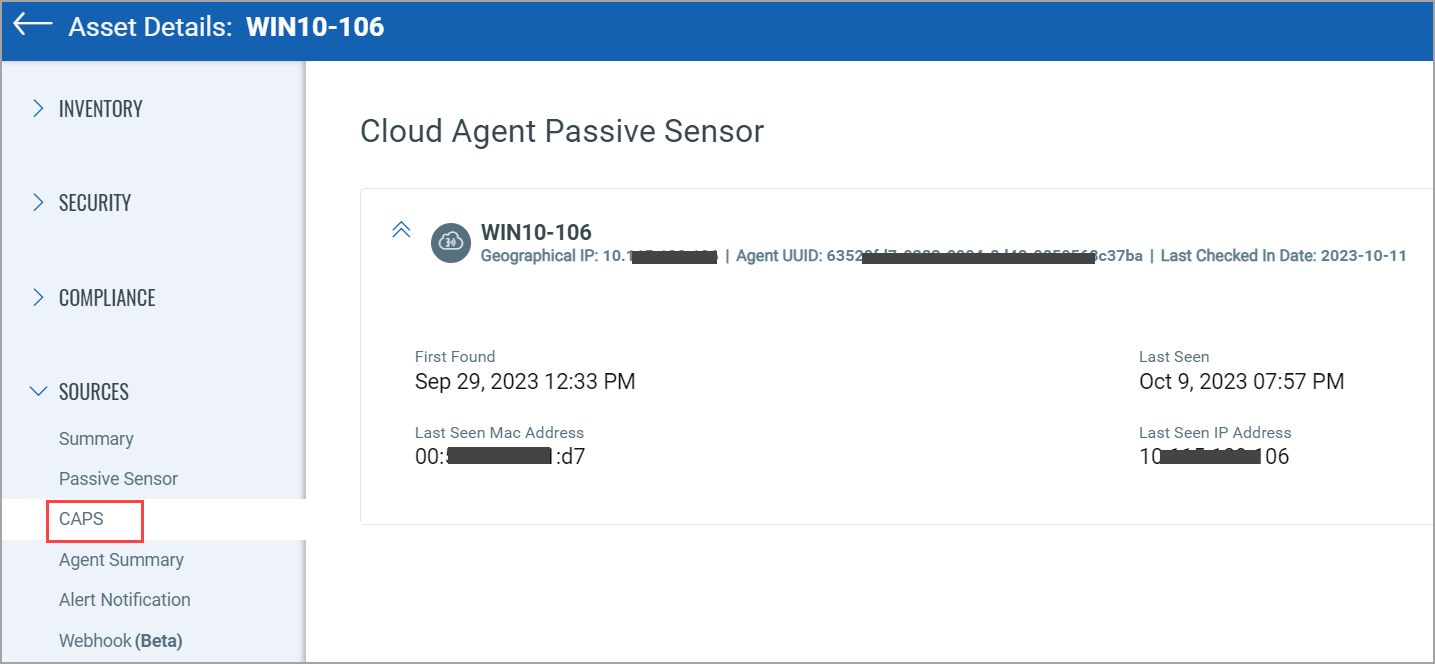
Additional Information resource: Assets discovered by Cloud Agent as Passive Sensor.
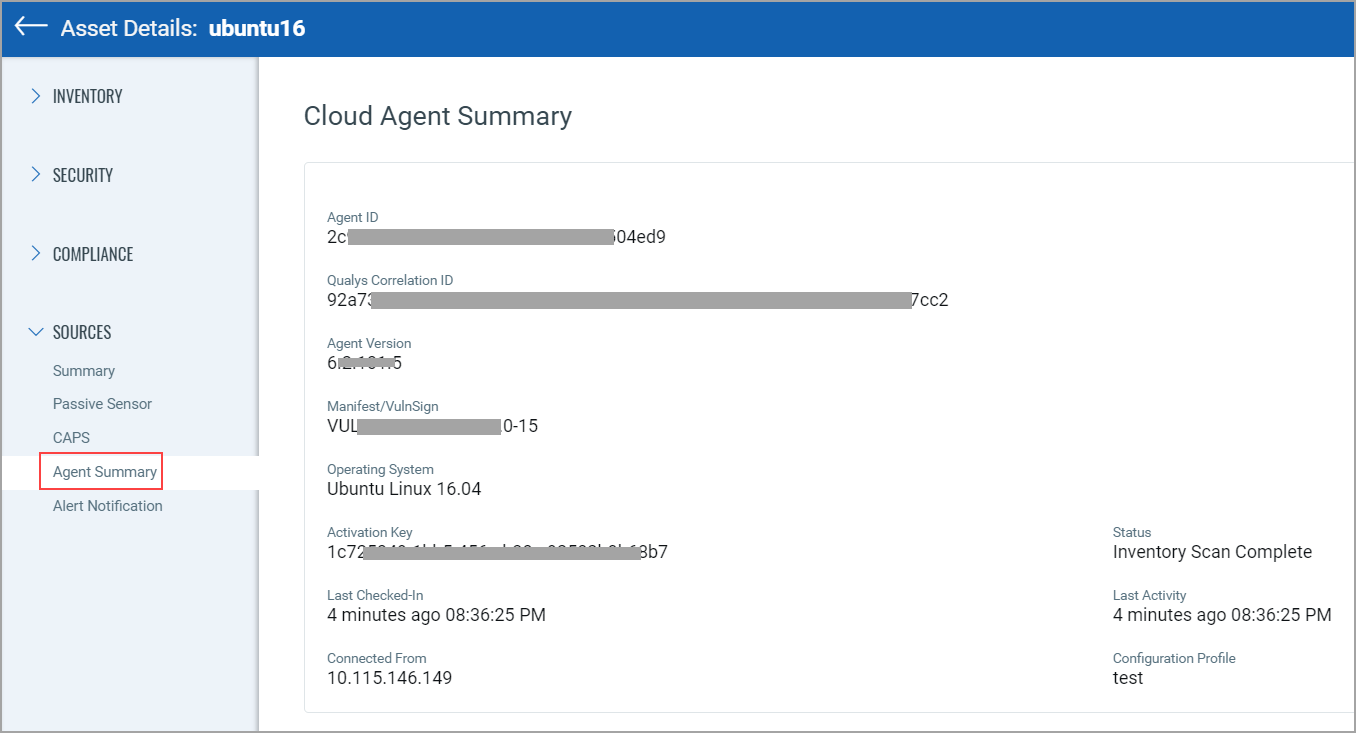
From the Agent Summary tab, you can see the information of the agent from where the asset is collected.
Alert NotificationAlert Notification
You can see alert notification details that are applicable to the asset. The alert notifications are set from the Continuous Monitoring application. If the alert notifications set are not applicable to the asset, you can see the text "No Alert Notifications".