Understand TruRisk™
ETM measures risk in business terms, not just vulnerability counts. TruRisk™ is the score behind that: it combines how critical an asset is to your organization with how risky the findings on it are, so you get one number you can track, compare across business entities, and drive down over time.
This topic explains the concept. For how the score shows up on screen and how to act on it, see the related topics at the end of this page.
You'll see TruRisk™ scores in: Home page (TruRisk™ Summary), Inventory (asset and business entity details), and Risk Management (Risk Workbench and prioritization).
What Is TruRisk™
TruRisk™ is your organization's overall risk score, calculated from the assets and findings in scope. It is designed to answer a simple question: given what you own and what's wrong with it, how much risk are you actually carrying, and where is it concentrated?
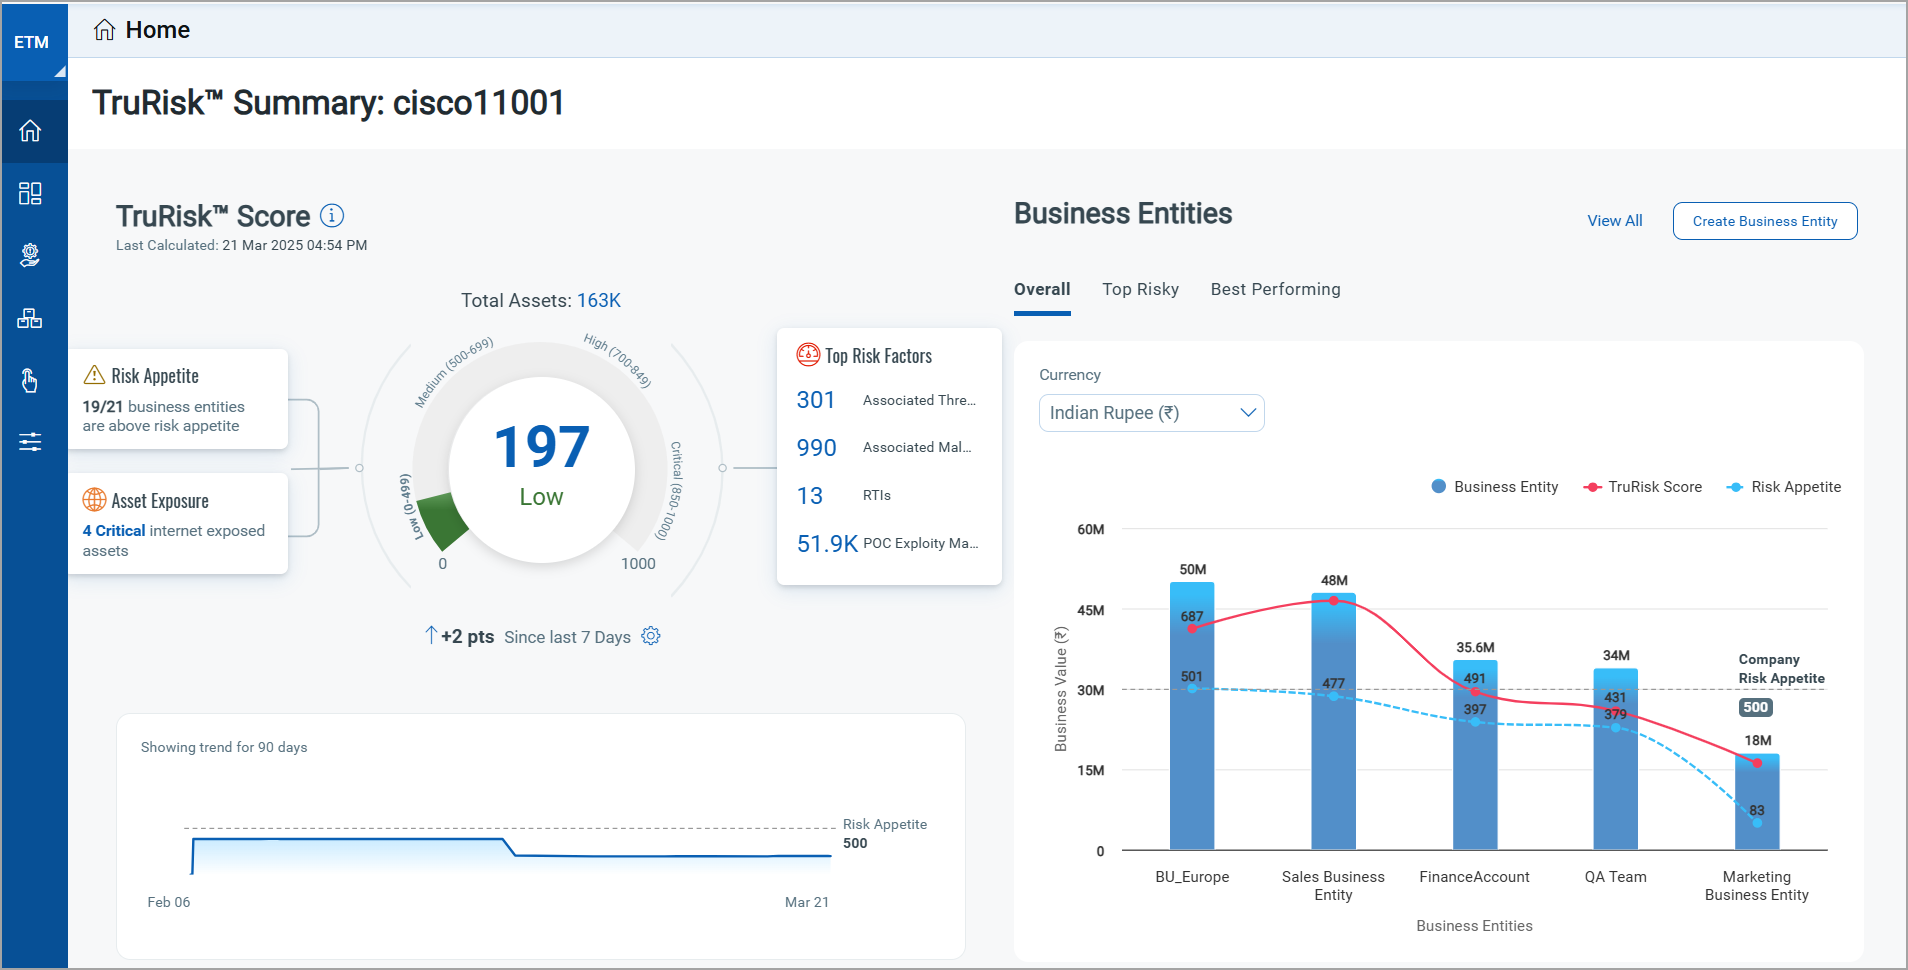
On the Home page, the TruRisk™ Summary breaks that overall score down into the following:
- TruRisk™ Score — your organization's overall score, rolled up from every in-scope asset and business entity.
- Risk Appetite — the threshold you set during onboarding; the summary shows how many business entities exceed it.
- Asset Exposure — the count of vulnerable assets carrying external-facing tags.
- Overall Business Entities and Top Risky / Best Performing Business Entities — the same score viewed by business entity, so you can see where risk is concentrated and where it's under control.
- Trending threats and impacted counts — how the score is moving over time for the organization and for each business entity.
How TruRisk™ Is Calculated
TruRisk™ is built in two layers:
- Base calculation — for each asset, ETM combines the asset's Asset Criticality Score (ACS) — how important that asset is to the business — with the risk of its findings (severity, exploitability, and threat context such as active exploitation). Asset-level scores roll up to business entity and organization-level scores.
- Customization layer — you can adjust the base score with Risk Factors and Compensatory Factors so it reflects your environment and controls. The original finding data is never changed; the adjustment is a non-destructive, auditable, and reversible layer on top of it.
ACS itself comes from tags: a tag carries a criticality score of 1–5, and every asset that receives the tag inherits it (an asset with multiple tags takes the highest score). Assets can also get an AI-predicted ACS instead of a manual tag. Either way, changing an asset's criticality doesn't move its TruRisk™ score immediately — scores update on a recalculation cycle, or on demand when you trigger a manual recalculation.
Risk Factors
Two kinds of risk factor feed into TruRisk™:
System-defined (Top Risk Factors)
Shown in the TruRisk™ Summary. These describe the risk criteria of vulnerabilities detected across your assets: CISA Known Exploitable, Associated Threat Actors, Associated Malware, and Weaponized Vulnerability.
Custom (Risk and Compensatory Factors)
Risk Factors increase the score for conditions that raise exposure — internet-facing systems, privileged accounts, critical business assets, unpatched high-risk vulnerabilities, or factors specific to your industry, geography, or regulatory requirements. Compensatory Factors credit existing controls — such as EDR, firewalls, or network segmentation — by reducing the score where those controls meaningfully lower risk.
Custom factors are applied in a defined order — Risk Factors amplify exposure, Compensatory Factors credit defenses — so the resulting score transformation stays controlled and predictable. For the steps to create a Risk Factor or Compensatory Factor, see TruRisk™ Customization.
Risk Score Interpretation
Read the TruRisk™ score relative to the Risk Appetite you set, and relative to its own trend over time:
- Against Risk Appetite — business entities with a TruRisk™ score above your risk appetite appear under Top Risky Business Entities (sorted by business value × TruRisk™); entities at or below appetite appear under Best Performing Business Entities. A high-value entity that's also a Best Performing entity is carrying its business importance well; a high-value entity that's Top Risky is where to focus first.
- Over time — the Trending view shows whether the Risk Appetite score for the organization, and for each business entity, is improving or worsening, so a single point-in-time score is less useful than its direction.
- Against a remediation plan — when you prioritize findings in the Risk Workbench, Potential TruRisk™ Reduction shows the projected improvement if you remediate the selected findings, letting you interpret the current score as the ceiling you're working down from.